
6 min
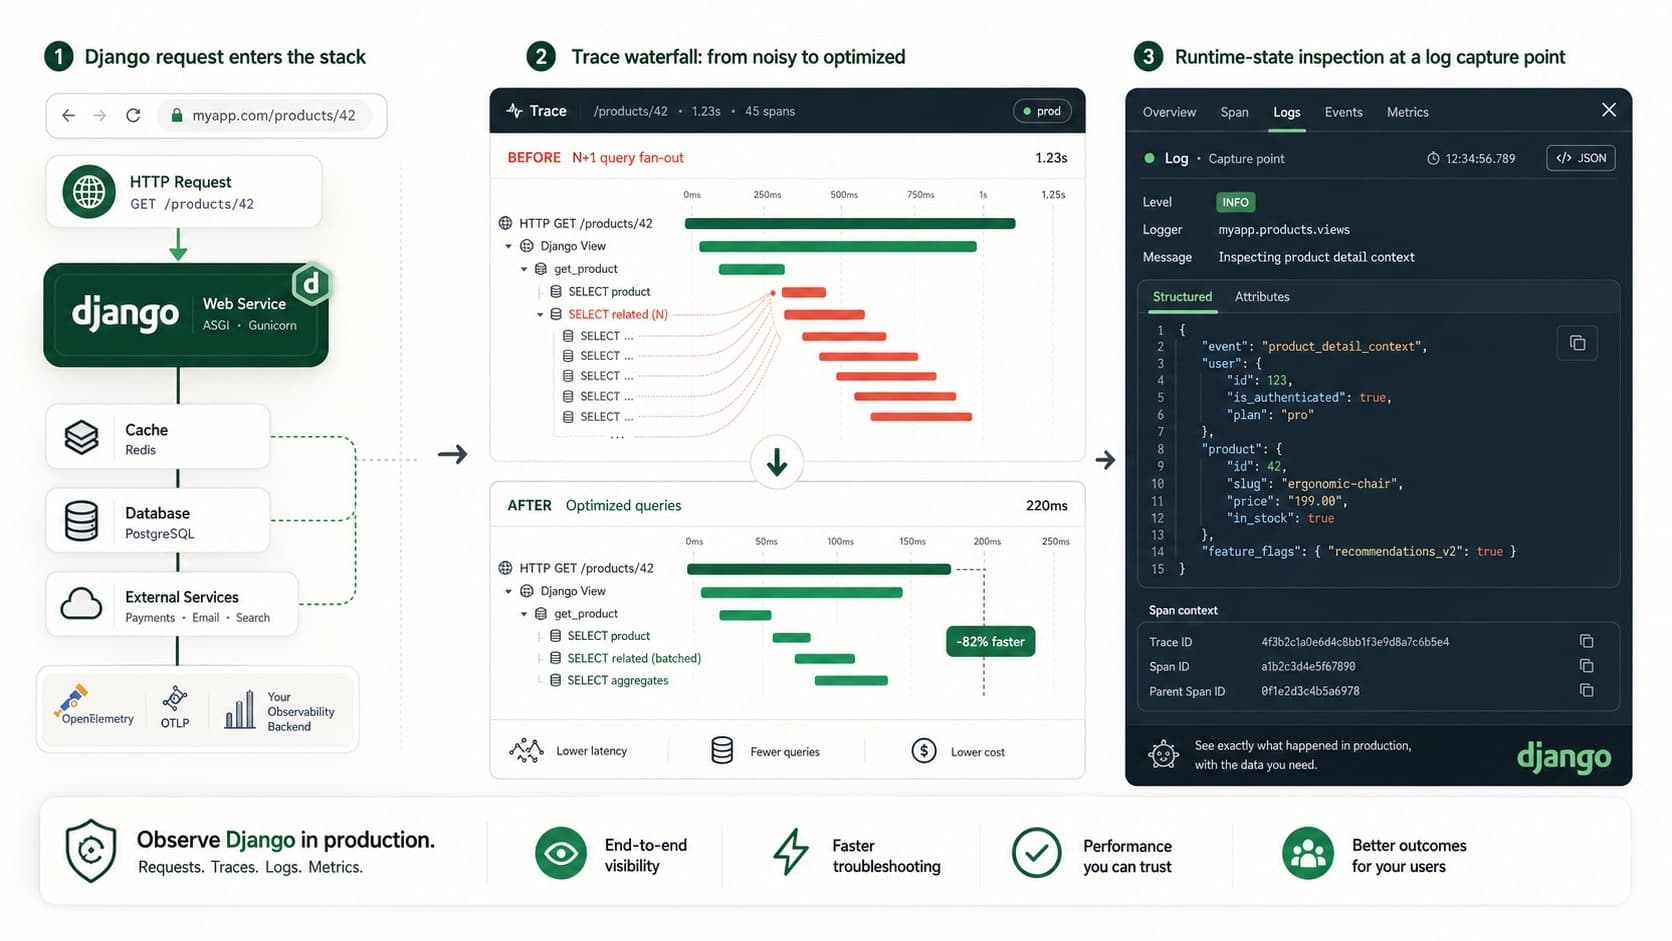
Django Observability Checklist for Production
Build Django observability with traces, query visibility, alerts, and dynamic logs so you can debug production issues without guessing.
djangoobservability
Build Django observability with traces, query visibility, alerts, and dynamic logs so you can debug production issues without guessing.
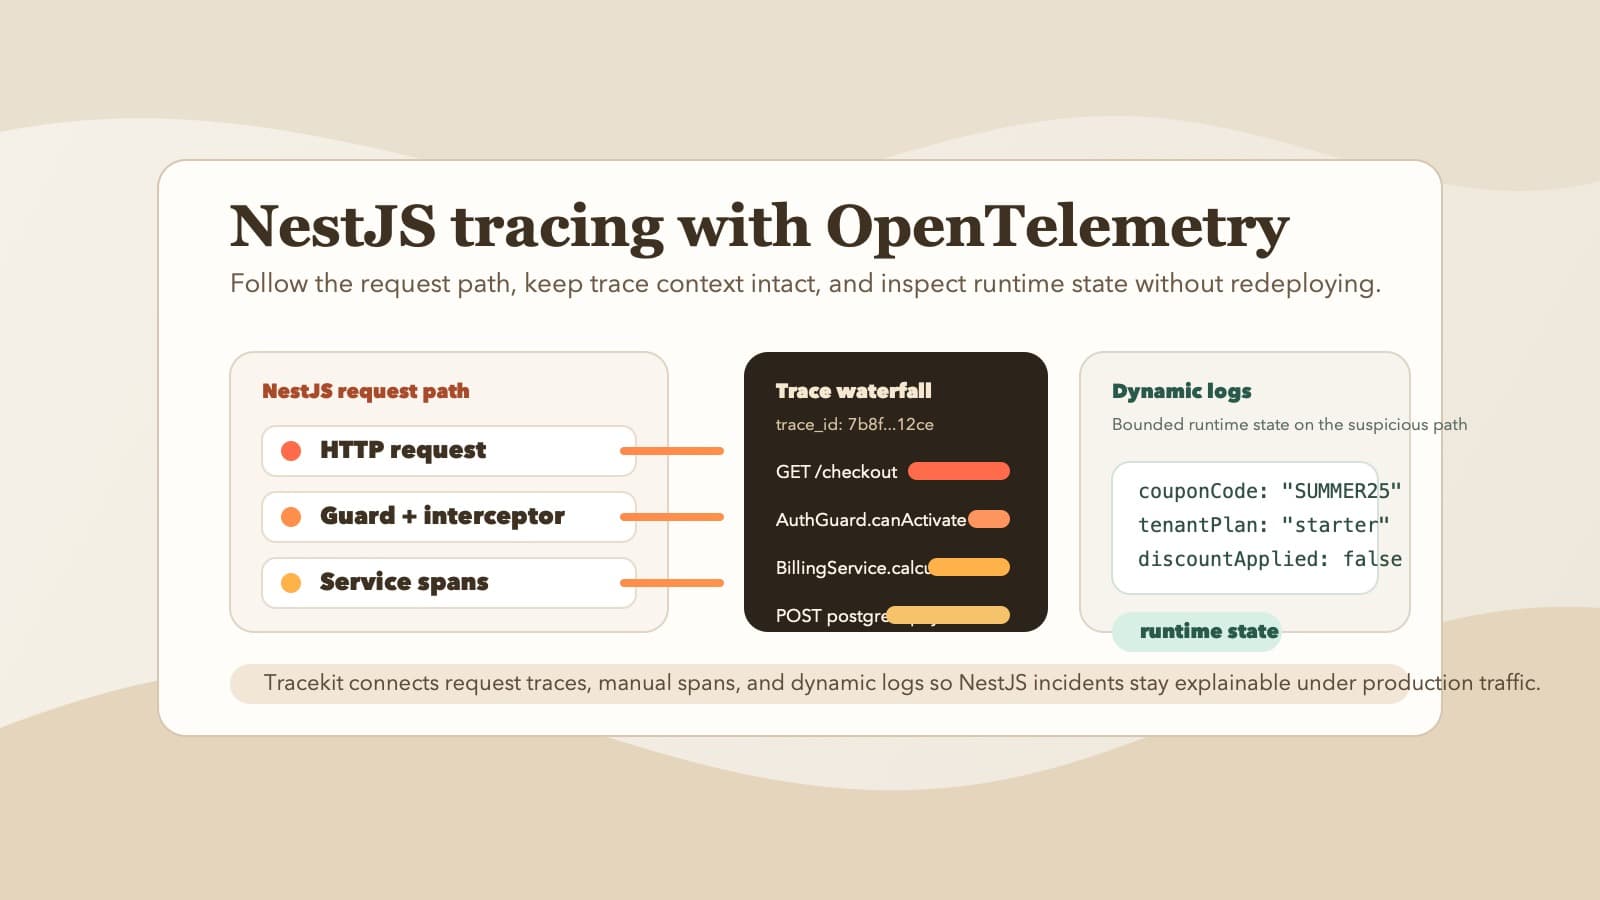
Build NestJS observability across HTTP requests and queue jobs. Compare NestJS Observe, OpenTelemetry, and Tracekit coverage with a practical test.
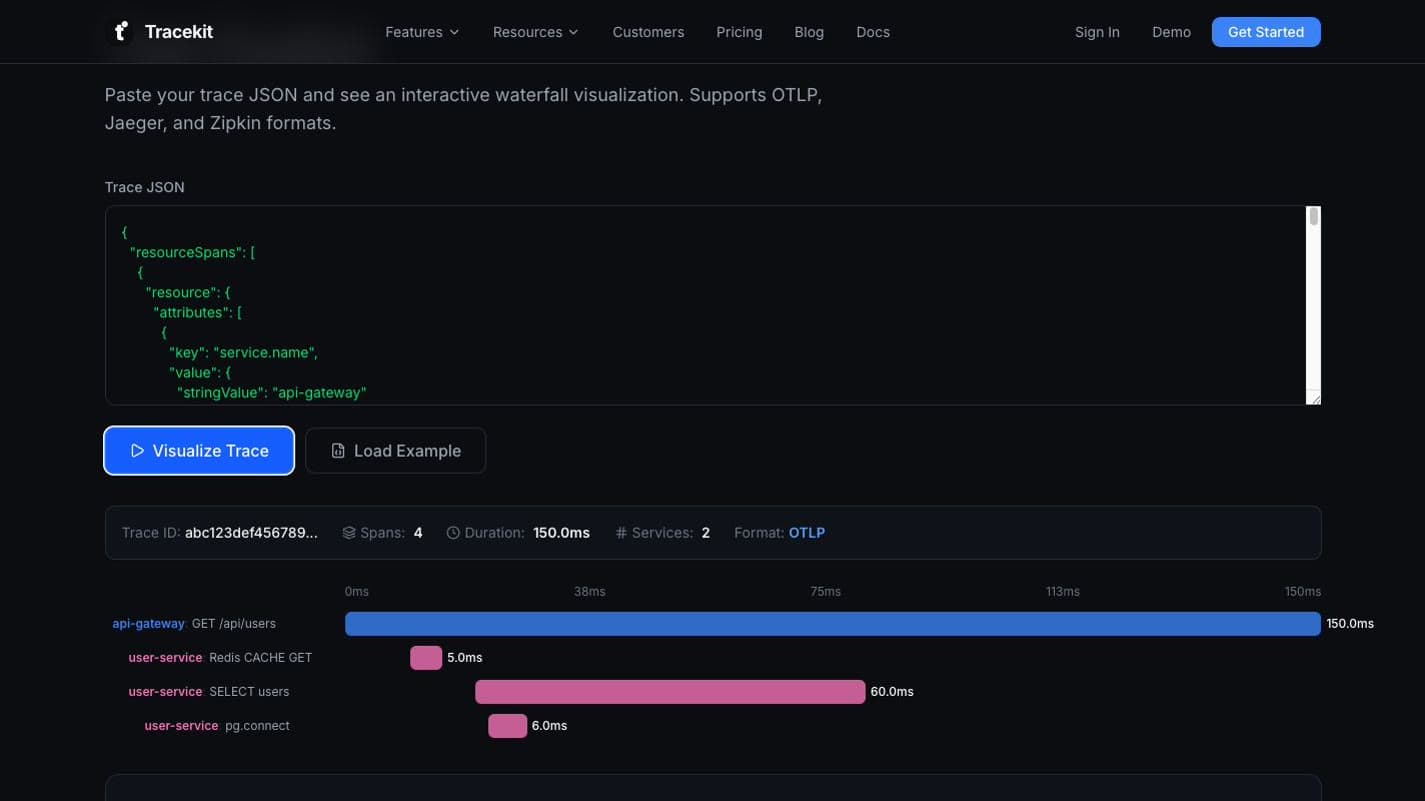
Visualize OpenTelemetry traces online, read the waterfall, fix export errors, and choose the right OTel trace viewer for each debugging job.

Debug Gin framework apps in production with OpenTelemetry tracing, pprof profiling, GORM query optimization, and structured logging for Go services.
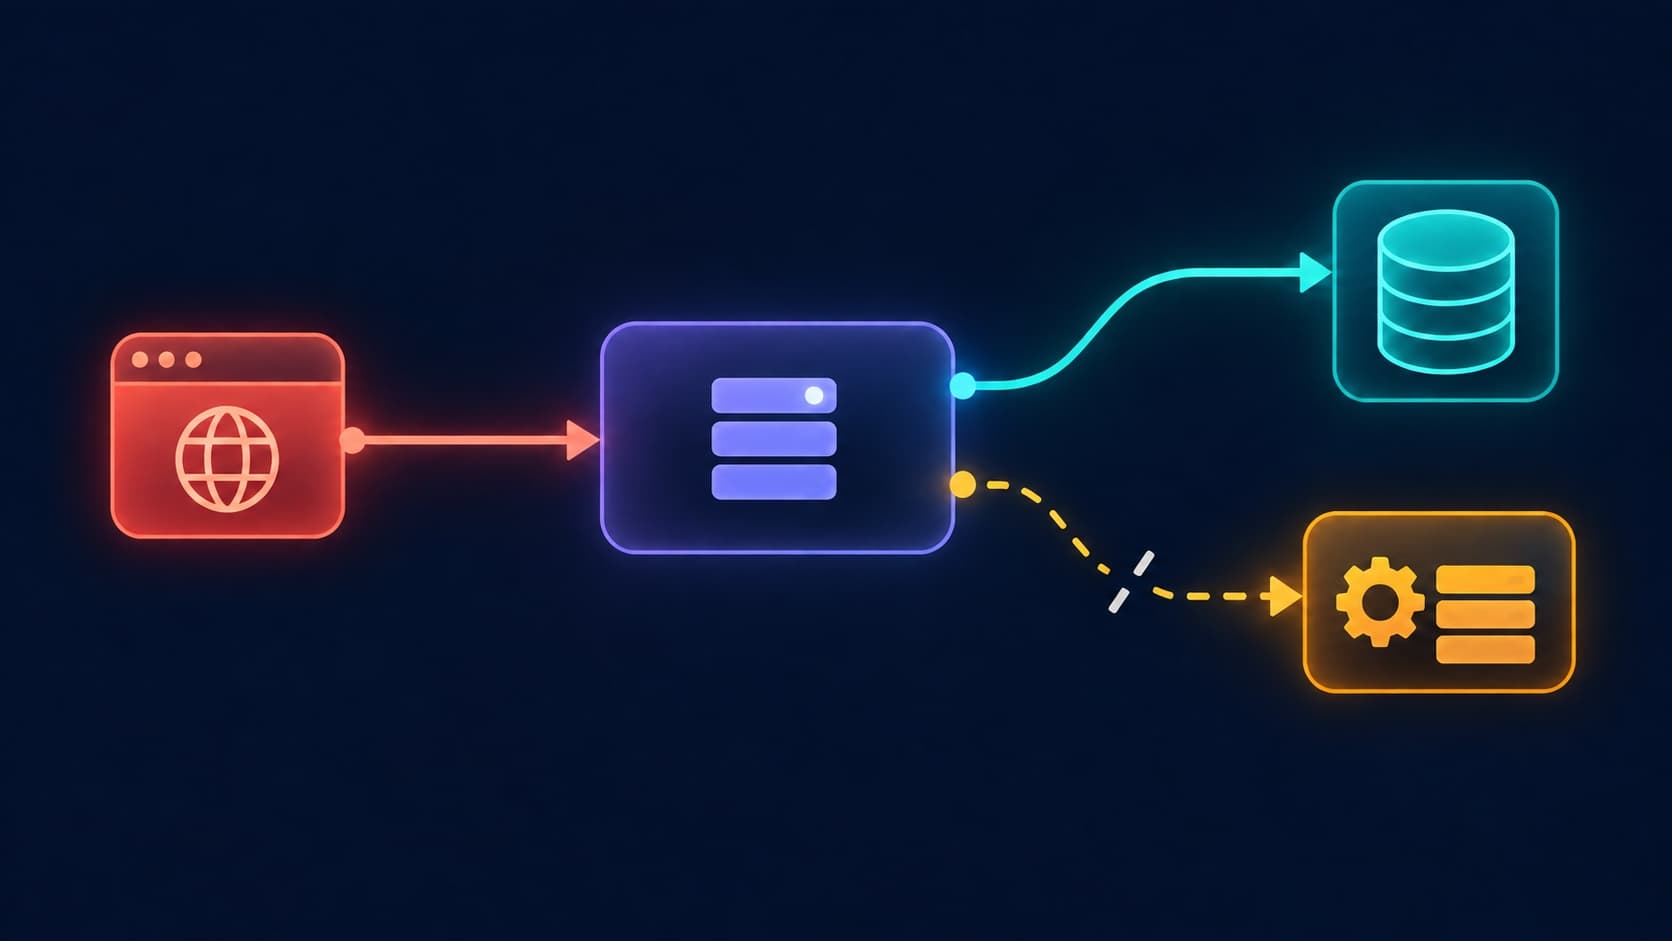
Set up OpenTelemetry PHP auto-instrumentation for Laravel, configure OTLP before autoload, and verify request, SQL, and queue trace boundaries.

Fix intermittent 500 errors systematically. Reproduce, investigate logs, trace requests, and capture application state to find the root cause.
Your API threw a 500 at 3 AM. A systematic approach to diagnose, trace, and fix production API errors without the panic and guesswork.
Get production visibility without the Datadog bill. Free-tier APM setup with OpenTelemetry for freelancers and small teams who need traces, not invoices.

Use session context to debug distributed systems. Attach trace IDs and correlation IDs to requests for seamless tracking across microservices.
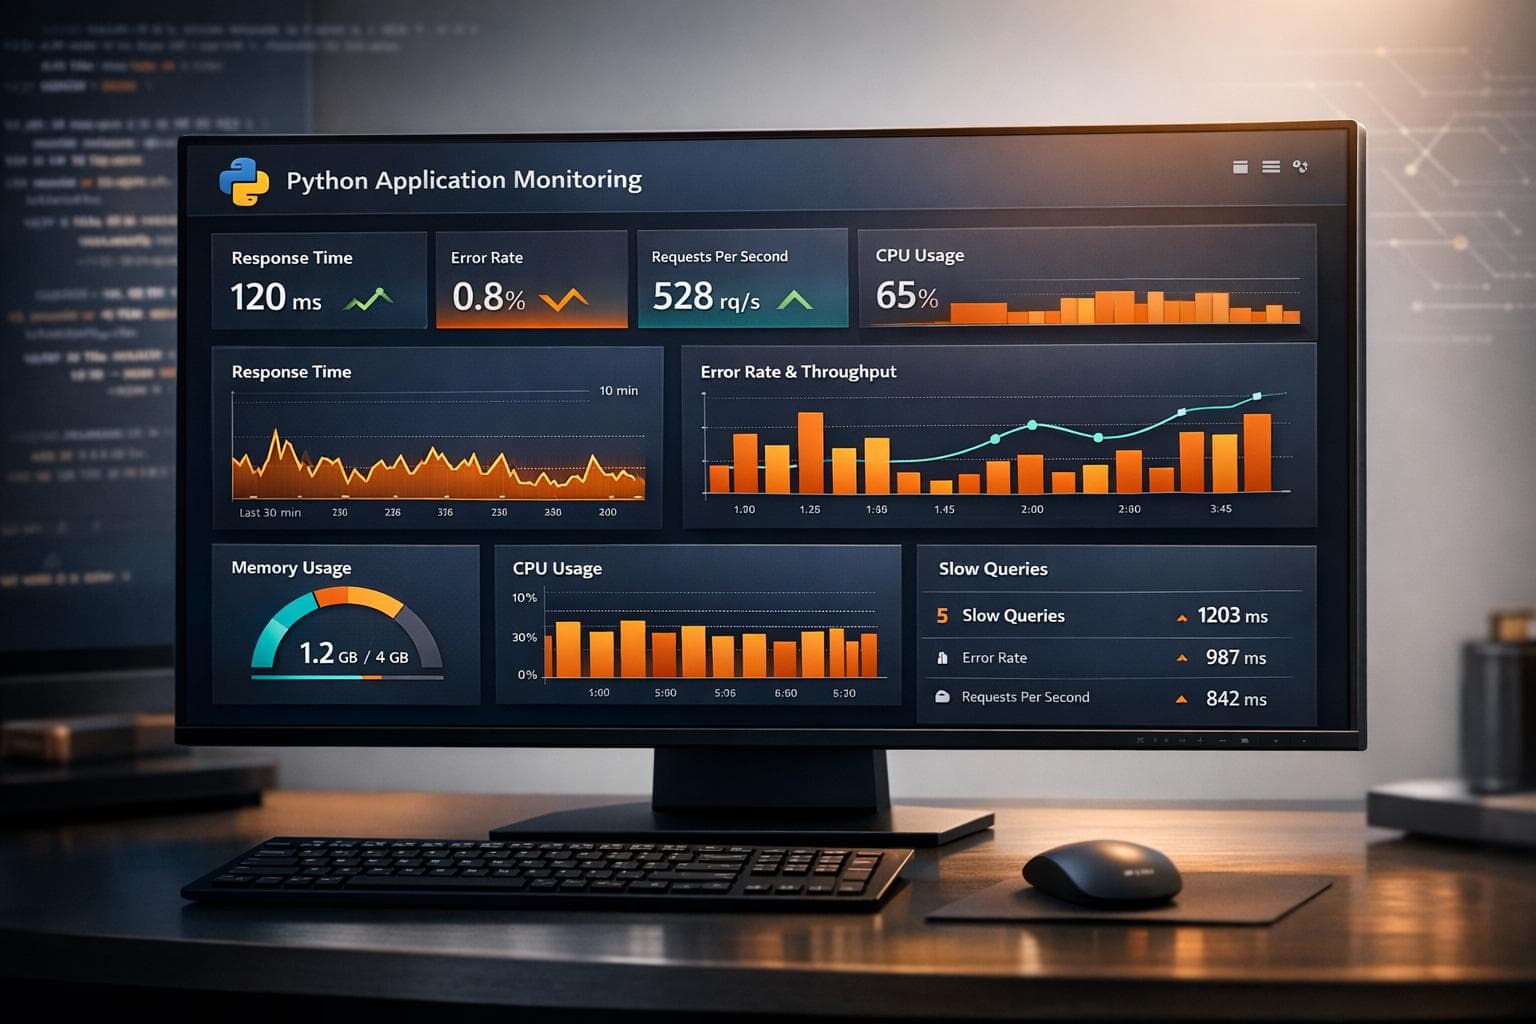
Set up Python application performance monitoring with OpenTelemetry. Measure latency, errors, throughput, and dependency spans across production requests.

Debug production APIs without relying on logs. Use distributed tracing, dynamic logs, and AI anomaly detection to find root causes 70% faster.

Trace code latency spikes with metrics, distributed traces, custom spans, and runtime state. Follow a practical production workflow.