
NestJS Observability: HTTP, Queues, and Trace Gaps
Build NestJS observability across HTTP requests and queue jobs. Compare NestJS Observe, OpenTelemetry, and Tracekit coverage with a practical test.
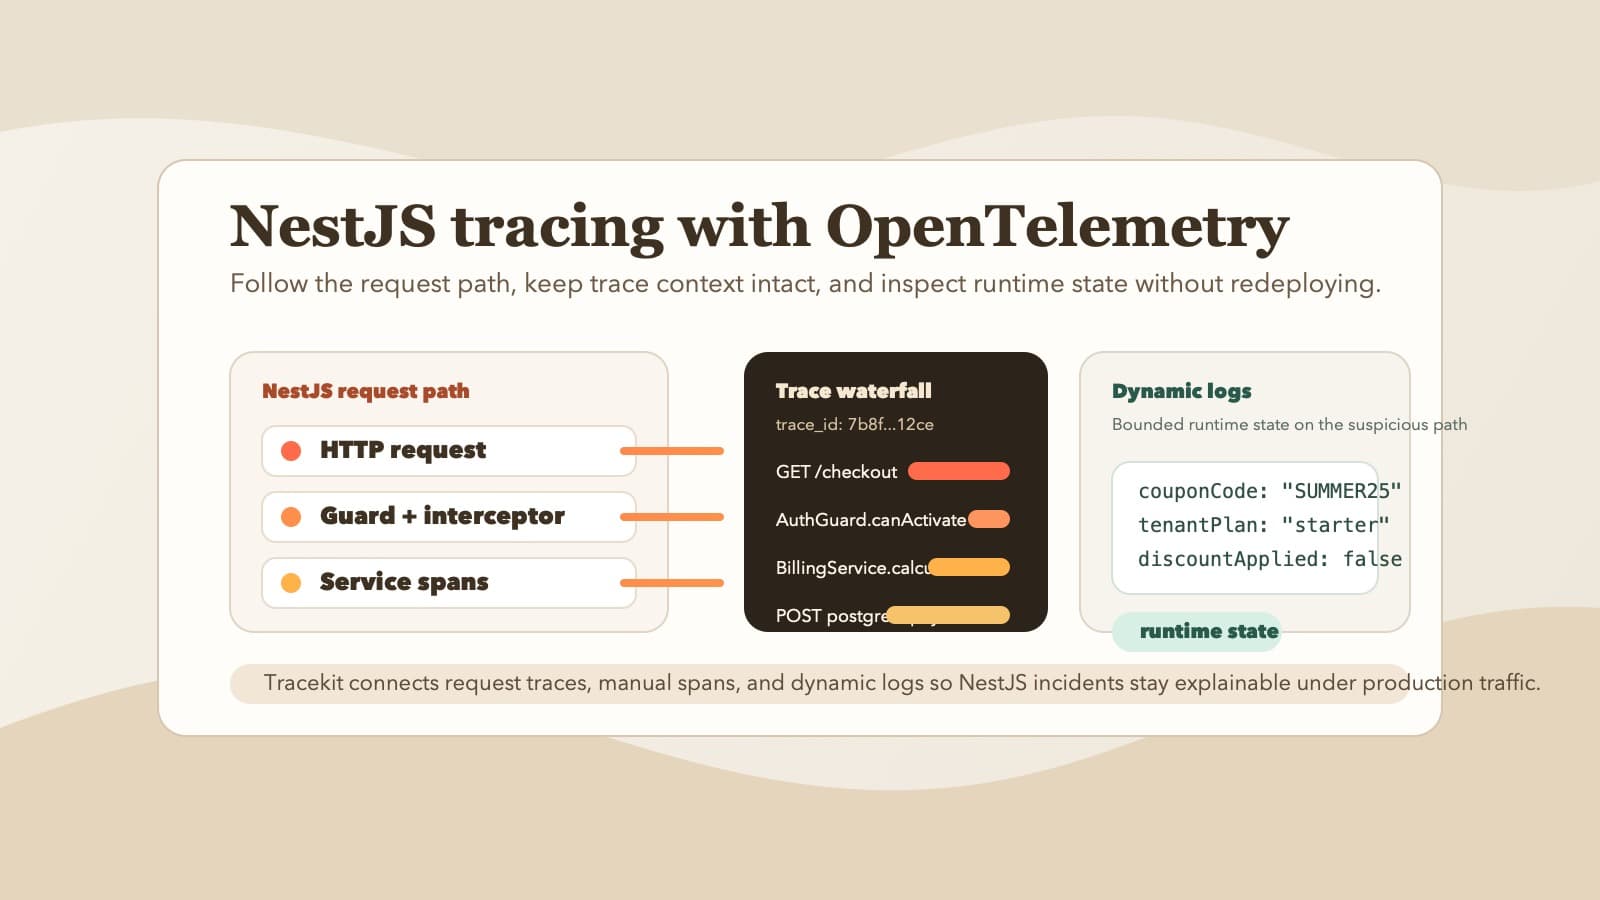
NestJS observability needs more than one HTTP latency chart. A request can return quickly while a queue job fails minutes later. A trace can show the controller but lose the worker after a message handoff. This guide compares three instrumentation paths and gives you one test for both sides of that boundary.
The paths are the official NestJS Observe SDK, OpenTelemetry instrumentation, and Tracekit's NestJS module. Their documented coverage differs. Use the same request-to-worker test before you rely on any dashboard.
Choose a NestJS observability path
| Path | Documented starting point | Check before production |
|---|---|---|
| NestJS Observe | Its official SDK instruments NestJS requests, jobs, errors, and traces for its dashboard. | Confirm your NestJS version and the specific transports and queue library you use. |
| OpenTelemetry for Node.js | Configure the Node SDK, supported instrumentation, and an exporter. | Confirm startup order, dependency spans, and context propagation into workers. |
| Tracekit NestJS module | Its global interceptor records NestJS HTTP controller requests in Tracekit. | Instrument workers separately and check whether dependency spans link to the HTTP span. |
The NestJS Observe SDK guide requires @nestjs/core v11.1.4 or later. It requires @nestjs/graphql v13.4.4 or later for GraphQL. Its instrument application option attaches through NestJS framework hooks. Tracekit's maintained Node.js guide documents a different module path for NestJS 10.x. Do not copy setup steps from one path into another.
NestJS Observe documents broad framework coverage, including queue consumers. That does not prove your queue message keeps trace context across every process boundary. Verify the trace ID and worker span with a real job. If you combine instrumentation paths, check for duplicate HTTP spans and competing providers before deployment.
Monitor the request and the work it starts
Start with these questions for one important route, such as POST /orders:
| Path | Signal to check | Question during an incident |
|---|---|---|
| Incoming HTTP | request rate, duration, status, handler | Did the route slow down or fail? |
| Dependency call | duration, error, service name | Did a database or remote call cause the delay? |
| Queue handoff | job name, enqueue time, trace context | Did the request create a job? |
| Worker | wait time, run time, retry count, failure | Did the job start and finish? |
| Node.js process | event-loop delay, memory, process health | Did local resource pressure affect the path? |
Do not treat a successful HTTP response as proof that the background job succeeded. The NestJS queue guide describes a separate producer and consumer. Each side needs its own checks.
The official NestJS Observe guide describes framework-level coverage for requests and jobs. Tracekit's NestJS interceptor has a narrower, HTTP-first boundary. The test below makes either gap visible.
Set up the Tracekit NestJS HTTP path
The current Tracekit Node SDK exports TracekitModule. Its forRoot() method registers a global interceptor. This example matches the Node.js integration guide:
npm install @tracekit/node-apm
// app.module.ts
import { Module } from '@nestjs/common';
import { TracekitModule } from '@tracekit/node-apm/nestjs';

@Module({
  imports: [
    TracekitModule.forRoot({
      apiKey: process.env.TRACEKIT_API_KEY!,
      serviceName: 'orders-api',
      endpoint: 'https://app.tracekit.dev/v1/traces',
      enableCodeMonitoring: true,
    }),
  ],
})
export class AppModule {}
Use a stable serviceName for each deployable service. Keep the API key on the server. Send one real request through a controller, then inspect the trace and error state. The interceptor records the HTTP method, URL, route, status, duration, controller, and handler. It samples requests when configured to do so.
The interceptor returns immediately for non-HTTP execution contexts. It does not automatically cover queue consumers, scheduled jobs, or every NestJS microservice transport. It also starts its HTTP span without making that span the active OpenTelemetry context. Do not assume that every automatic dependency span is a child of this NestJS span. Check the parent-child links in a real trace before you rely on the waterfall.
If you use a separate OpenTelemetry Node SDK or auto-instrumentation, follow its own initialization instructions. The OpenTelemetry Node.js guide explains its setup. Avoid two competing providers or duplicate HTTP spans. Test the actual combination in a staging application.
Test the queue boundary with one trace
Choose a request that publishes one job. Record the request trace ID, job ID, enqueue time, and result. Then ask these questions:
- Does the producer create a send span or a clear job event?
- Does the message carry trace context, such as W3C
traceparent? - Does the worker extract that context before it starts its work span?
- Can you follow the worker and its database calls from the request?
- What happens when the worker retries or sends the job to a failure queue?
The W3C Trace Context specification defines the headers. The OpenTelemetry messaging conventions explain producer and consumer spans. A queue library does not guarantee this link by itself. Add propagation and worker instrumentation where your library does not provide them.
The cover illustrates this test. The dotted handoff is missing trace context, not paused application execution. The connected path shows the result you should verify after instrumentation.
| Symptom | First check | Next action |
|---|---|---|
| HTTP trace ends at enqueue | Inspect the message headers | Inject context at the producer and extract it at the worker. |
| Worker span exists as a new trace | Compare trace IDs and parent IDs | Verify extraction before the worker span starts. |
| Queue time is invisible | Compare enqueue and start timestamps | Add a queue-wait measure with bounded job attributes. |
| A retry looks like a new failure | Inspect attempt count and job ID | Keep stable job identity and show each attempt. |
| No worker data arrives | Check worker initialization and exporter errors | Instrument the worker process separately. |
Do not place secrets or full customer payloads in span attributes. Prefer a bounded job type, safe identifier, and attempt count.
Check latency, errors, and process pressure together
Set a baseline for request rate, error rate, and route latency. Compare a slow route with dependency duration and worker time. A p95 rise with stable request volume can point to a slow dependency. A rising queue wait with steady worker run time can point to limited worker capacity.
Node.js process signals add another check. Measure event-loop delay and memory in the process that handles the work. The Node.js monitoring checklist explains monitorEventLoopDelay() and eventLoopUtilization(). Tracekit's NestJS interceptor does not collect those process signals by itself. Add or verify the relevant metrics instrumentation before you build an alert from them.
Keep alert rules tied to a user-visible failure or a persistent backlog. A single slow request can be noise. Repeated worker failures, a growing queue, and rising route latency together deserve attention. See the trace-based alerts guide for sampling and missing-telemetry checks.
Inspect runtime state only after you find the path
A trace can show that a controller or worker took the wrong branch. It might not show the variable that caused that choice. Tracekit dynamic logs can capture selected runtime state at a capture point. The Node SDK method is named captureSnapshot() internally:
// Inside a service that receives the injected TRACEKIT_CLIENT.
await this.tracekit.captureSnapshot('order-decision', {
  orderType,
  retryAttempt,
});
Enable enableCodeMonitoring for this path. Review each variable before capture. Keep secrets, tokens, and full request bodies out of the payload. Dynamic logs are bounded capture points, not general log ingestion. Use them after the trace and metrics narrow the problem.
A five-minute production check
Before you call NestJS monitoring complete, run this test with a real request and job:
- Confirm the controller span has the expected handler, status, and duration.
- Confirm the dependency spans you expect appear, and check their parent links.
- Confirm the queue message carries context and the worker extracts it.
- Compare enqueue, start, retry, and finish times for the job.
- Check a failing request and a failing worker attempt separately.
- Check route latency with event-loop delay, memory, and queue depth.
- Review capture-point variables for sensitive data.
Start with the Tracekit Node.js guide for the supported HTTP setup. Use distributed tracing to inspect the path you actually collected. Add queue and process coverage only after you confirm the gaps in your own application.
Related Posts
Your API Just Threw a 500. Here's How to Actually Fix It.
Your API threw a 500 at 3 AM. A systematic approach to diagnose, trace, and fix production API errors without the panic and guesswork.
Zero-Cost Production Visibility: APM Without the Datadog Bill
Get production visibility without the Datadog bill. Free-tier APM setup with OpenTelemetry for freelancers and small teams who need traces, not invoices.
Node.js Response Time Monitoring by Route
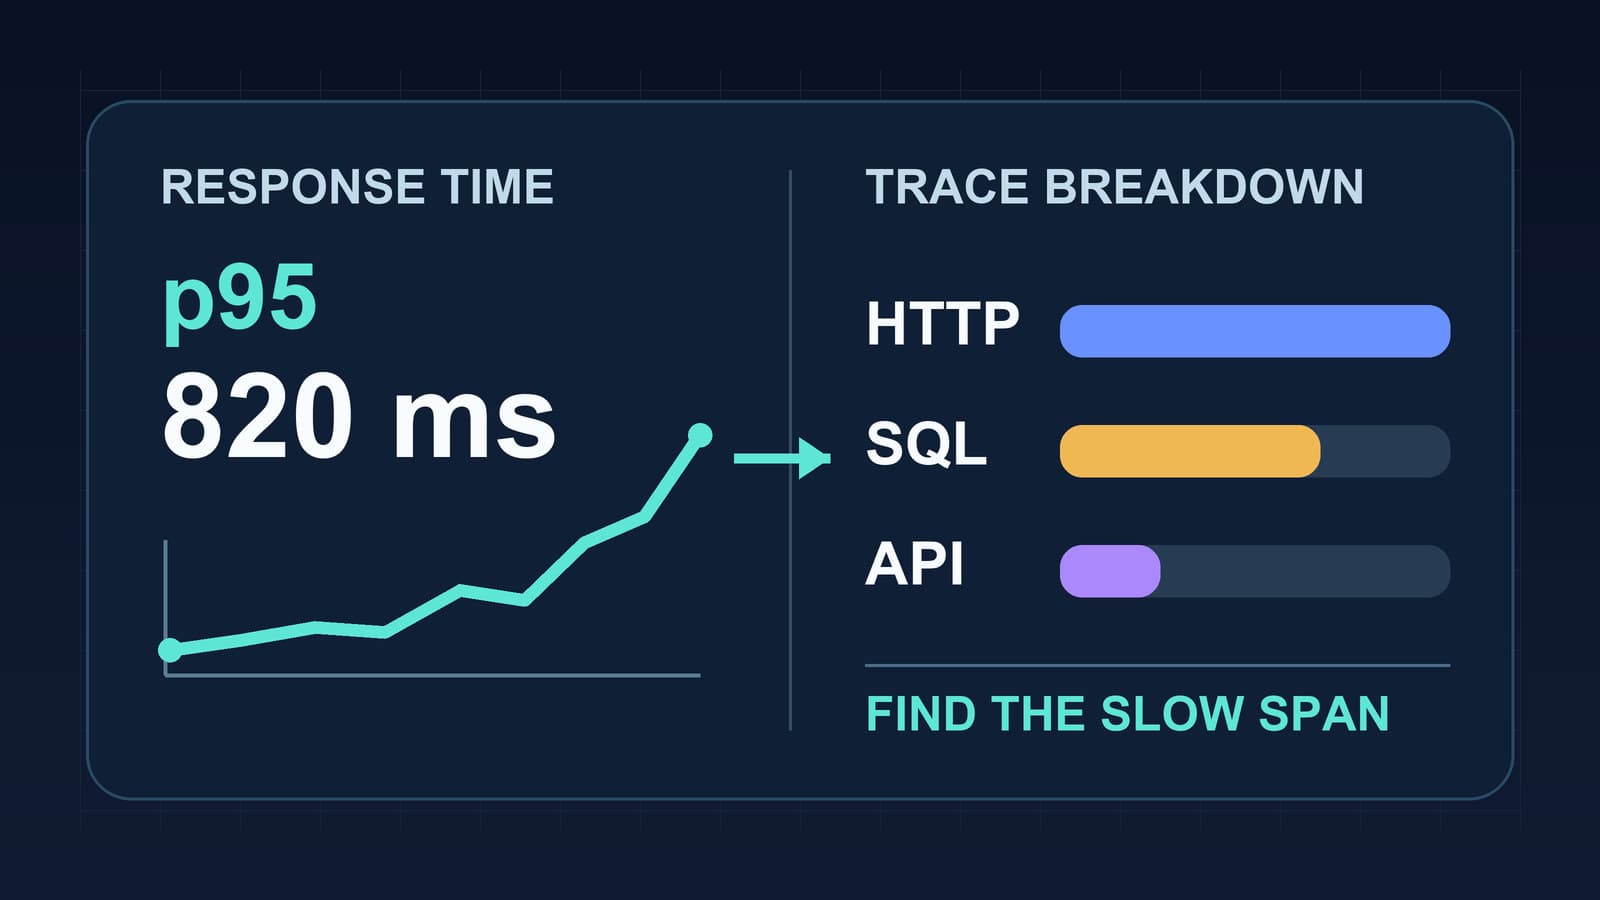
Measure Node.js response time by route, read p95 latency with traces, and separate event loop delays from database and API waits.