
Migrate to OpenTelemetry Without Downtime
Migrate to OpenTelemetry without downtime with a parallel Collector path, trace parity checks, and a safe service-by-service cutover.
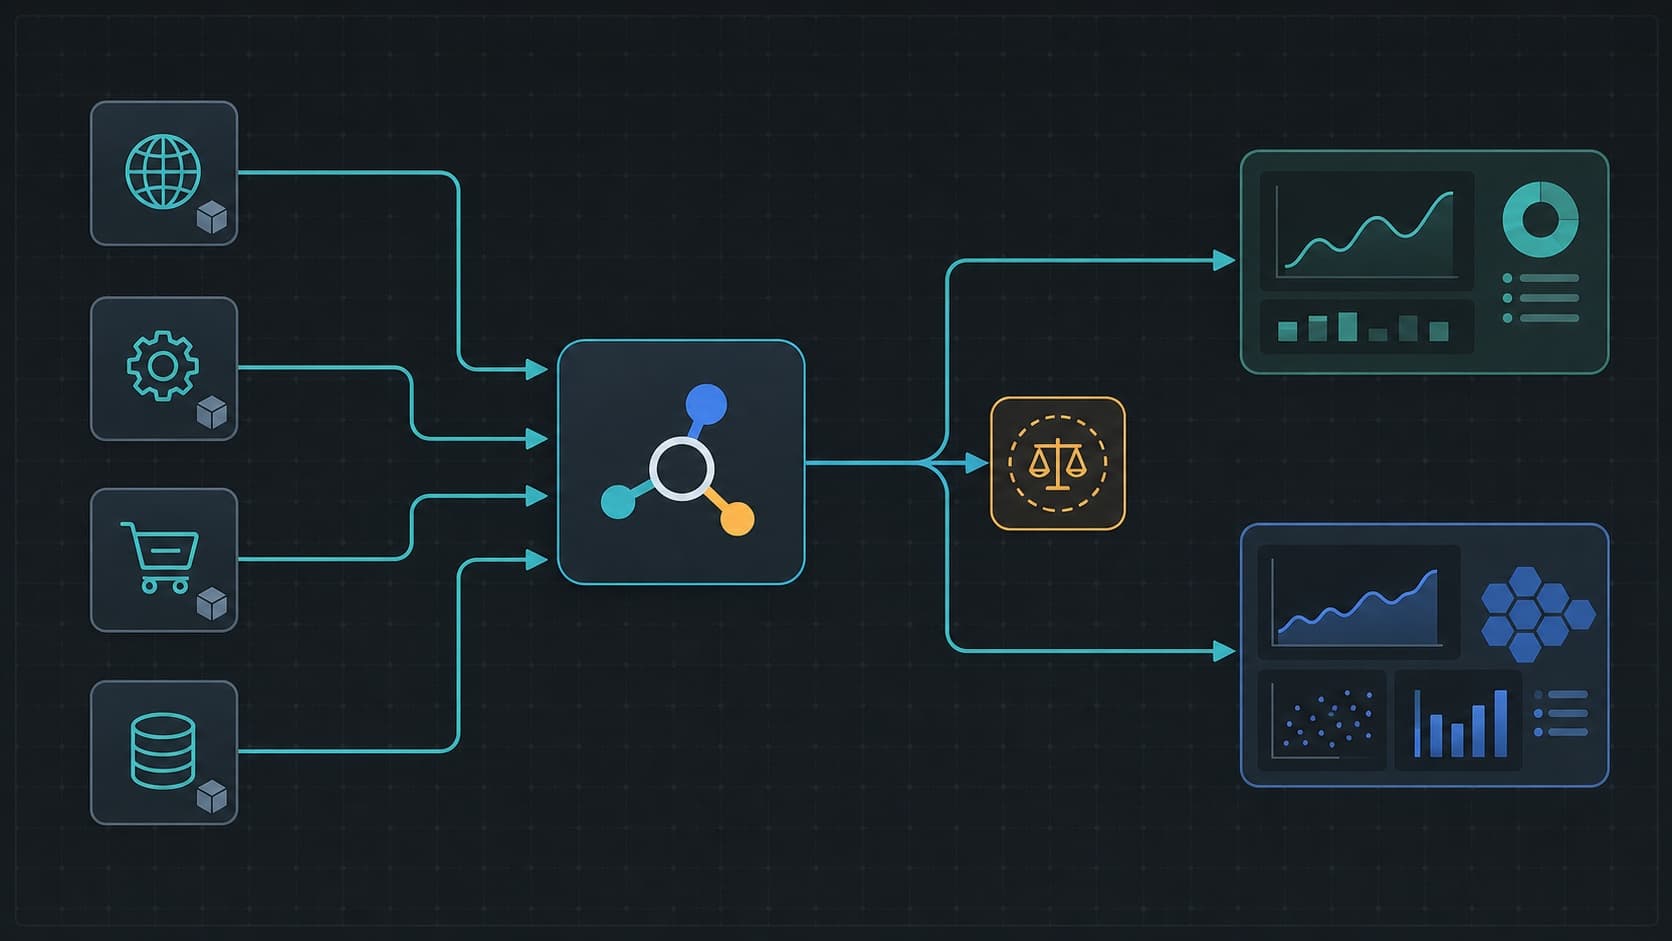
To migrate to OpenTelemetry without downtime, run the new telemetry path beside the current path. Start with one service, compare both results, and remove the old agent only after the new path is complete.
The important detail is where you run both systems. A Collector can export one OpenTelemetry stream to two backends. Running two auto-instrumentation agents inside one process is different. It can create duplicate spans, competing patches, extra resource use, and broken parent relationships.
This guide shows the safer pattern. It also explains when temporary agent coexistence is necessary and how to verify each cutover.
The Short Answer
Use this sequence:
- Inventory the current agent, custom spans, propagation headers, sampling rules, dashboards, and alerts.
- Add an OpenTelemetry Collector without removing the current path.
- Send one OpenTelemetry stream to both backends when both backends accept OTLP.
- If the current backend needs its own agent, migrate one service and compare the two systems separately.
- Keep one instrumentation owner inside each process when possible.
- Verify trace structure, service metadata, errors, latency, and pipeline health.
- Cut over one service at a time, then remove the old agent and its configuration.
For Elastic APM, record the effective sampling setting first. The Elastic transaction sample rate guide explains the setting and its OpenTelemetry mapping.
The OpenTelemetry Migration Guide covers the broader SDK conversion. This article focuses on the parallel production stage.
Choose the Right Parallel Migration Pattern
Teams often use the term “run both” for three different designs. Their risks are not equal.
| Pattern | What runs in the application | Where data splits | Main risk |
|---|---|---|---|
| Collector fan-out | One OpenTelemetry SDK or agent | Collector exporters | Temporary duplicate storage and network cost |
| Separate old and new agents | Two instrumentation systems | Inside or beside each service | Duplicate spans, hook conflicts, and extra CPU or memory |
| Service-by-service cutover | One agent per service, but different services use different agents | Across the estate | Broken trace context at mixed service boundaries |
Prefer Collector fan-out when the current and new backends both accept OTLP. The OpenTelemetry Collector receives, processes, and exports telemetry without tying the application to one backend.
Use separate agents only when the current vendor cannot receive the same OTLP stream. Check the vendor's compatibility documentation first. Do not assume two automatic agents can patch the same HTTP, database, or framework libraries safely.
Build a Collector Fan-Out Path
The Collector configuration model has receivers, processors, exporters, and service pipelines. A trace pipeline can list more than one exporter.
This example sends the same OTLP trace stream to a current OTLP-compatible backend and Tracekit:
receivers:
  otlp:
    protocols:
      grpc:
        endpoint: 0.0.0.0:4317
      http:
        endpoint: 0.0.0.0:4318

processors:
  batch: {}

exporters:
  otlphttp/current:
    endpoint: ${env:CURRENT_OTLP_ENDPOINT}
    headers:
      Authorization: ${env:CURRENT_OTLP_AUTH}

  otlphttp/tracekit:
    traces_endpoint: https://app.tracekit.dev/v1/traces
    headers:
      X-API-Key: ${env:TRACEKIT_API_KEY}

service:
  pipelines:
    traces:
      receivers: [otlp]
      processors: [batch]
      exporters: [otlphttp/current, otlphttp/tracekit]
The current backend must support OTLP for this exact design. Replace its endpoint and authentication settings with its documented values.
The Tracekit endpoint and X-API-Key header match the current Tracekit Node.js exporter implementation. The backend accepts OTLP traces at /v1/traces.
Validate the Collector configuration before deployment:
otelcol validate --config=otel-collector.yaml
The official Collector configuration guide documents the validation command and pipeline structure. Use the Collector's own telemetry to watch refused spans, export failures, queue pressure, and retries during the migration.
Do Not Confuse Fan-Out With Double Instrumentation
Collector fan-out duplicates export, not instrumentation. Each request still produces one span set in the application.
Double instrumentation can produce two server spans for one request. Both agents might also patch the same database client or HTTP library. The result can include duplicate child spans, inconsistent service names, and two different trace IDs for one transaction.
Use this rule:
Keep one automatic instrumentation owner per process unless both vendors explicitly document a supported coexistence mode.
If you must run two agents temporarily, restrict the test to one non-critical service. Measure process CPU, memory, startup time, request latency, and telemetry volume. Then verify every important library once.
For Node.js, initialization order also matters. The dd-trace initialization guide explains why a tracer must load before the modules it patches. Starting a second agent later does not remove that conflict.
Preserve Trace Context Across Mixed Services
A phased migration creates mixed traces. One service can use the old agent while the next service uses OpenTelemetry.
OpenTelemetry uses the W3C traceparent and tracestate headers by default. The W3C Trace Context specification defines how tracing tools exchange a shared trace identity across vendor boundaries.
Before the first service cutover, check these points:
- The old agent injects W3C Trace Context, or the new SDK accepts its legacy format.
- The new SDK extracts incoming context before it creates the server span.
- Outbound HTTP, RPC, and message clients inject context.
- Queue producers and consumers carry context in supported message metadata.
- Proxies and gateways preserve the required headers.
- Sampling decisions do not unexpectedly change at a mixed boundary.
The OpenTelemetry context propagation guide explains how trace IDs and parent IDs connect work across processes. Tracekit's session context guide adds practical checks for trace IDs and correlation IDs.
If a trace splits at one service boundary, inspect the incoming traceparent, the new server span's parent ID, and the outbound header. Do not increase sampling to hide a propagation defect.
Migrate One Service Without Losing Visibility
Choose a service that has real traffic but limited business risk. It should call at least one downstream service and one instrumented dependency.
1. Record the current baseline
Capture a normal traffic window and one controlled error path. Record:
- service name, namespace, version, and environment;
- route and operation names;
- span count for representative requests;
- parent and child relationships;
- dependency and database spans;
- latency percentiles by route;
- error status and exception attributes;
- current sampling behavior.
Do not use only a health check. A health check rarely exercises databases, queues, external APIs, or application errors.
2. Add the new path
Deploy the Collector first. Then configure the selected service to export through OTLP.
OpenTelemetry supports zero-code instrumentation for several common language runtimes. You can also use an SDK when you need custom spans or explicit resource configuration.
Keep stable resource attributes across the test. At minimum, preserve service.name, deployment environment, and service version. A name change can make one service look like two services during comparison.
3. Generate representative traffic
Exercise these paths when they exist:
- a successful request with database work;
- an outbound HTTP or RPC call;
- a queue publish and consume cycle;
- a slow request;
- one safe, controlled error;
- a background task that starts after the response.
Use the same request inputs in both backends. Save trace IDs or another stable correlation value when both systems expose them.
4. Compare trace parity
Do not compare only the number of traces. Sampling and retry behavior can make raw counts differ.
Compare these details:
| Check | Pass condition |
|---|---|
| Entry span | The route or operation has the correct name and duration |
| Trace tree | Expected parent and child spans remain connected |
| Dependencies | Database, HTTP, RPC, and queue work appears once |
| Resources | Service, version, and environment identify the correct deployment |
| Errors | Controlled failures keep their status and exception detail |
| Latency | Route distributions remain operationally consistent |
| Pipeline | Collector queues remain healthy and exports do not fail |
| Overhead | Application resource use stays inside your defined limit |
Set the acceptable difference from your own traffic and sampling model. There is no universal parity percentage for every service.
5. Cut over and keep rollback simple
Stop export to the old backend for the selected service. Keep the old agent package and deployment configuration available for a short rollback window.
After the new path stays healthy through normal load and one peak period:
- remove the old SDK import or startup flag;
- remove the old host agent, sidecar, or injection rule when no service needs it;
- remove old secrets and environment variables;
- remove obsolete dashboards and alerts only after replacements work;
- repeat the process with the next service.
What to Check Before the Final Cutover
The last service is not the last task. Use this final checklist:
- Every service sends telemetry through the intended path.
- Mixed-agent service boundaries no longer exist.
- Important custom spans use OpenTelemetry APIs or supported bridges.
- W3C context propagation works across HTTP, RPC, queues, and workers.
- Dashboards use the new resource and semantic convention names.
- Alerts trigger from controlled test conditions.
- Collector failure and queue metrics have alerts.
- The old backend no longer receives unexpected production data.
- Old agents, sidecars, startup flags, secrets, and billing resources are removed.
- The rollback procedure names an owner and a clear trigger.
Use Tracekit as the New OTLP Backend
Tracekit accepts OTLP traces and provides trace, service, metric, alert, anomaly, release, and session context for production debugging. Its current Node.js integration guide documents the /v1/traces endpoint and SDK initialization.
After the migration, use distributed tracing to inspect request paths and release-aware changes. Use dynamic logs when a trace shows where a failure occurs but not which runtime state caused it. Dynamic logs are bounded capture points. They do not replace your normal application log pipeline.
The safest OpenTelemetry migration is reversible and measurable. Keep the current path working, add one new path, prove trace continuity, and remove the old agent only when the evidence supports the cutover.
Related Posts
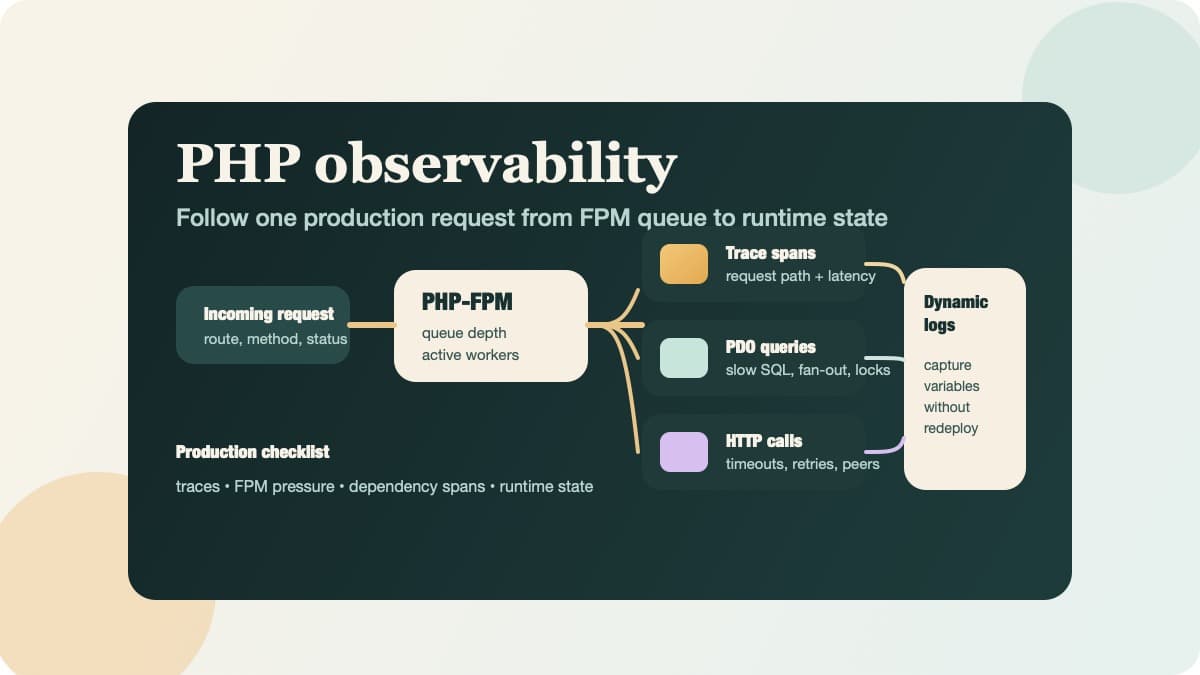
PHP Observability Checklist for Production Apps
Use this PHP observability checklist to trace requests, surface PDO and HTTP bottlenecks, and inspect runtime state without redeploying.
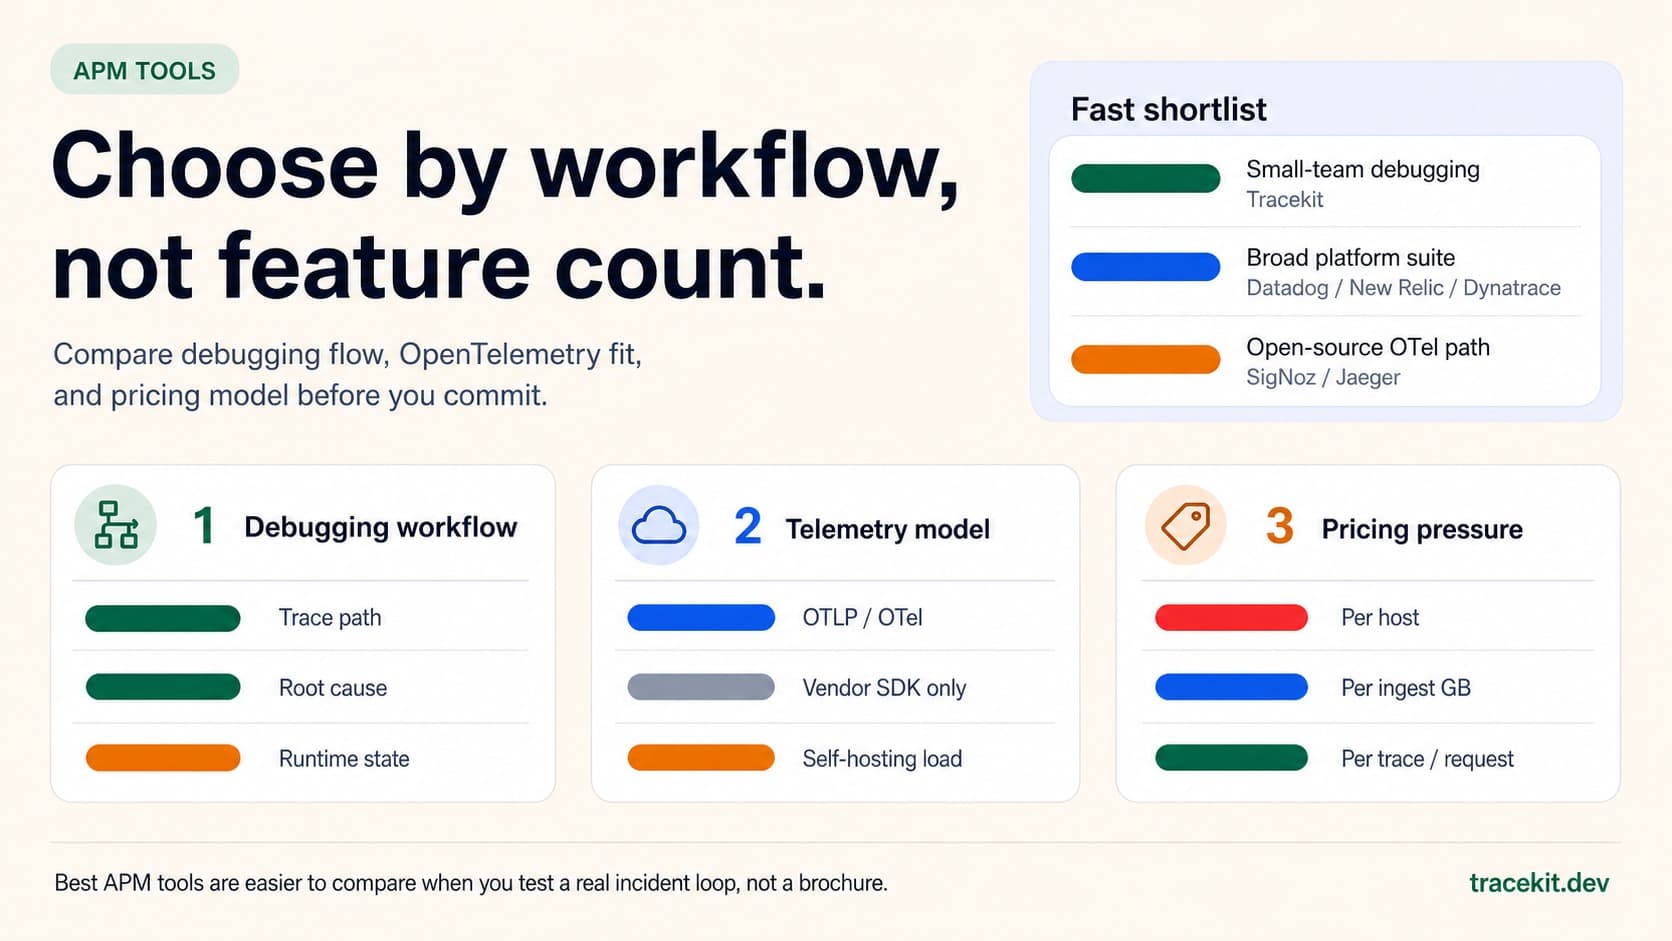
Best APM Tools for 2026: What to Compare Before You Commit
Compare the best APM tools for 2026 by debugging workflow, OpenTelemetry fit, pricing model, and runtime-state visibility.
Your API Just Threw a 500. Here's How to Actually Fix It.
Your API threw a 500 at 3 AM. A systematic approach to diagnose, trace, and fix production API errors without the panic and guesswork.