
How to Monitor LLM Call Latency in Production Workflows
Monitor LLM call latency in production workflows with traces, model percentiles, token usage, costs, errors, and workflow context.
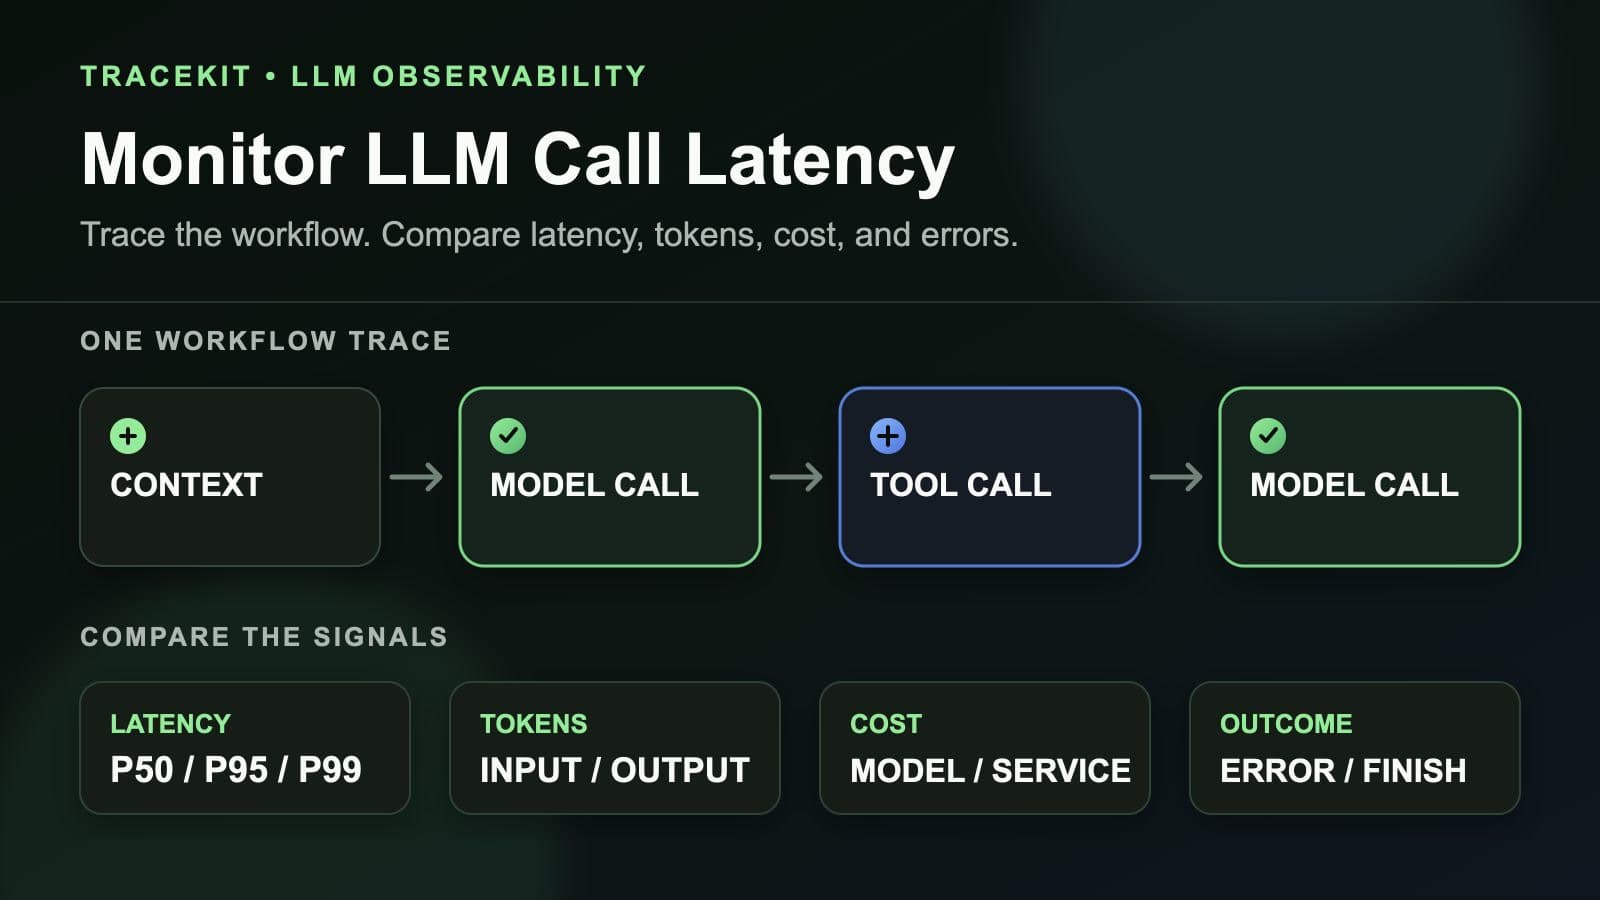
To monitor latency and performance of LLM calls within production workflows, trace the full workflow and each model call inside it. Then compare call latency, token usage, cost, errors, and model data in the same context.
A single average cannot tell you whether the model, a tool call, a retry, or normal application code caused the delay. You need a parent trace for the workflow and child spans for each important step. This guide shows which signals to collect, how to instrument a Node.js service, and how to investigate a latency regression with Tracekit.
Start with the workflow, not one API request
An LLM feature often contains more than one model request. A support workflow can load account data, call a model, run a search tool, call the model again, and write the result.
Measure these scopes separately:
| Scope | What to measure | Question it answers |
|---|---|---|
| Full workflow | End-to-end duration, errors, retries, and outcome | Did the user get a timely and useful result? |
| LLM call | Total call duration, model, provider, tokens, and finish reason | Which model call became slow or expensive? |
| Tool or dependency | Database, HTTP, queue, and tool-call duration | Did supporting work cause the delay? |
| Service and release | Latency percentiles, traffic, errors, and version | Did the regression start after a deploy? |
OpenTelemetry recommends standard GenAI attributes for model operations. Its current GenAI observability guide shows model, token, finish-reason, and workflow data inside traces. The GenAI semantic conventions provide the common naming layer.
This structure lets you compare providers and models without inventing a different schema for every client library.
Track the metrics that change your next action
Collect a small, complete set before you add more dashboards.
Total LLM call latency
Measure from the client call start until it completes. For streaming responses, this duration covers the stream until completion.
Total duration is not time to first token. Record time to first token separately when it affects the user experience. Do not label total stream duration as time to first token.
P50, P95, and P99 latency by model
The median describes a normal call. P95 and P99 expose slow calls that an average can hide.
Group percentiles by stable dimensions such as service, provider, model, environment, and workflow name. Do not add user IDs, request IDs, or prompt text as metric labels.
Input and output tokens
Token counts explain both cost and part of the latency change. A prompt that grows after a release can increase input tokens before users report slower responses.
Separate input and output tokens. One total hides whether retrieval context or generated output caused the increase.
Estimated cost
Calculate cost from the recorded model and token counts. Treat it as an estimate because model prices change and unknown model names need an updated price table.
Review cost per model, service, and workflow. A low-cost model can still create a large bill when a retry loop calls it many times.
Errors and finish reasons
Record client errors on the span. Also keep the model finish reason when the provider returns it.
An HTTP success does not always mean the workflow succeeded. A tool failure, timeout, empty result, or unexpected finish reason can still create a bad outcome.
Instrument LLM calls in Node.js with Tracekit
The current Tracekit Node.js SDK instruments detected OpenAI and Anthropic SDK calls. It records them as OpenTelemetry spans with model, provider, token, and finish-reason attributes.
Use the current Node.js LLM instrumentation guide as the source for supported options:
import { init } from '@tracekit/node-apm'

const client = init({
  apiKey: process.env.TRACEKIT_API_KEY!,
  serviceName: 'support-workflow',
  endpoint: 'https://app.tracekit.dev/v1/traces',
  instrumentLLM: {
    enabled: true,
    openai: true,
    anthropic: true,
    captureContent: false,
  },
})
Initialize Tracekit before the OpenAI or Anthropic client. Early initialization gives the SDK a chance to patch supported client calls.
The Node.js integration currently records attributes such as:
gen_ai.provider.namegen_ai.operation.namegen_ai.request.modelgen_ai.response.modelgen_ai.usage.input_tokensgen_ai.usage.output_tokensgen_ai.response.finish_reasons
Streaming OpenAI calls request usage data in the final chunk when the SDK can add that option. The span ends when the stream completes or closes.
The current integration measures full call duration. It does not expose a separate time-to-first-token field in the Tracekit LLM dashboard. Add explicit first-token timing when your product needs that signal.
Keep each LLM call inside its parent trace
Auto-instrumentation is most useful when the active trace context reaches the model client call.
A healthy trace can look like this:
POST /support/reply                         4.8 s
├─ load customer context                   120 ms
├─ chat gpt-4o                             1.9 s
├─ search knowledge base                   430 ms
├─ chat gpt-4o                             2.1 s
└─ save response                            90 ms
This trace shows two model calls and one tool step. A dashboard with only model averages cannot show which step blocked this specific workflow.
Tracekit distributed tracing keeps application and dependency spans in the same request path. The LLM call record also keeps its trace ID, so you can move from a slow model call to the full workflow.
Check context propagation when work crosses a queue, worker, scheduler, or process boundary. A detached LLM span can still show model latency, but it loses the workflow evidence you need during an incident.
Use the LLM dashboard to find the bad segment
Tracekit's LLM observability dashboard shows total cost, total calls, average latency, total tokens, and the top model. It also provides:
- cost over time;
- cost by model and service;
- input and output token usage over time;
- P50, P95, and P99 latency by model;
- recent calls with service, provider, model, tokens, cost, and latency;
- filters for time range, service, model, and provider.
Use one filter change at a time during an investigation. Start with the affected service. Then compare models and providers inside the same time window.
Do not stop after you find a slow model. Open representative calls and inspect their parent traces. The model can be healthy while a retry, tool, database query, or queue step creates the end-to-end delay.
Investigate a latency regression in six steps
Use this sequence when a workflow becomes slow:
- Mark the first bad time window and the affected workflow.
- Compare P50, P95, and P99 LLM latency with the previous healthy window.
- Split the view by model, provider, and service.
- Compare input tokens, output tokens, call count, errors, and estimated cost.
- Open slow calls and inspect the full parent trace.
- Compare the affected service release with the previous release.
These signals support different conclusions:
| Evidence | Likely next check |
|---|---|
| Latency rises with input tokens | Prompt growth, retrieval payload, or repeated context |
| Latency rises with output tokens | Output limit, stopping rules, or response length |
| Call count rises without traffic growth | Retry loop, agent loop, or duplicate execution |
| One model's tail latency rises | Model-specific behavior or provider conditions |
| Model spans stay normal | Tool calls, databases, queues, or application code |
| Regression starts after one release | Instrumentation, prompt, routing, or workflow code change |
Treat the table as a set of hypotheses. A trace and the relevant code path must confirm the cause.
Add alerts only after you have a baseline
Do not copy a universal LLM latency threshold. A short classification call and a multi-step research workflow need different budgets.
Build alert conditions from:
- the workflow's user-facing latency budget;
- its normal P95 or P99 call latency;
- minimum traffic or call volume;
- the error rate and retry rate;
- token and cost changes during the same window.
Page on user impact. Use a warning for a slow cost or token trend that still meets the user budget.
Tracekit supports alert rules and latency metrics. Keep LLM-specific alert wording tied to the data you actually collect. A total-call latency alert must not claim that time to first token regressed.
Protect prompt and completion content
Latency, model, token, and cost data usually does not require prompt content. Start with captureContent: false.
The Tracekit Node.js SDK keeps content capture off by default. When enabled, it records prompt and completion data on span attributes and scrubs common sensitive key names.
That scrubber cannot prove that all private data is safe. A secret can appear under an unexpected field name or inside normal text. Review prompts, retention, access, and data rules before enabling content capture.
Use bounded operational fields first. Model names, token counts, durations, finish reasons, trace IDs, and stable workflow names answer many performance questions without storing message content.
Production checklist
- Trace the full workflow and each LLM call.
- Keep LLM calls inside the active parent trace.
- Record provider, request model, response model, and finish reason.
- Separate input and output token counts.
- Track total call duration and label it correctly.
- Add time-to-first-token timing only when you measure it directly.
- Compare P50, P95, and P99 by model and service.
- Calculate estimated cost from maintained price data.
- Check retry and tool-call behavior during regressions.
- Build alerts from the workflow's own baseline.
- Keep prompt content capture off unless you approve its data risk.
- Connect a bad time window to traces and releases.
What to do next
Start with one production workflow. Confirm that its model calls appear inside the parent trace, then compare latency percentiles, tokens, cost, and call count for one week.
Use the LLM monitoring playbook for the wider cost and fallback plan. Use the Tracekit LLM observability page for the product workflow. If the slow span points outside the model call, follow the request through distributed tracing before changing the model.
Related Posts
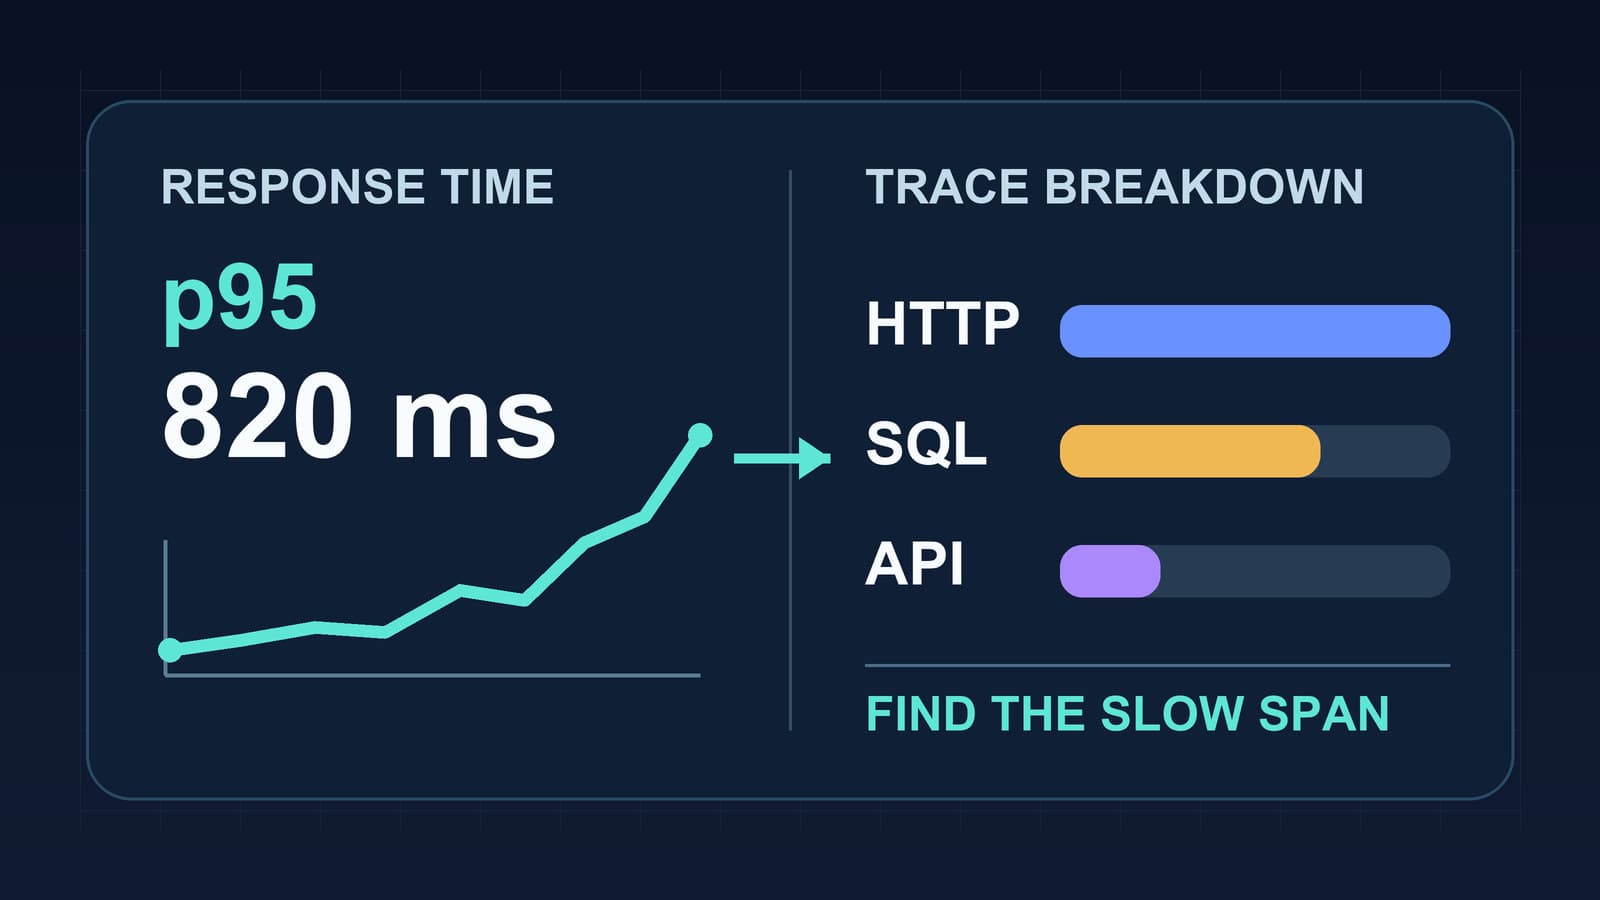
Node.js Response Time Monitoring by Route
Measure Node.js response time by route, read p95 latency with traces, and separate event loop delays from database and API waits.
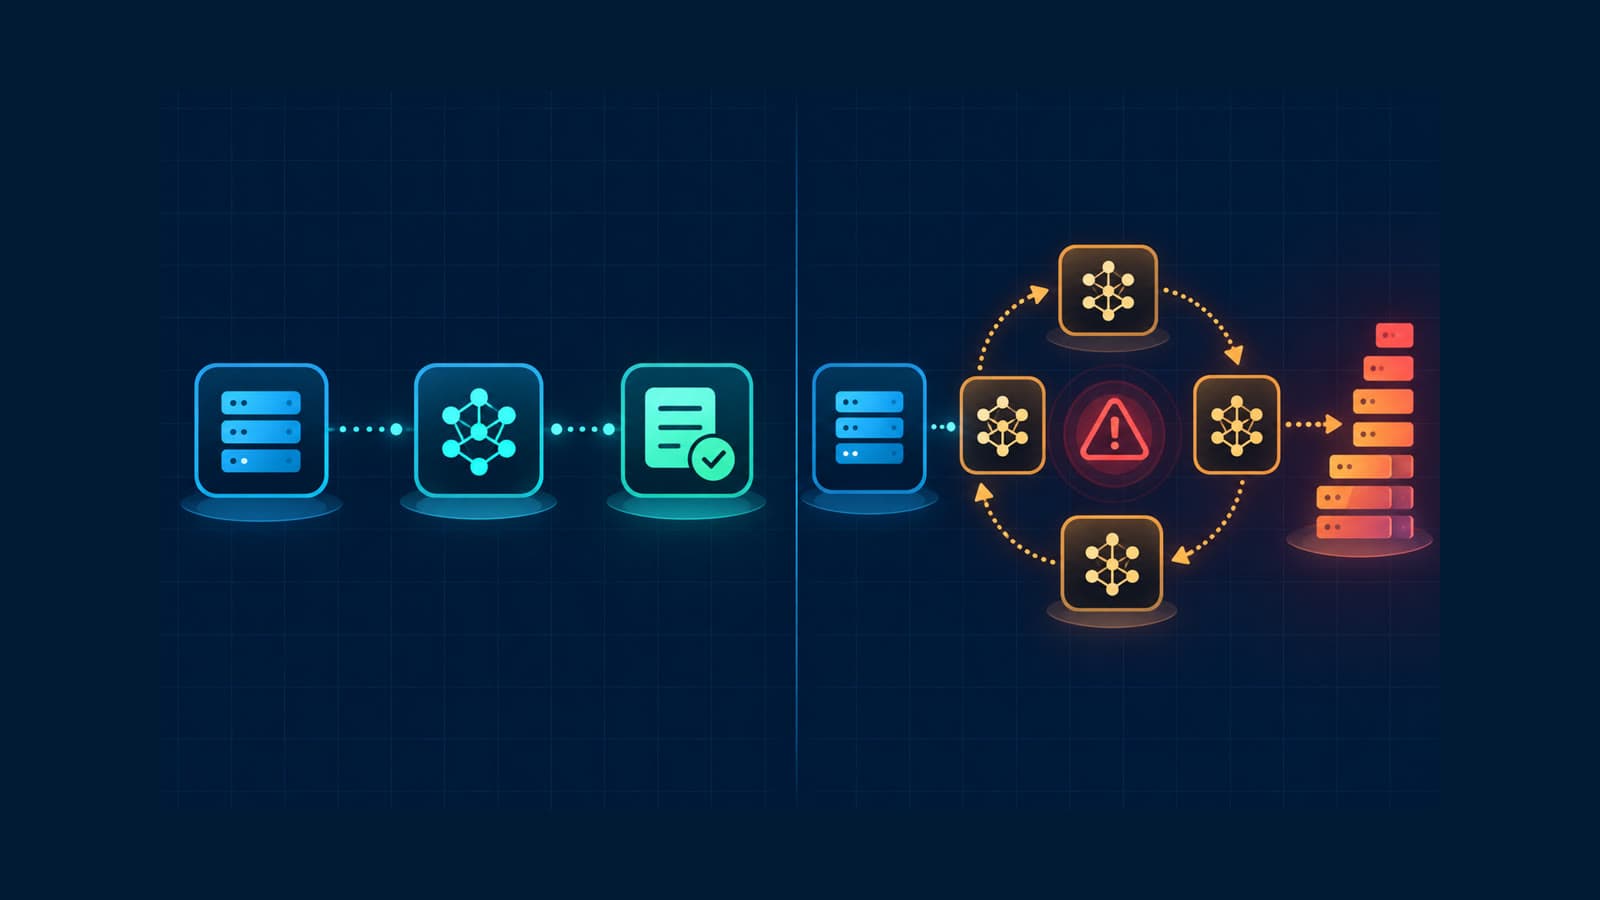
How to Track Rogue LLM Calls in Production
Track rogue LLM calls with traces, call counts, token usage, costs, models, and retry evidence before a loop becomes an incident.
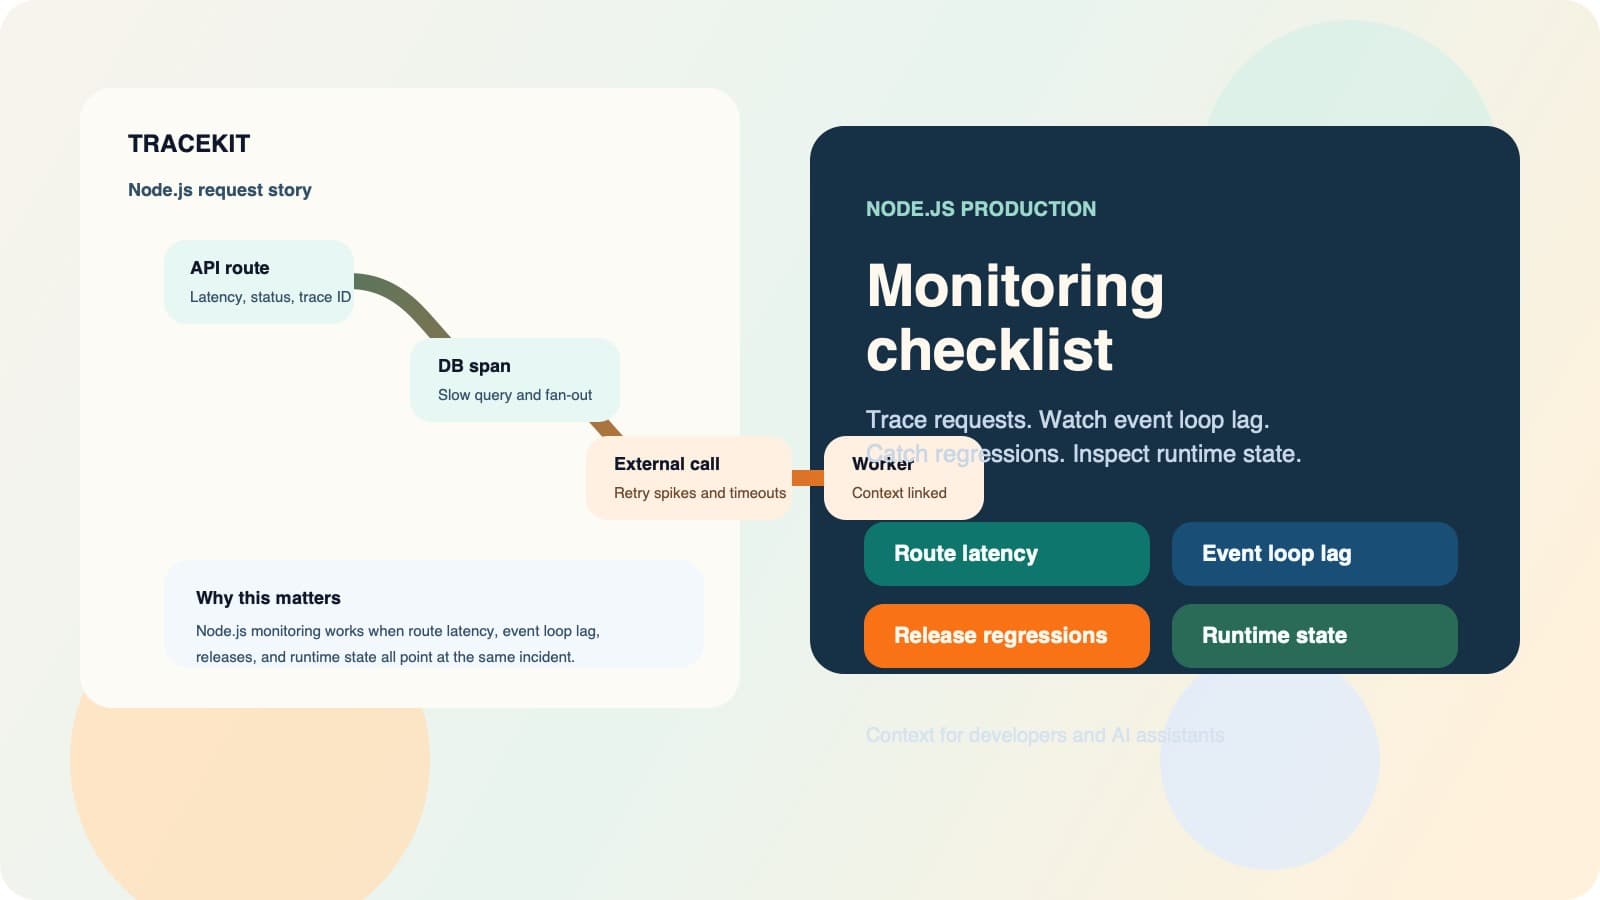
Node.js Application Performance Monitoring Guide
Use Node.js application performance monitoring to connect request traces, event loop health, dependencies, releases, and runtime state.