
Django Observability Checklist for Production
Build Django observability with traces, query visibility, alerts, and dynamic logs so you can debug production issues without guessing.
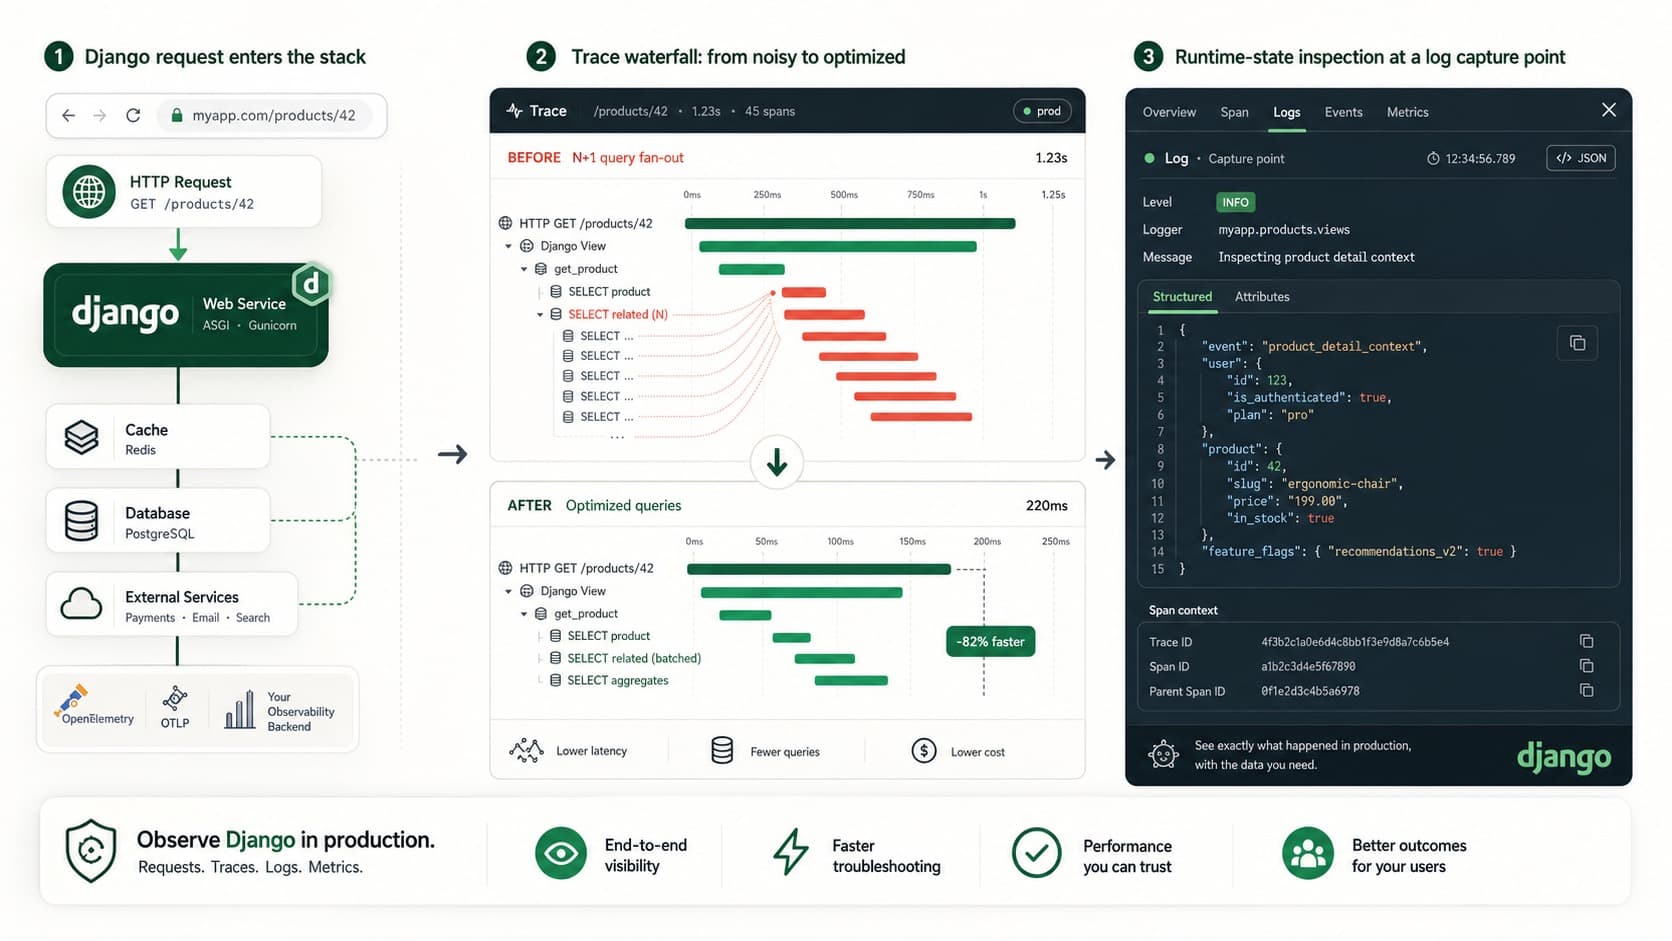
Django observability should help you answer four production questions quickly: which request or endpoint regressed, which query or downstream call consumed the latency budget, what changed in the release path, and what runtime state explains the bad outcome. If your current workflow stops at "the page is slow" or "the logs did not show the missing variable," your observability setup is incomplete.
This guide targets the search intent behind django observability: a practical production checklist for request traces, ORM visibility, dependency tracing, alerts, and runtime-state capture. It is grounded in Tracekit's current Python integration guide, dynamic logs docs, alert rules docs, the current Django middleware implementation in tracekit/python-apm, and the product-state reference for current positioning. For Django and OpenTelemetry behavior, it also lines up with the official docs for middleware, database optimization, database instrumentation, Python zero-code instrumentation, and context propagation.
Django Observability Checklist at a Glance
| Area | What to verify | Why it matters |
|---|---|---|
| Request traces | Every incoming request records route, method, status, duration, and trace context | You can isolate the failing request path before touching code |
| Query visibility | Expensive ORM paths, repeated lookups, and high-query routes are visible in traces or manual child spans | Slow requests usually become fixable only when query shape is visible |
| Dependencies | Outbound HTTP calls and other downstream work stay attached to the request trace when instrumented | Prevents "service A looked fine" debugging dead ends |
| Runtime state | Dynamic logs can capture request-specific variables on the suspicious code path | Explains why the branch decision was wrong, not just where time went |
| Alerts | Error rate, latency, and throughput thresholds reflect user impact | Lowers noise and shortens time to first useful investigation |
| Release hygiene | Release metadata and pre-release checks make regressions obvious | Helps you tie a new failure to what changed |
1. Trace Every Django Request First
Start with request-level tracing. Django observability is weak if you cannot answer which route, view, or path actually hurt users.
Tracekit's current Django middleware is a good baseline because it extracts W3C trace context from incoming headers and records request metadata such as route, full URL, user agent, client IP, status code, and duration. That gives you one reliable parent span per request before you add deeper instrumentation.
# apps.py
import os

import tracekit
from django.apps import AppConfig


class StoreConfig(AppConfig):
    name = "store"

    def ready(self):
        tracekit.init(
            api_key=os.environ["TRACEKIT_API_KEY"],
            service_name="store-web",
            enable_code_monitoring=True,
        )
# settings.py
MIDDLEWARE = [
    "tracekit.middleware.django.TracekitDjangoMiddleware",
    "django.middleware.security.SecurityMiddleware",
    "django.contrib.sessions.middleware.SessionMiddleware",
    "django.middleware.common.CommonMiddleware",
    "django.middleware.csrf.CsrfViewMiddleware",
    "django.contrib.auth.middleware.AuthenticationMiddleware",
]
The official Django middleware docs are worth revisiting here because middleware is the request/response hook where global tracing belongs. Put the tracing middleware in place before you worry about dashboards or custom spans. Without the request span, the rest of the evidence has no stable parent story.
2. Make ORM Blind Spots Visible
Django observability often fails at the ORM layer. A request looks normal until one serializer, template, or loop quietly turns into dozens of queries.
The official Django database optimization docs push the same habits that help in production traces:
- use
select_related()for single-valued relations - use
prefetch_related()for multi-valued relations - profile query-heavy paths instead of guessing
- watch for lazy evaluation inside templates, serializers, and loops
If you already have database instrumentation for your driver or ORM stack, those queries should appear as child spans under the request. If you do not, add manual child spans around the hot path first so you can see which query block dominates the request.
from opentelemetry import trace


def order_list(request):
    tracer = trace.get_tracer(__name__)

    with tracer.start_as_current_span("orders.list.query") as span:
        span.set_attributes({
            "db.system": "postgresql",
            "db.operation": "SELECT",
            "view.name": "orders.list",
        })

        orders = list(
            Order.objects.select_related("customer")
            .prefetch_related("line_items")
            .order_by("-created_at")[:50]
        )

        span.set_attributes({
            "orders.count": len(orders),
        })

    return render(request, "orders/list.html", {"orders": orders})
This is the practical standard:
- If query spans already exist, inspect the repeated pattern in the trace.
- If query spans do not exist yet, create a narrow child span around the suspect ORM block.
- If the route still looks noisy, use the N+1 query guide to confirm whether the real problem is query fan-out instead of one slow statement.
The goal is not "log more SQL." The goal is to make the slow or repeated query path visible enough that the Django fix becomes obvious.
3. Keep Dependency Traces Attached to the Request Story
A Django request rarely stops at the view. Real work usually includes outbound HTTP calls, cache reads, search requests, payments, or background handoffs.
Tracekit's current Python SDK auto-instruments common outbound HTTP libraries such as requests, urllib, and urllib3. That makes it realistic to see whether the latency came from your Django code or a downstream dependency instead of treating every slow route as an ORM problem.
Be stricter about async and worker boundaries:
- If a request publishes work to Celery or another queue, treat trace propagation as explicit instrumentation work.
- If a management command or worker runs outside the request lifecycle, do not assume it will inherit request context automatically.
- If you use OpenTelemetry instrumentation libraries, keep propagation enabled across the libraries that own those boundaries.
The reason this matters is simple: many Django incidents are not slow views. They are slow dependencies attached to fast-looking views.
4. Use Dynamic Logs for Runtime State, Not Permanent Log Inflation
Tracing tells you where time was spent. It does not always tell you why a request took the wrong branch, why one tenant triggered an edge case, or why a payload failed validation only in production.
This is the gap Tracekit dynamic logs are designed to fill. They are bounded capture points for runtime state, not generic log ingestion.
import json

import tracekit


def checkout(request):
    cart = json.loads(request.body or "{}")
    user_id = request.user.id

    client = tracekit.get_client()

    if client.get_snapshot_client():
        client.capture_snapshot("checkout-validation", {
            "user_id": user_id,
            "cart_items": len(cart.get("items", [])),
            "coupon_code": cart.get("coupon_code"),
            "shipping_region": cart.get("shipping_region"),
        })

    return process_checkout(request, cart)
Good Django observability use cases for dynamic logs include:
- tenant-specific bugs
- serializer or form validation edge cases
- template context mismatches
- feature-flag branches
- requests that only fail after a recent deploy
Keep the framing disciplined: normal application logs still belong in your logger. Dynamic logs are for the request-specific runtime state you did not know you would need until the trace exposed the suspicious path.
For a broader Django debugging workflow, pair this post with Debug Django Apps in Production Without Redeploying.
5. Alert on User Impact, Not Just Symptoms
Django observability should wake someone up when users are affected, not every time one pod twitches.
Tracekit's current alert rules support error rate, latency, throughput, and health-score alerts. For most Django services, the first useful set is:
- error rate alerts on the user-facing service
- P95 latency alerts on critical endpoints
- throughput alerts for unexpected drops to near-zero traffic
- route- or service-level review after every meaningful release
Start with questions the responder can act on:
- Did one route's error rate spike?
- Did P95 latency regress after a deploy?
- Did traffic disappear from a service that should be receiving requests?
If the alert only says "the app is slow," you still have an observability gap.
6. Recheck the Stack Before Each Release
Django services drift. A serializer grows, a template accesses one more relation, a new webhook path ships, or a feature flag adds a conditional branch. The tracing setup that worked last month can quietly become incomplete.
Use this release checklist:
- Important routes still produce request traces.
- Hot ORM paths are visible through automatic instrumentation or manual child spans.
- Outbound HTTP calls still appear under the right request trace.
- Dynamic logs are available for the highest-risk business paths.
- Error rate and latency alerts still match current user-impact thresholds.
- Release metadata is attached where your deployment flow supports it.
If you cannot check those boxes confidently, fix the gap before the deploy rather than during the incident.
Where Tracekit Fits in a Django Observability Stack
| Need | Recommended starting point |
|---|---|
| Request tracing baseline | Python integration guide |
| Django framework landing page | Django observability page |
| Runtime state without redeploying | Dynamic logs docs |
| Route and service alerting | Alert rules docs |
| OTel bootstrap help | OTel config generator |
| Query fan-out debugging | N+1 query guide |
The win is not "more telemetry." The win is being able to answer a production question with evidence: which request regressed, which query or dependency consumed the time, and what runtime state explains the behavior. That is what Django observability should buy you.
Related Posts
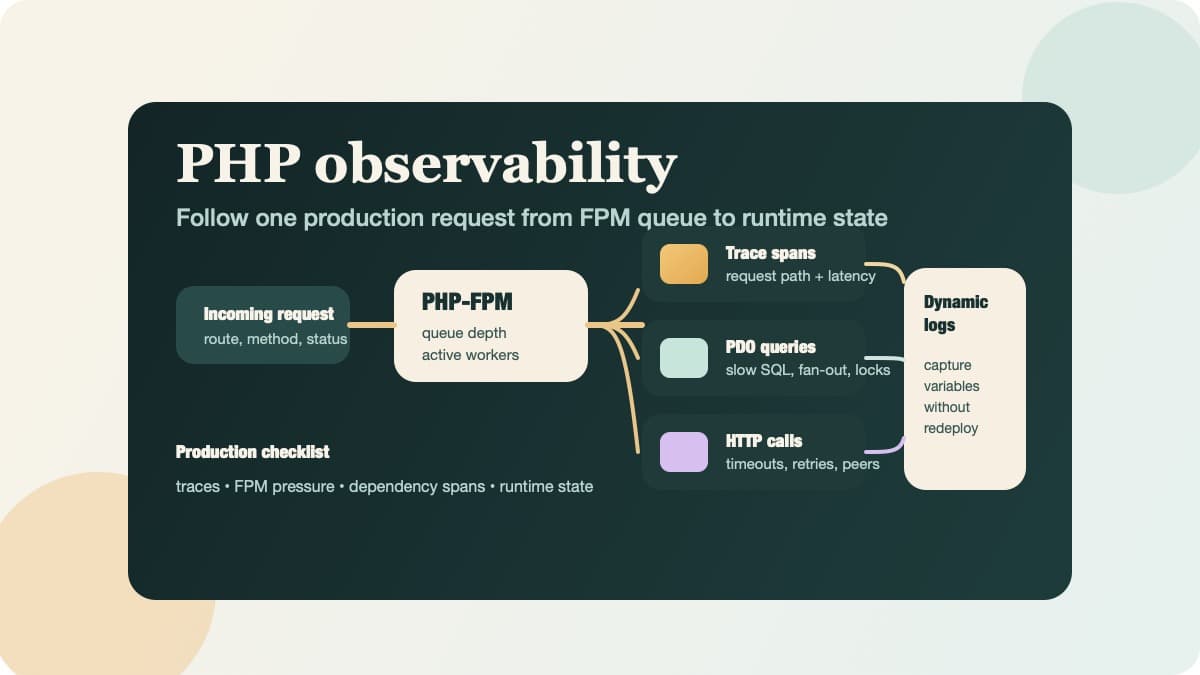
PHP Observability Checklist for Production Apps
Use this PHP observability checklist to trace requests, surface PDO and HTTP bottlenecks, and inspect runtime state without redeploying.
FastAPI Background Tasks: Production Checklist
Use this FastAPI background tasks production checklist to catch silent failures, blocked workers, lost trace context, and release regressions.

Debug Django Apps in Production Without Redeploying
Debug Django apps in production without DEBUG=True or redeploying. Use dynamic logs, flame graphs, and distributed tracing to fix issues in real time.