
6 min
How to Correlate Logs with Traces When Debugging
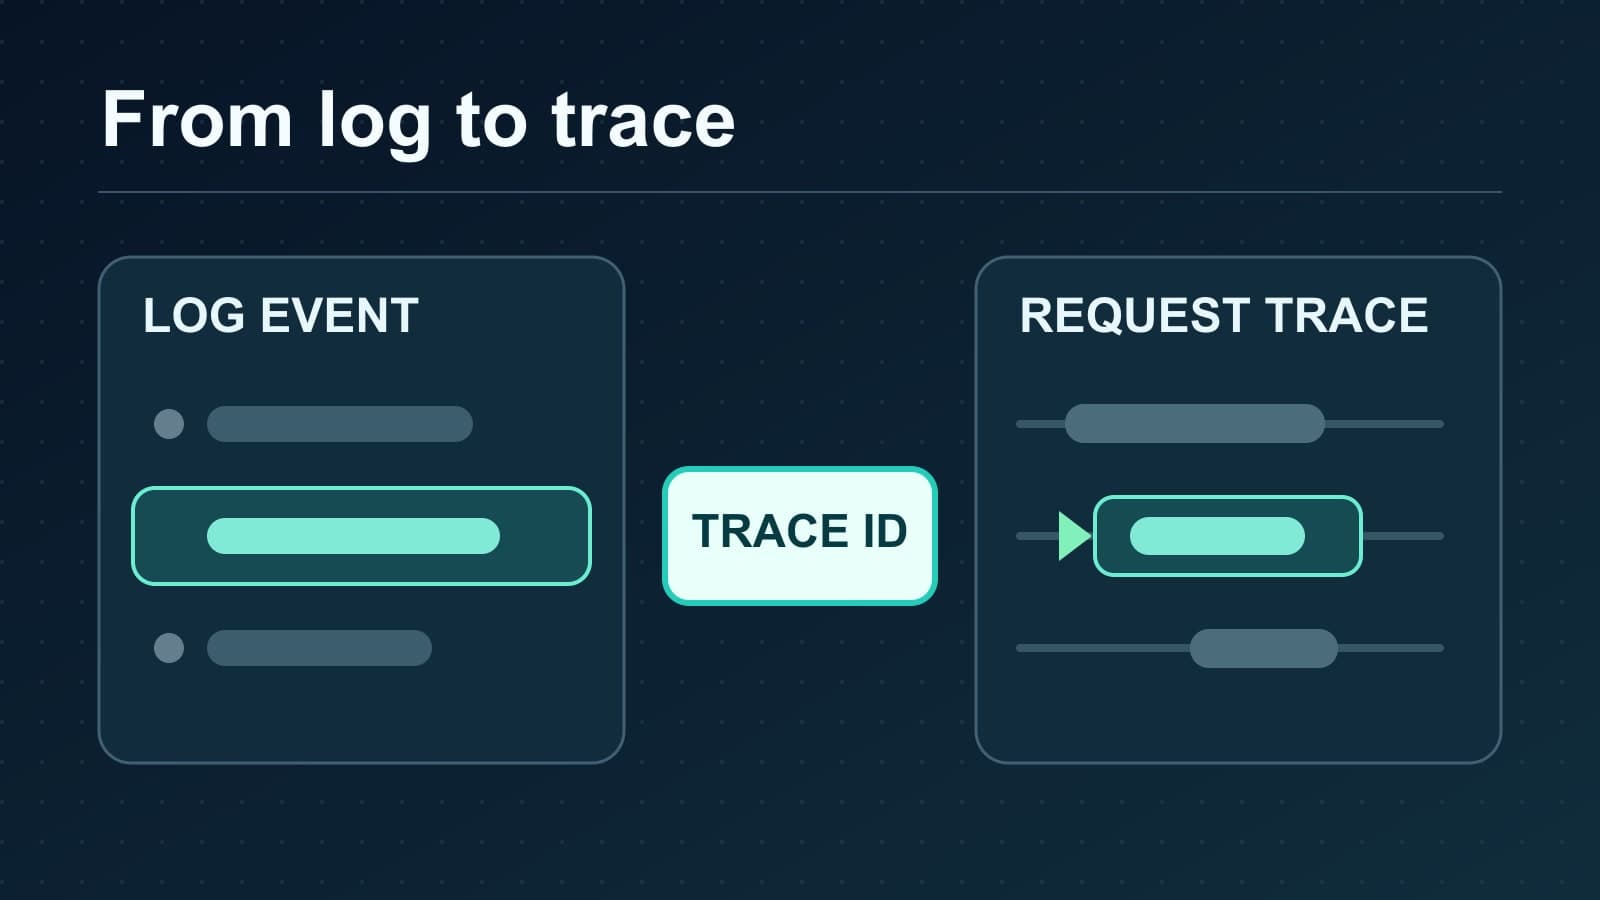
Correlate logs with traces using trace IDs, span IDs, and a request test. Find missing context across services without relying on timestamps alone.
distributed-tracingopentelemetry
Engineering insights on observability, distributed tracing, and production debugging.
Correlate logs with traces using trace IDs, span IDs, and a request test. Find missing context across services without relying on timestamps alone.
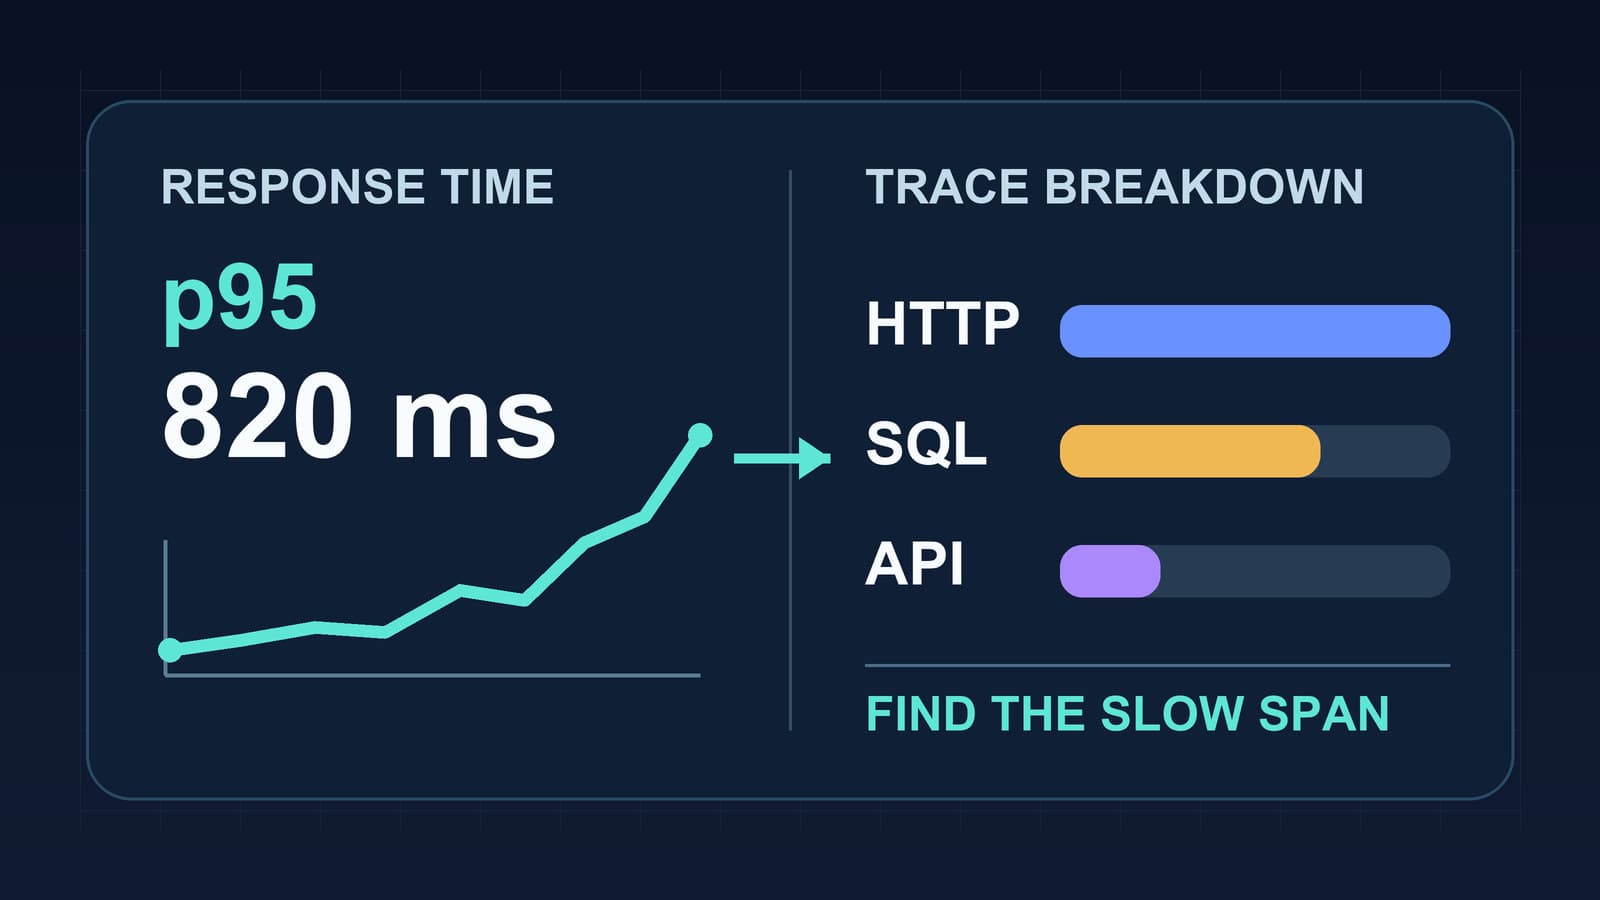
Measure Node.js response time by route, read p95 latency with traces, and separate event loop delays from database and API waits.
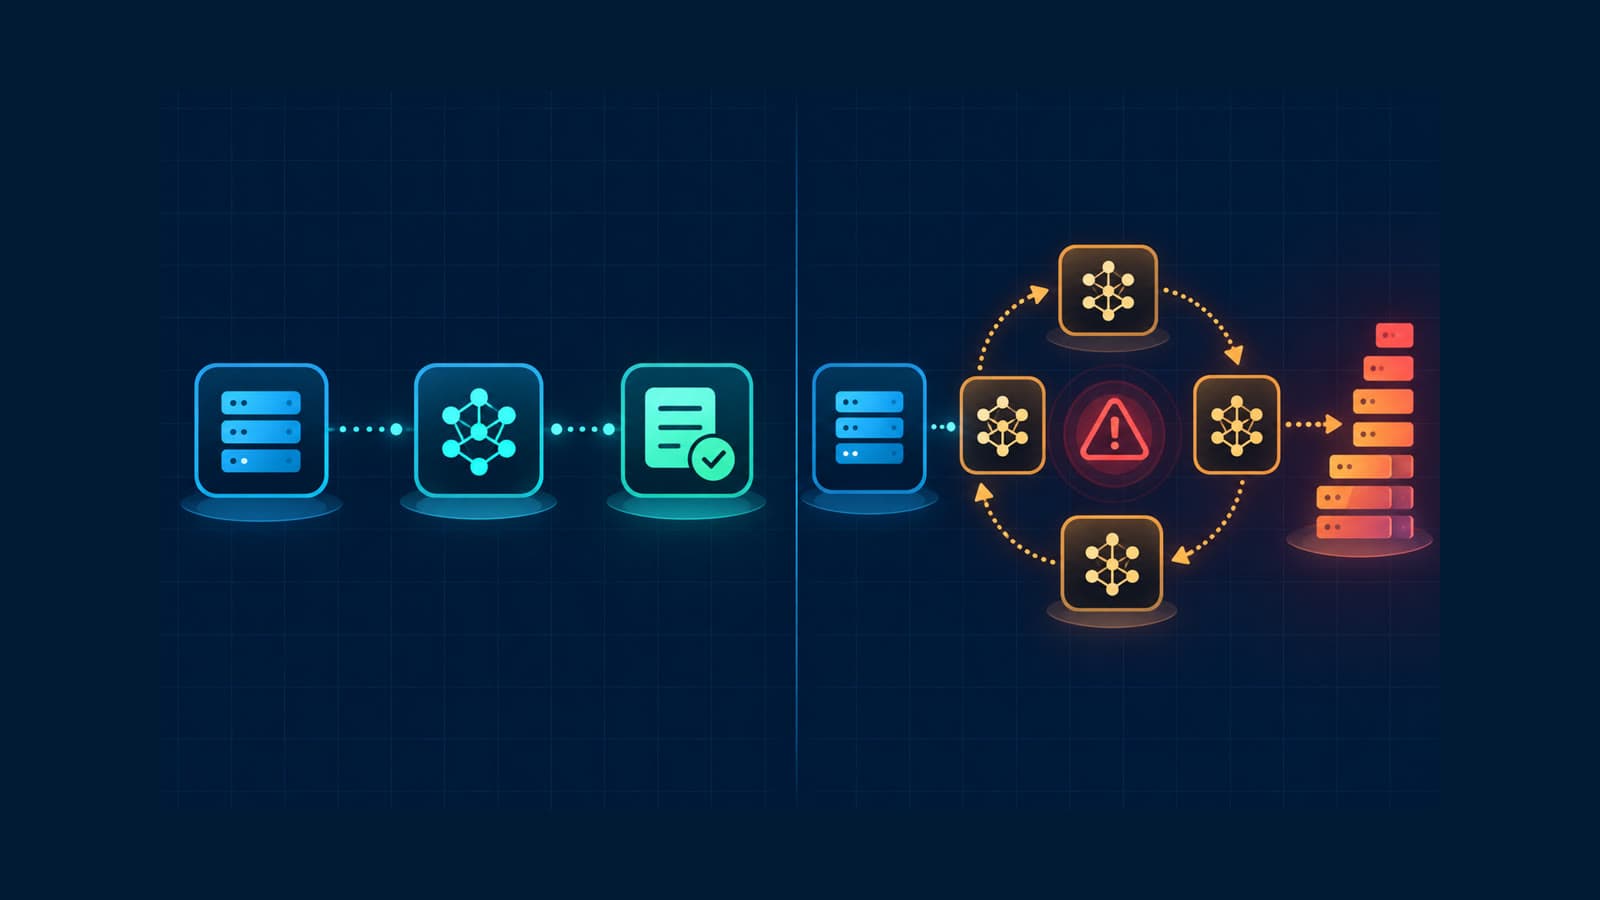
Track rogue LLM calls with traces, call counts, token usage, costs, models, and retry evidence before a loop becomes an incident.
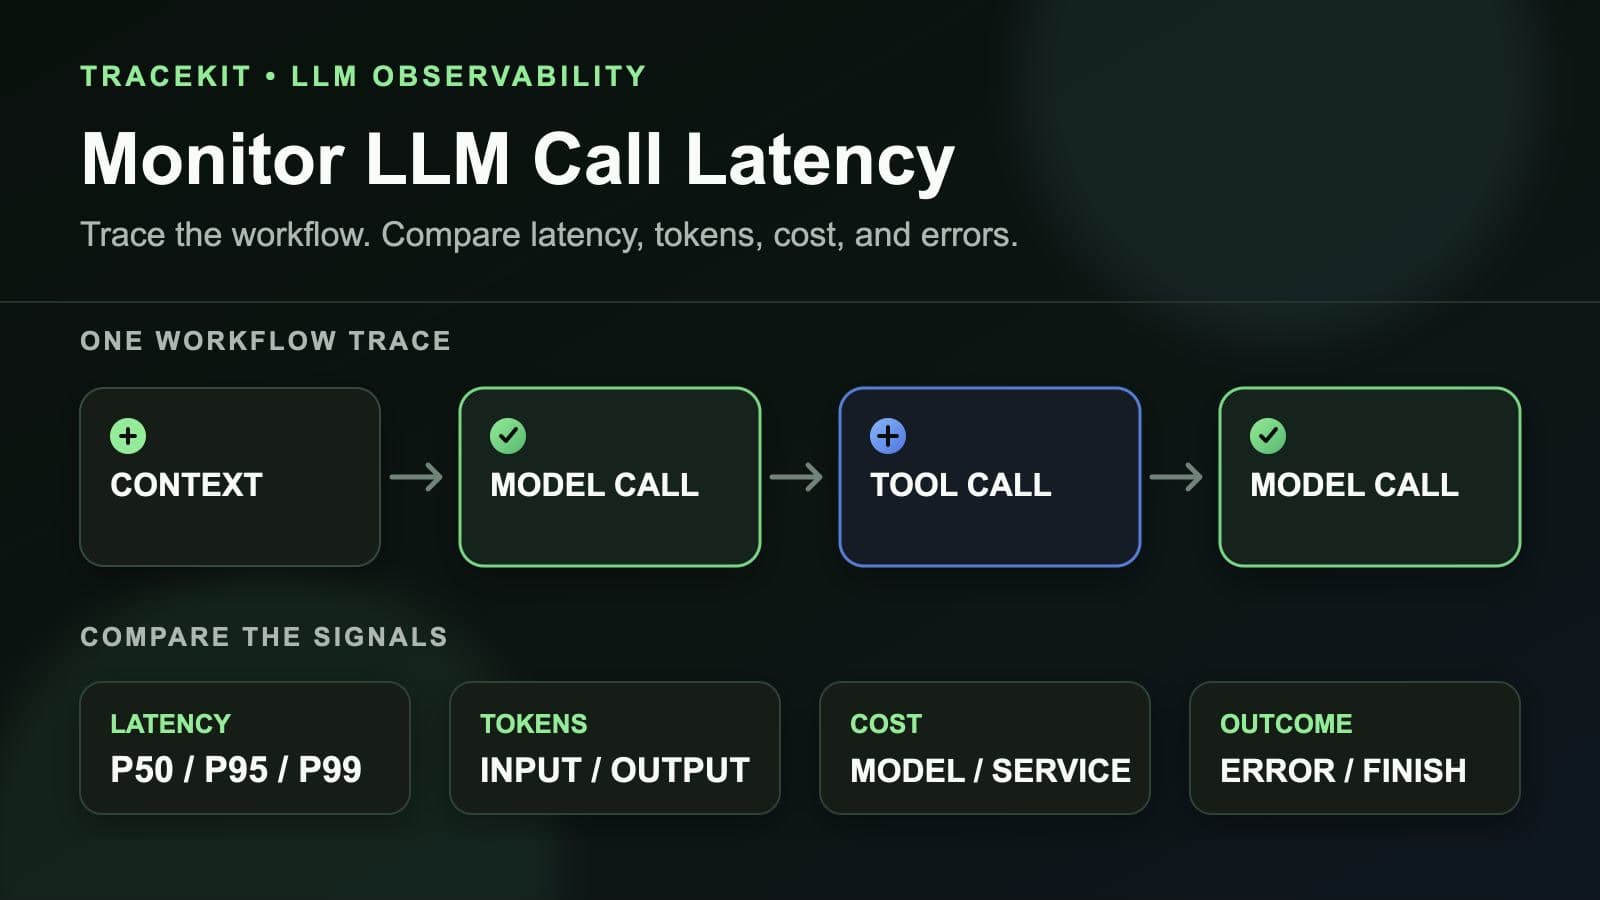
Monitor LLM call latency in production workflows with traces, model percentiles, token usage, costs, errors, and workflow context.
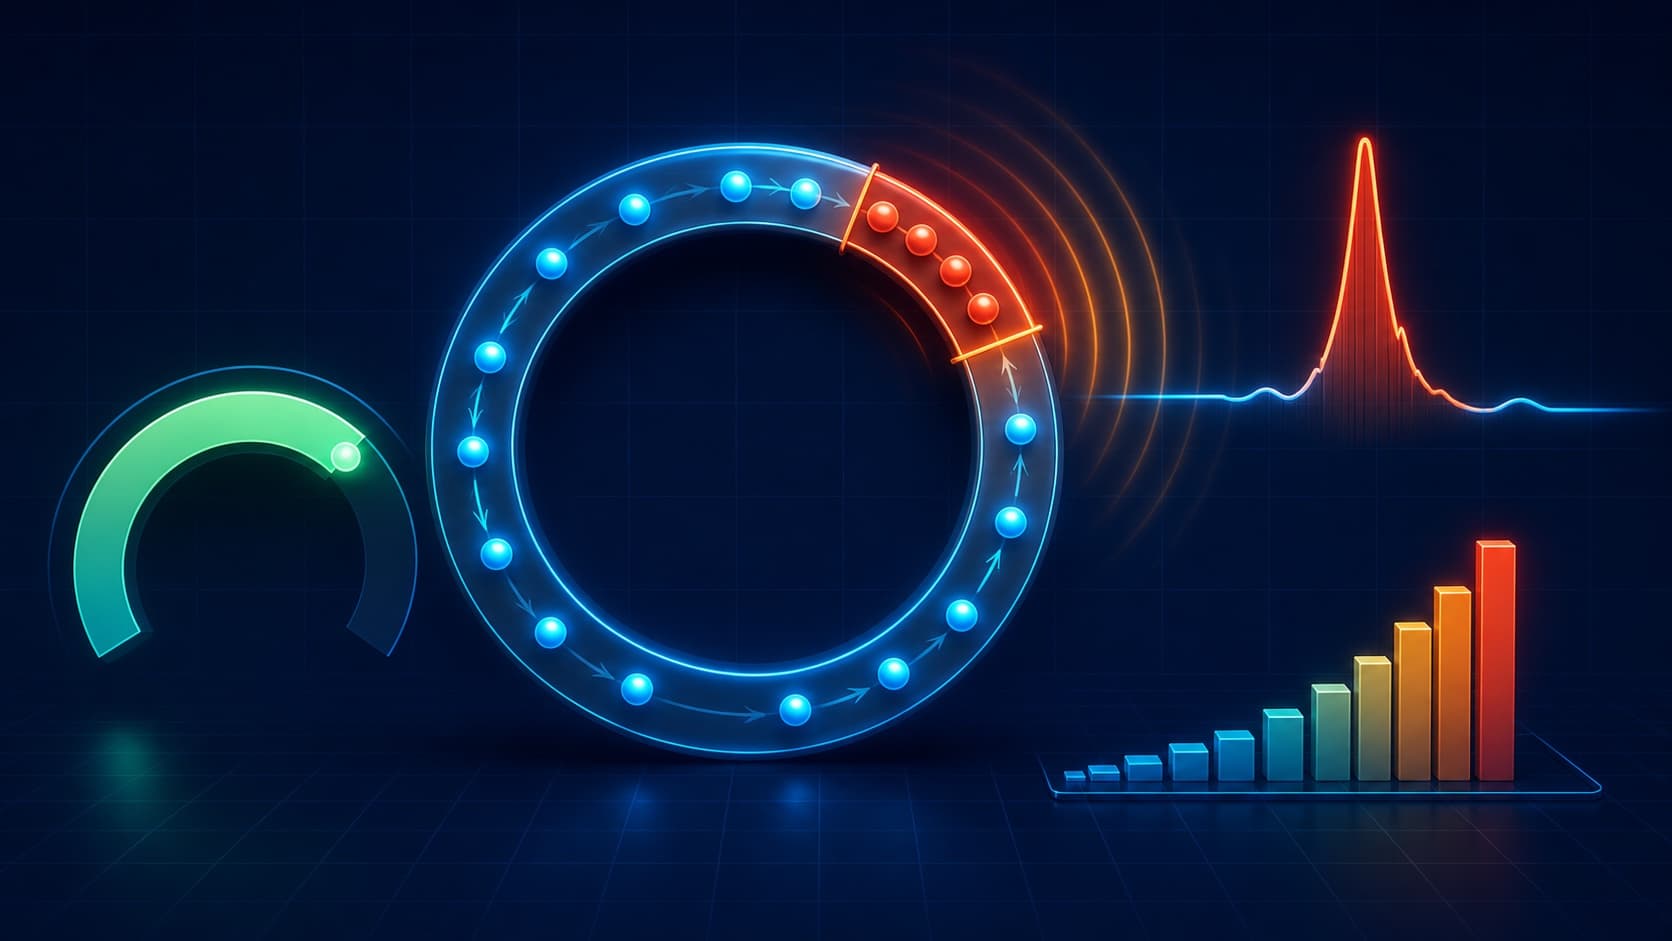
Use Node.js monitorEventLoopDelay and eventLoopUtilization to measure event-loop lag, export useful metrics, and debug blocking production code.
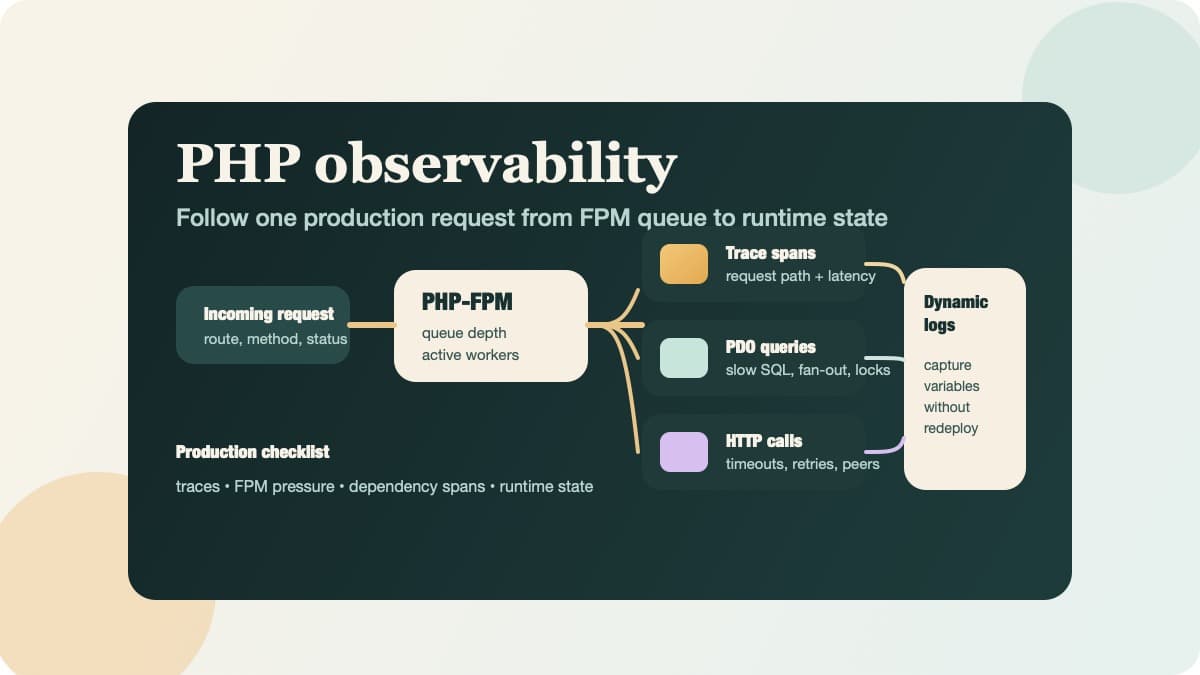
Use this PHP observability checklist to trace requests, surface PDO and HTTP bottlenecks, and inspect runtime state without redeploying.
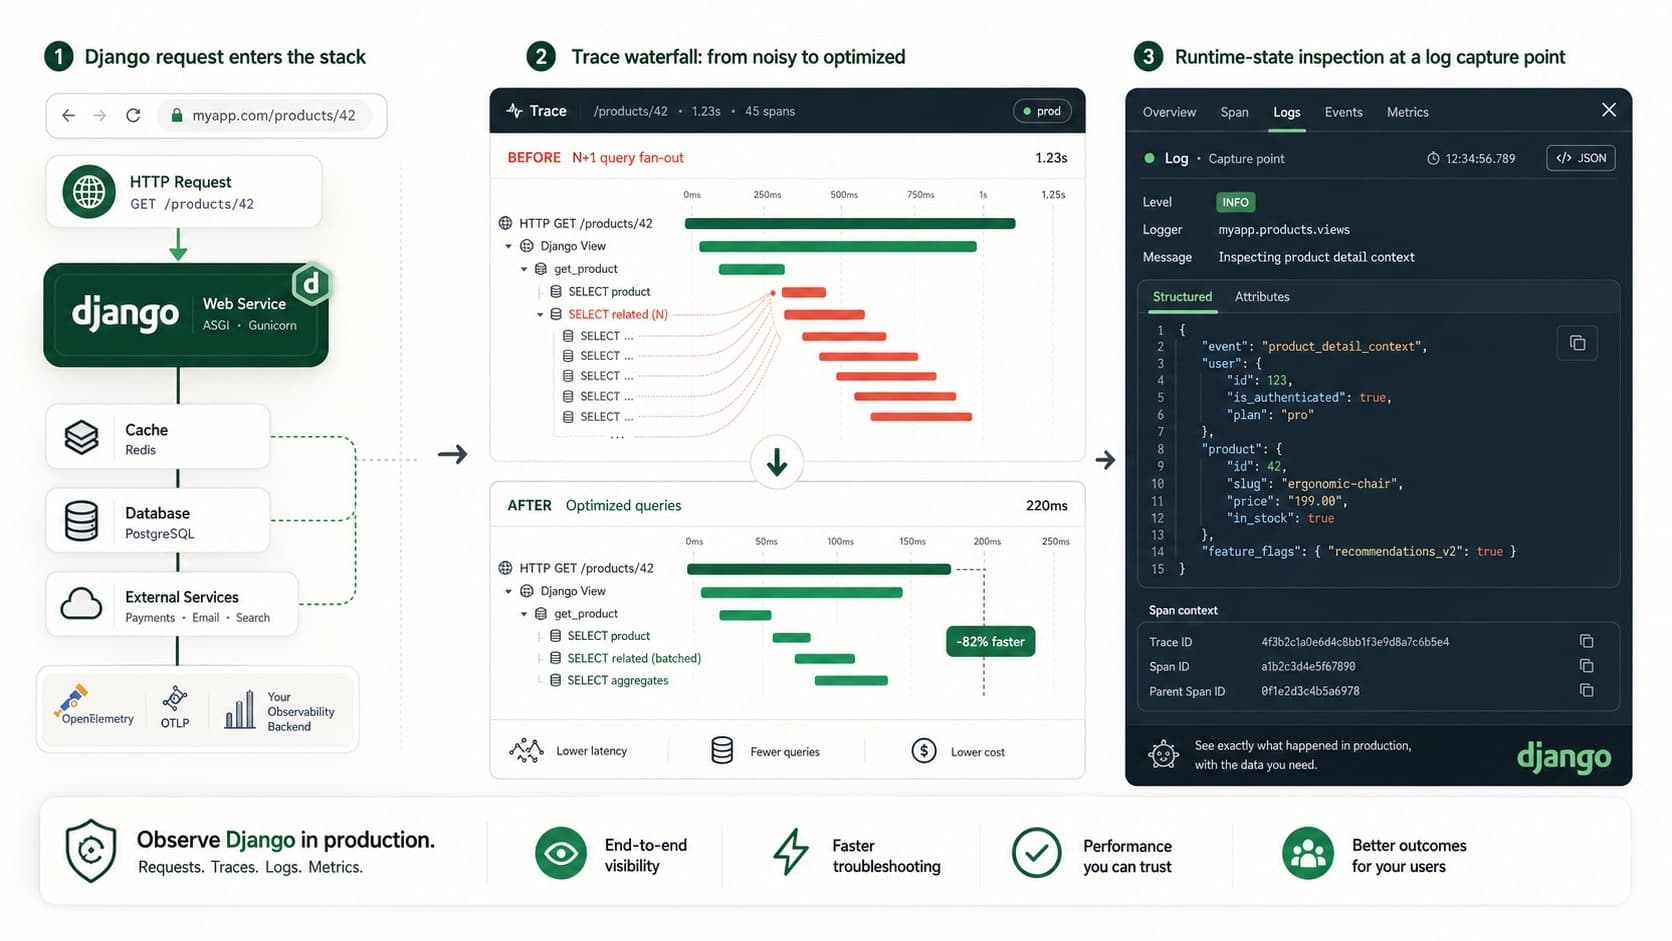
Build Django observability with traces, query visibility, alerts, and dynamic logs so you can debug production issues without guessing.
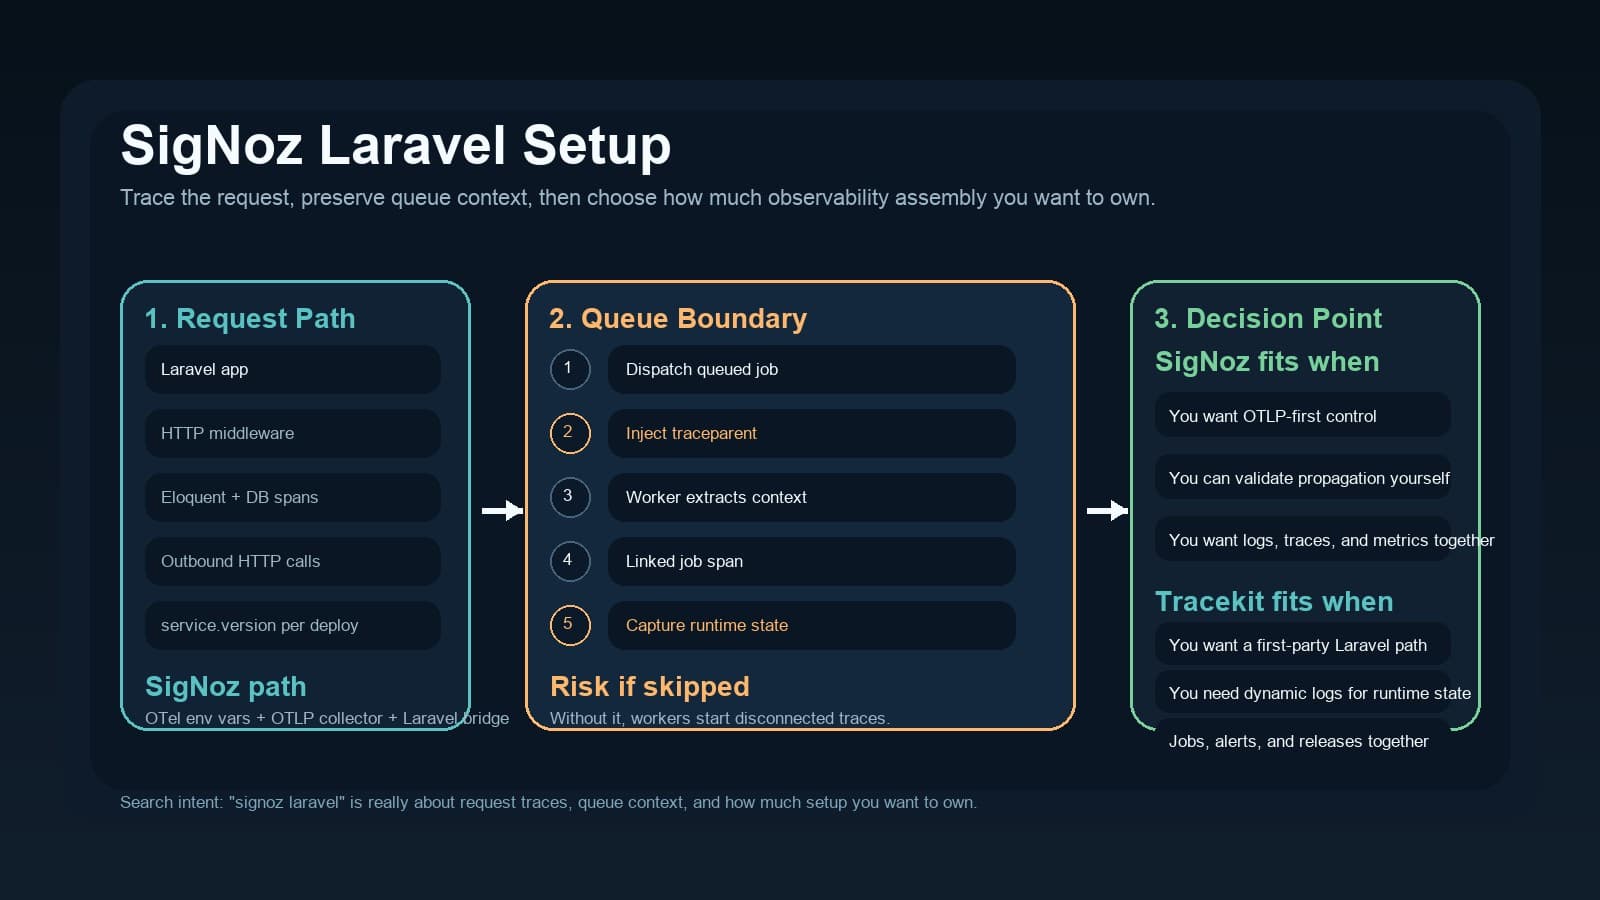
Use this SigNoz Laravel guide to wire OpenTelemetry, keep queue context intact, and compare that setup with a managed Laravel APM path.
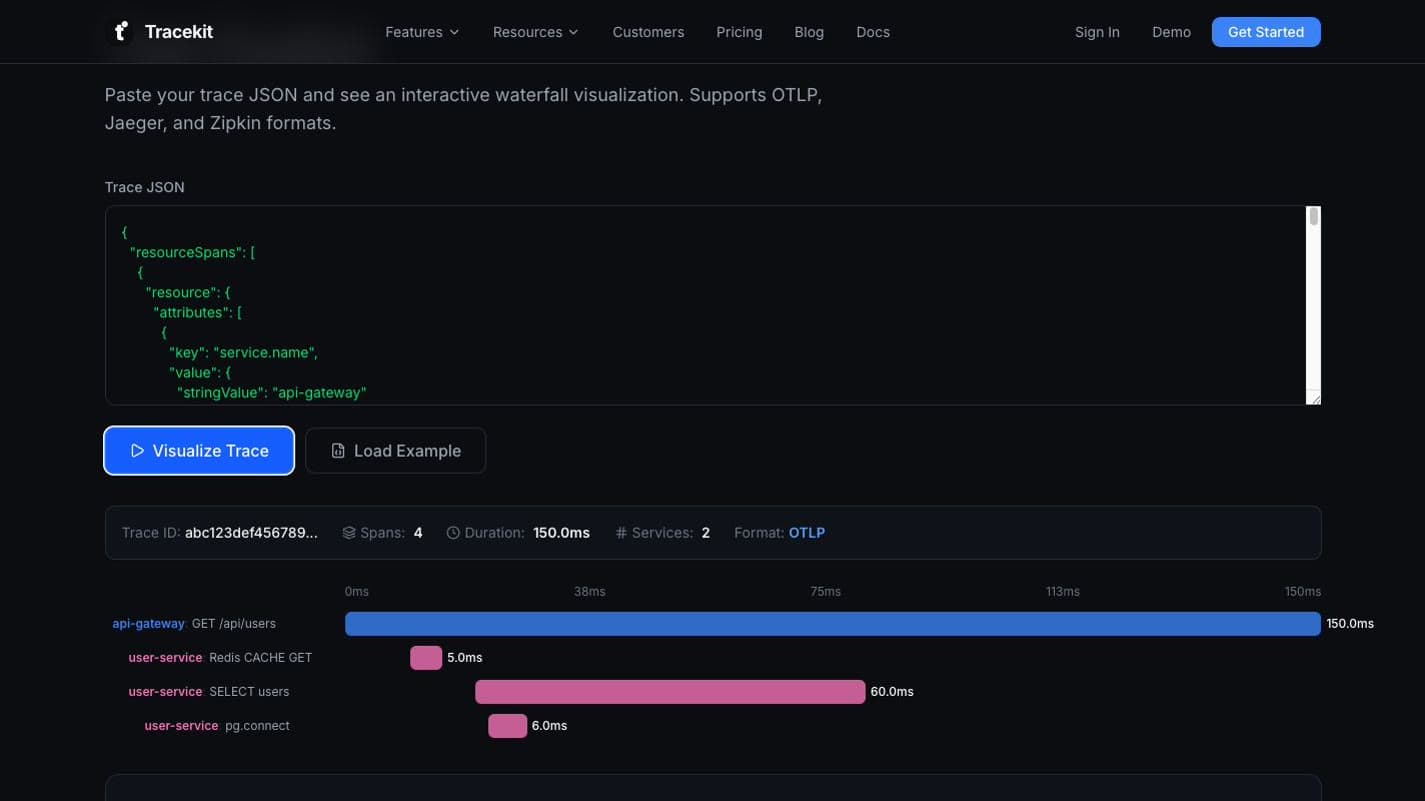
Visualize OpenTelemetry traces online, read the waterfall, fix export errors, and choose the right OTel trace viewer for each debugging job.
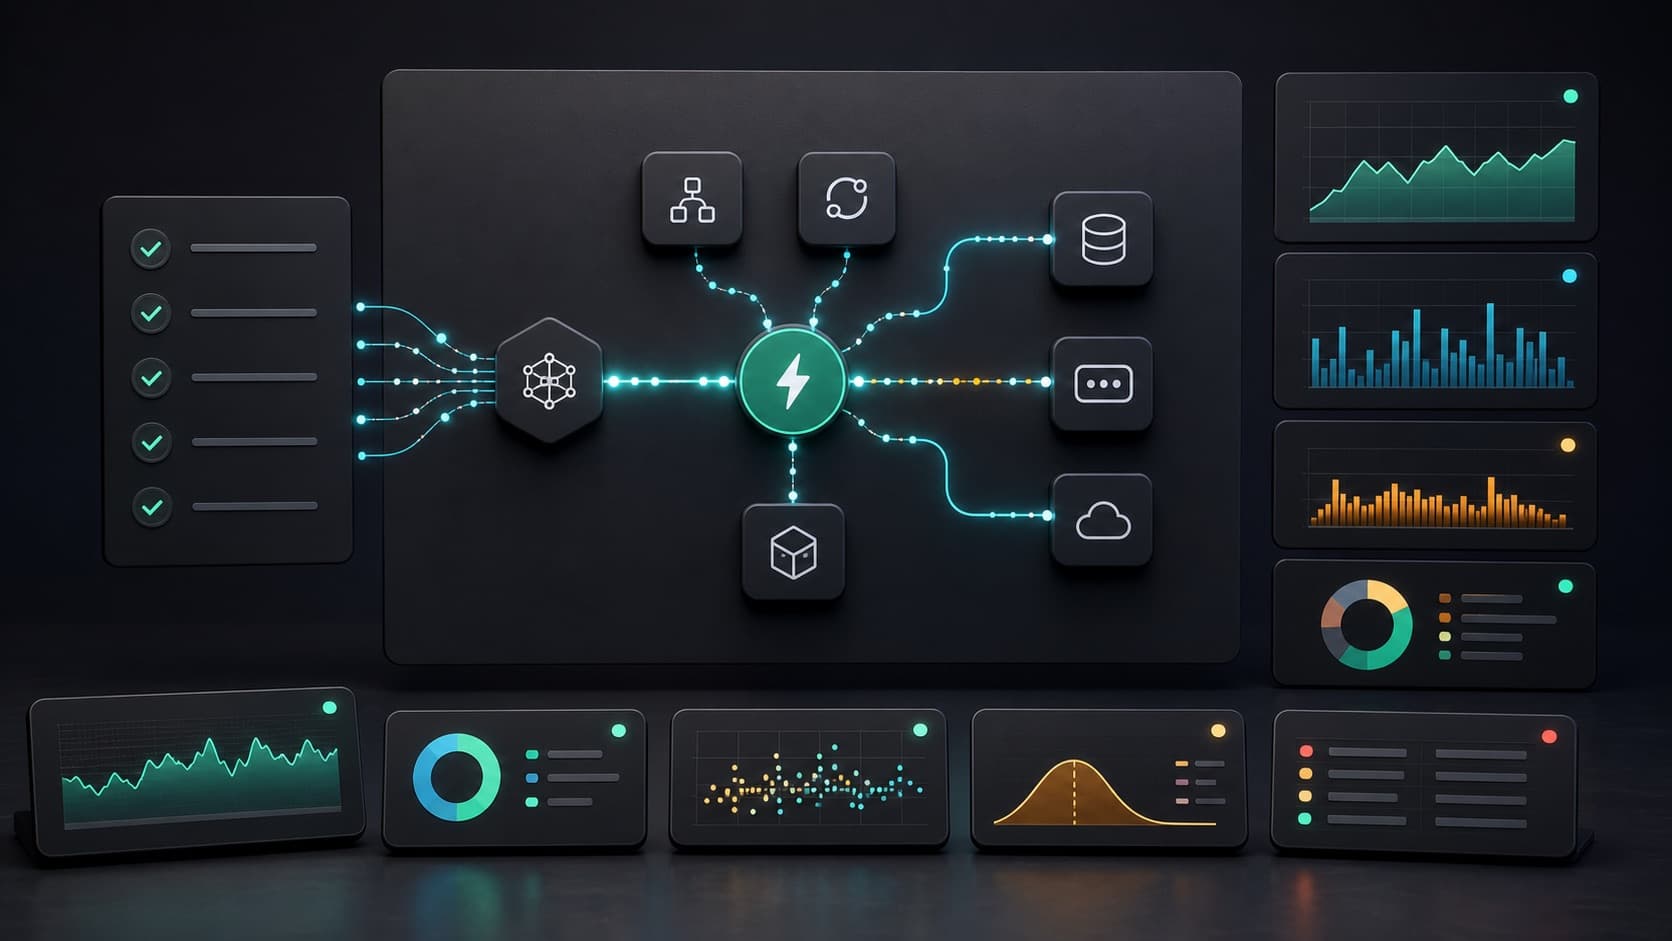
Use this production observability checklist for FastAPI applications to verify request metrics, traces, errors, background tasks, alerts, and releases.

Debug Laravel in production beyond dd() and Log::info(). Use Telescope, dynamic logs, distributed tracing, and performance profiling.

Step-by-step guide to debugging production without redeploying. Set up dynamic logs for PHP, Node.js, Go, and Python in minutes.