
6 min read
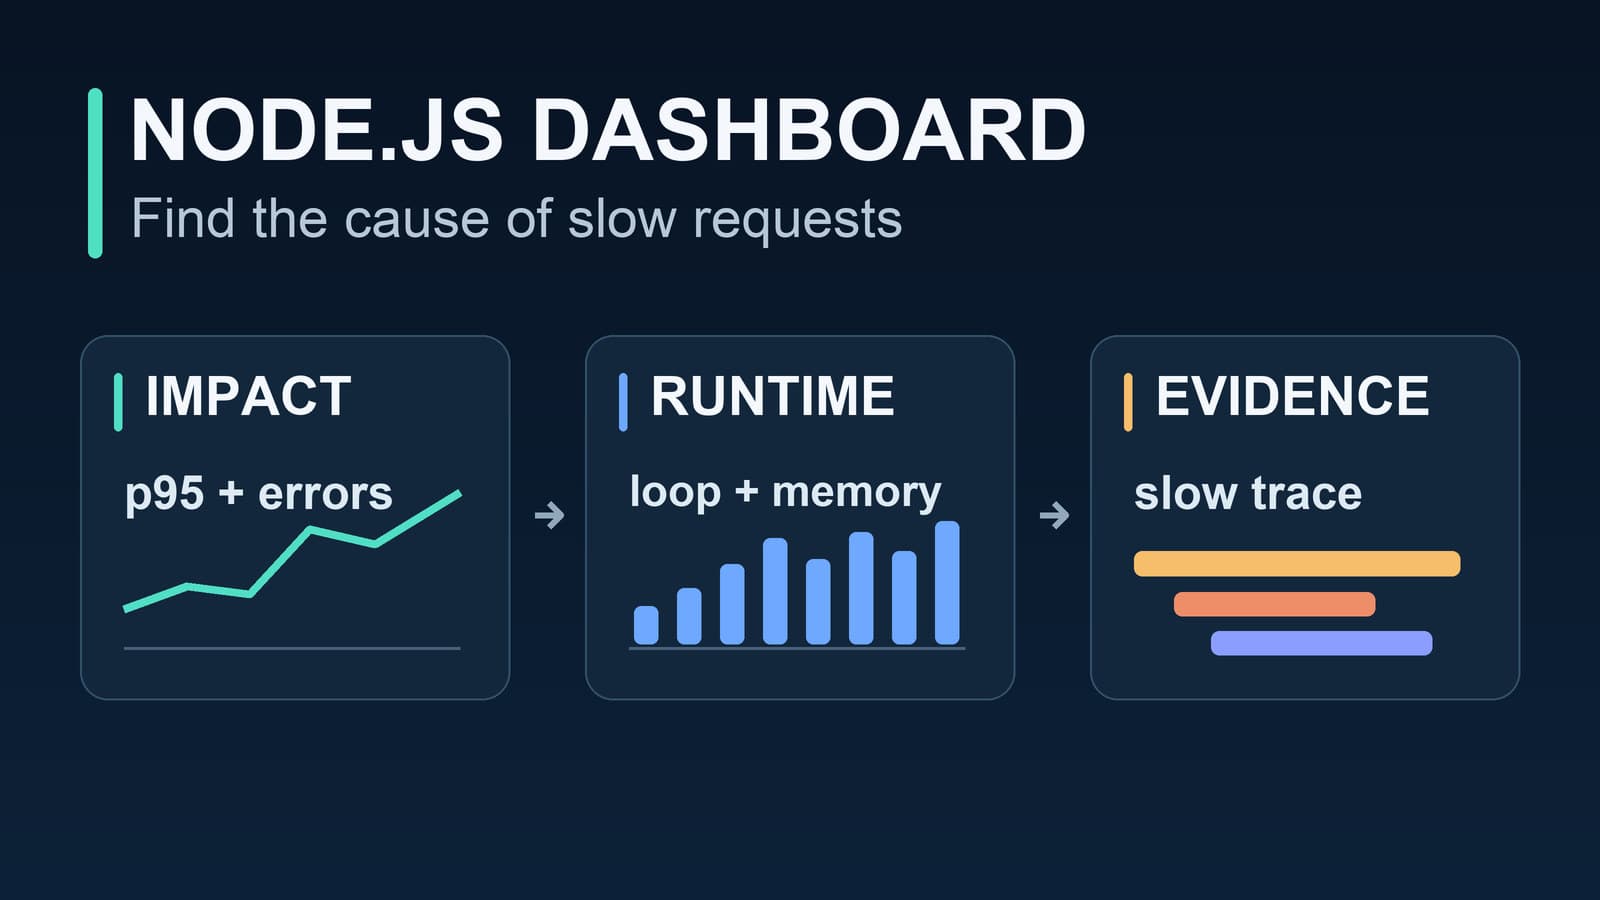
Node.js Monitoring Dashboard: 8 Production Panels
Build a Node.js monitoring dashboard with eight panels that connect request impact, event loop health, memory, and slow traces.
nodejsperformance-monitoringdashboards
Read article
Engineering insights on observability, distributed tracing, and production debugging.
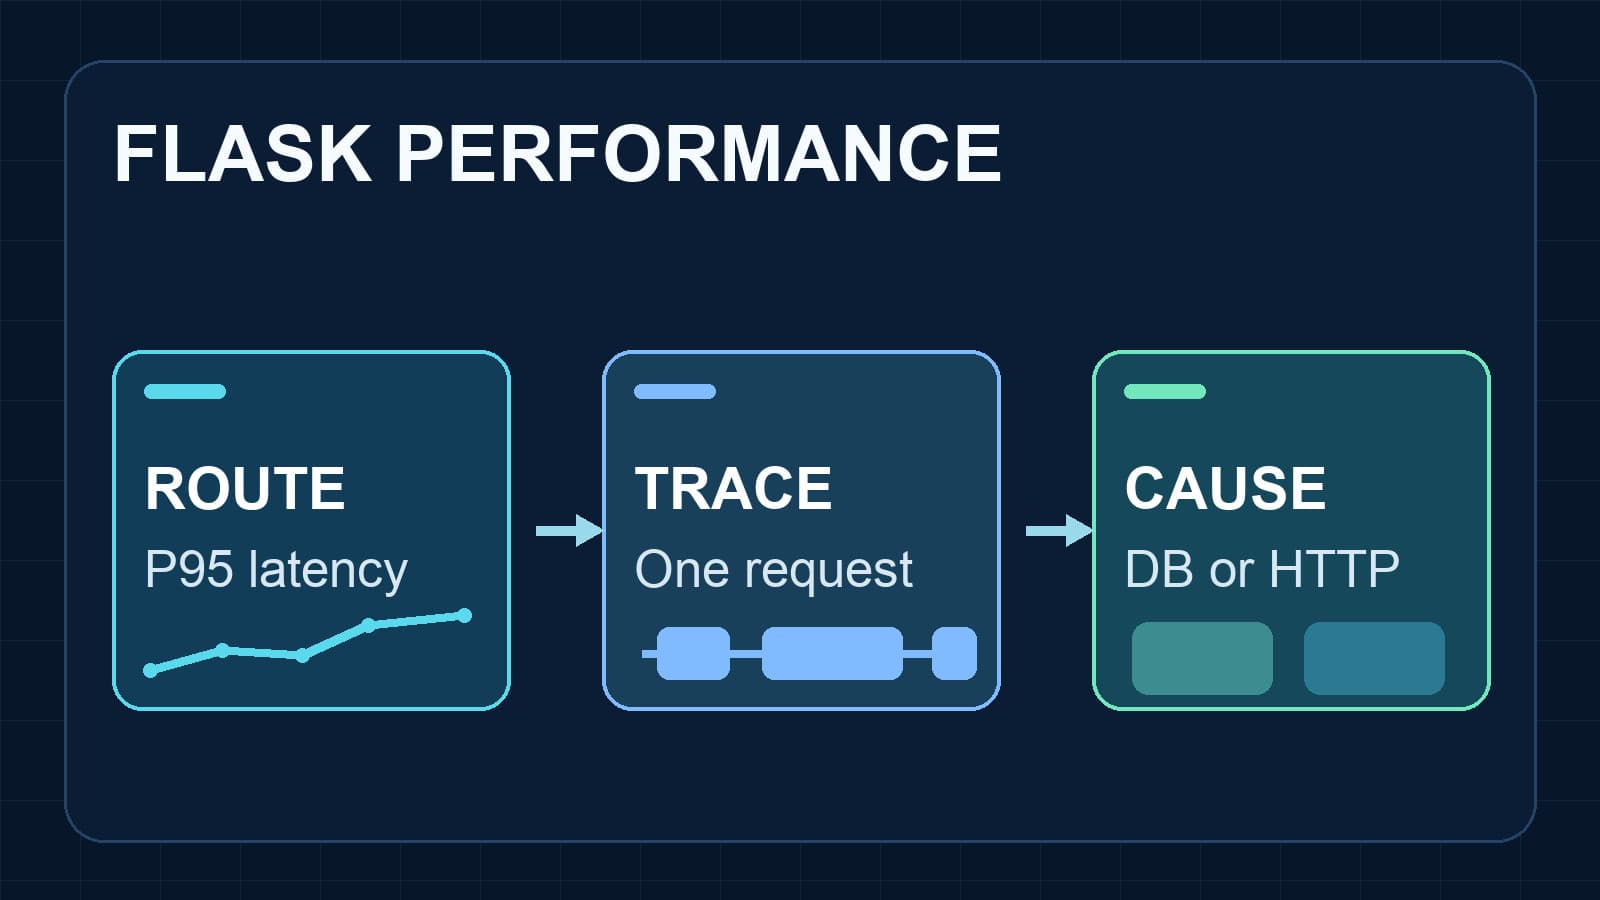
Set up Flask performance monitoring with request metrics and traces. Find slow routes, database calls, and failed exports before users report them.
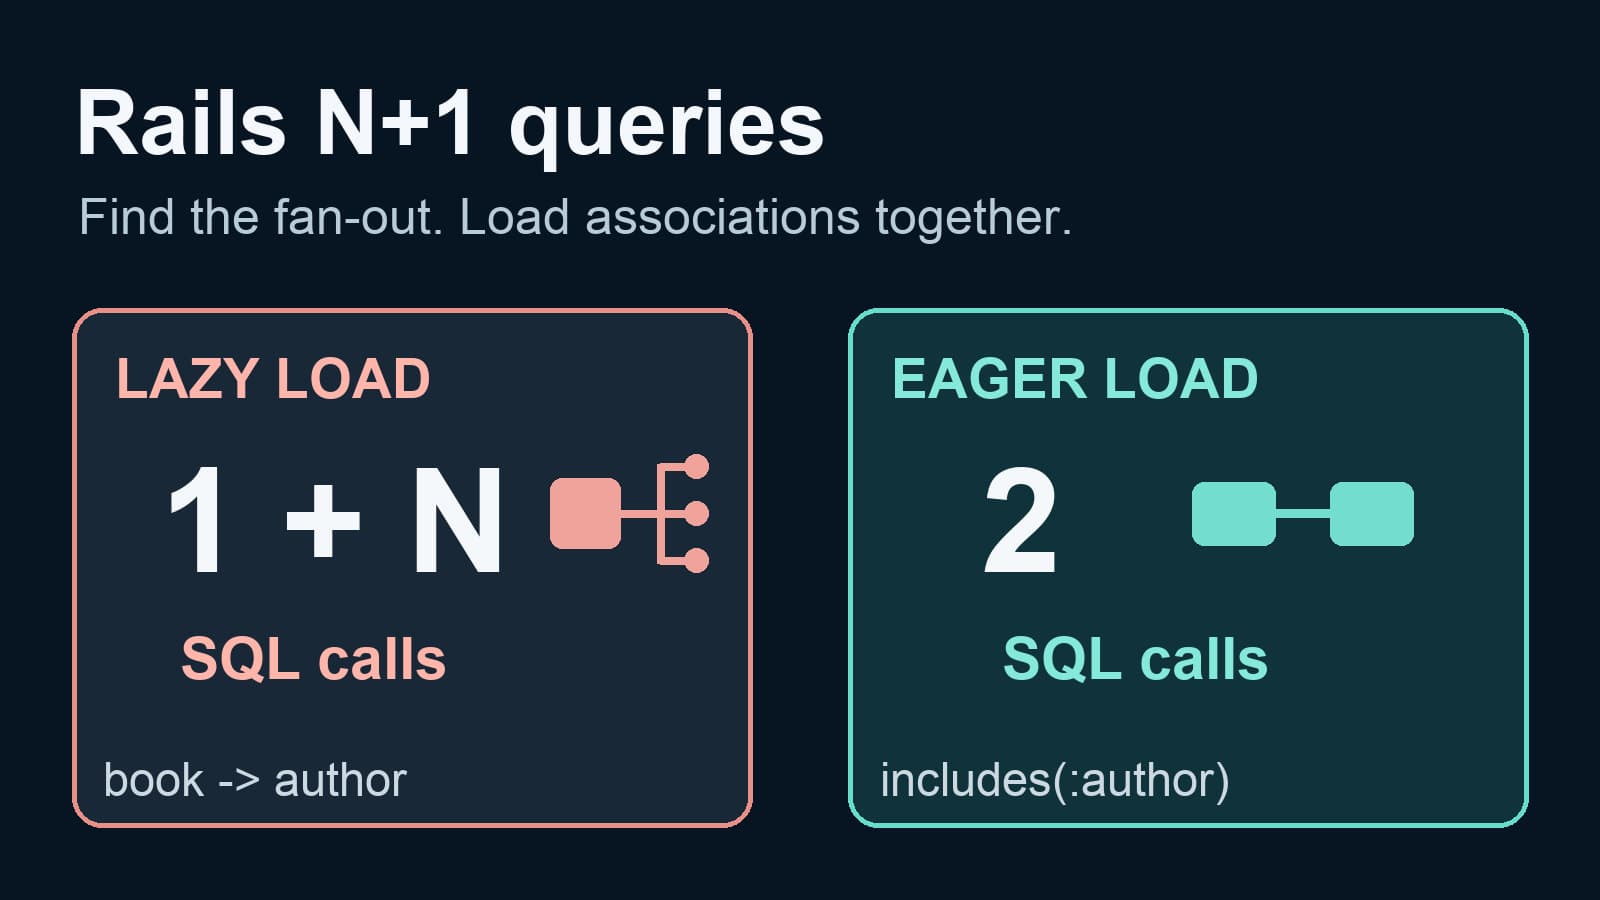
Detect Rails N+1 queries with SQL notifications and strict loading. Fix lazy associations with includes, then verify the request trace.
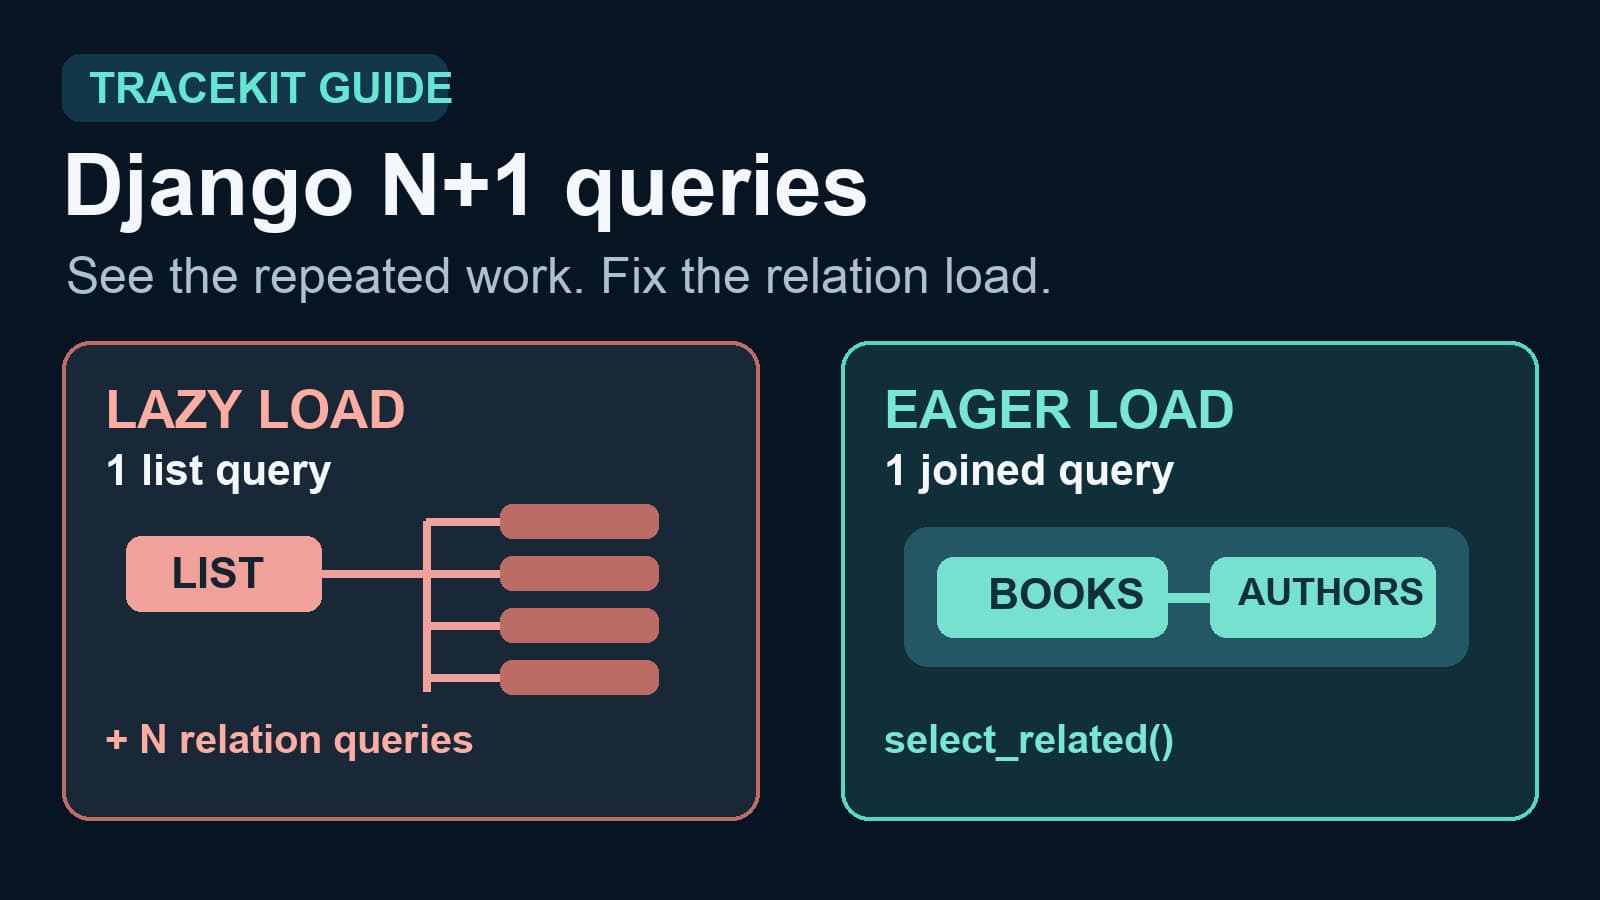
Find Django N+1 queries with query-count tests and request traces. Fix lazy relation loads with select_related or prefetch_related.
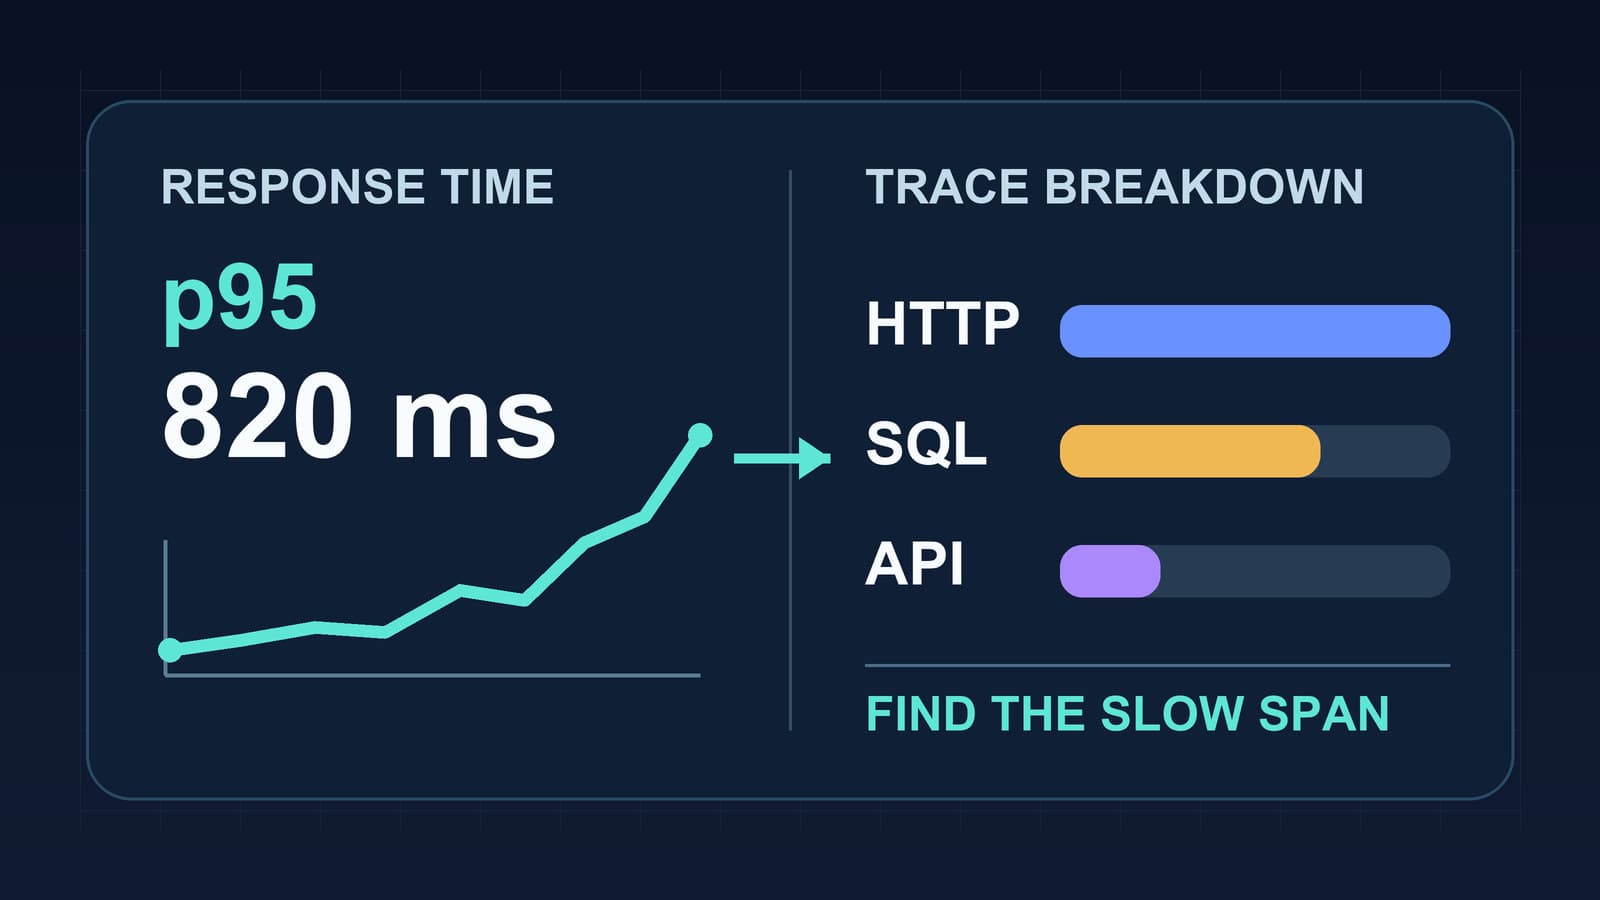
Measure Node.js response time by route, read p95 latency with traces, and separate event loop delays from database and API waits.
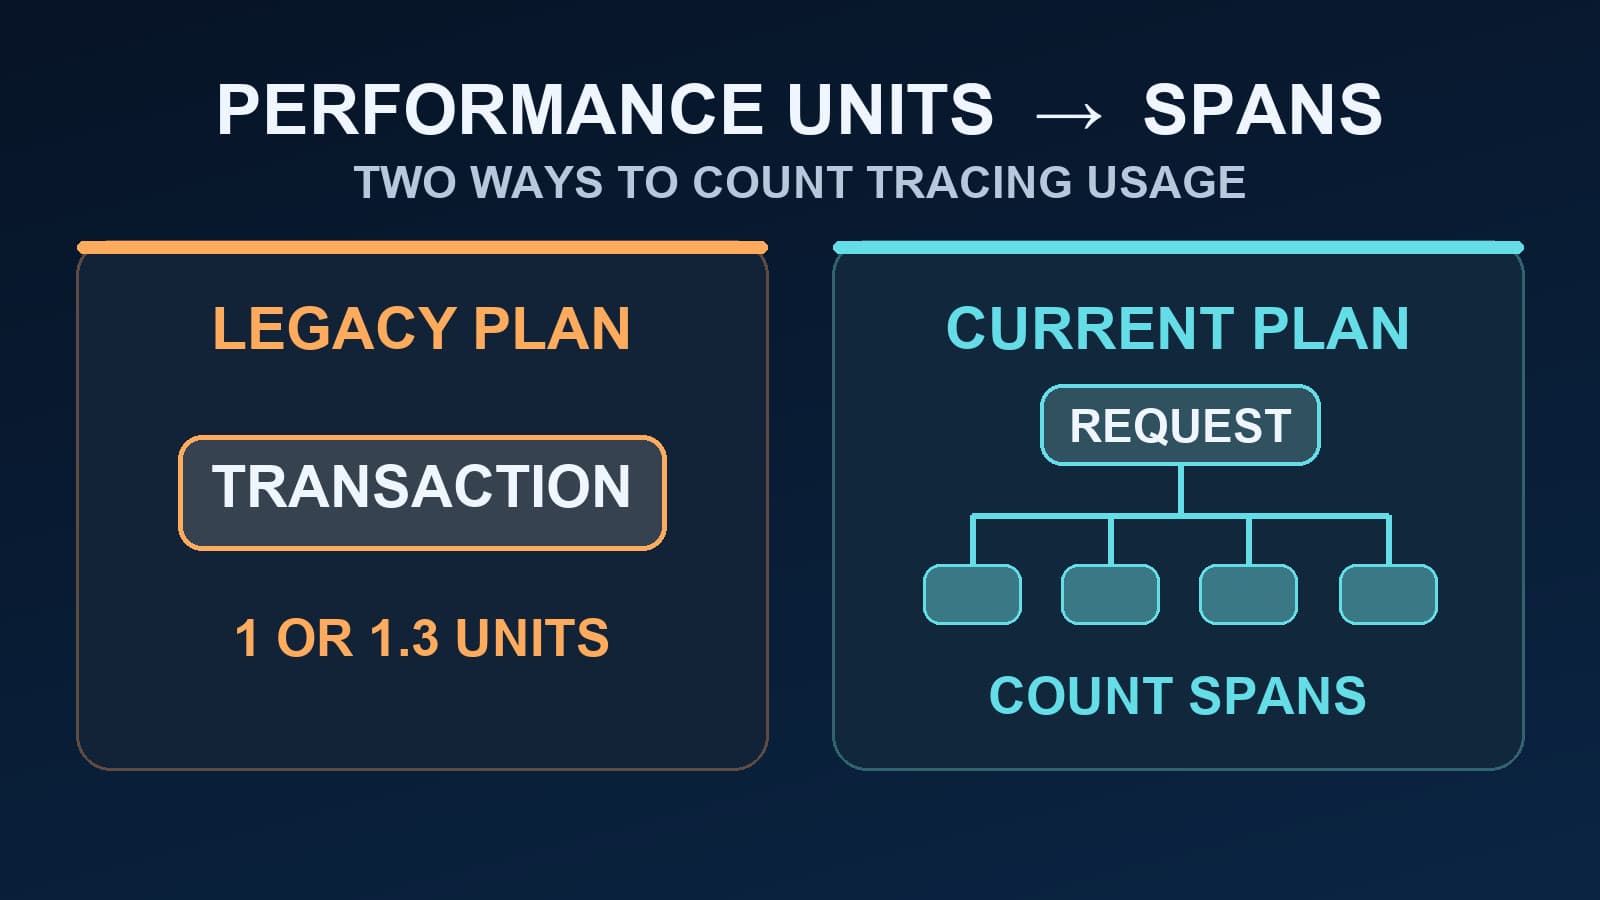
Learn when Sentry performance units still apply, how legacy transactions were counted, and why current span quotas need a different estimate.
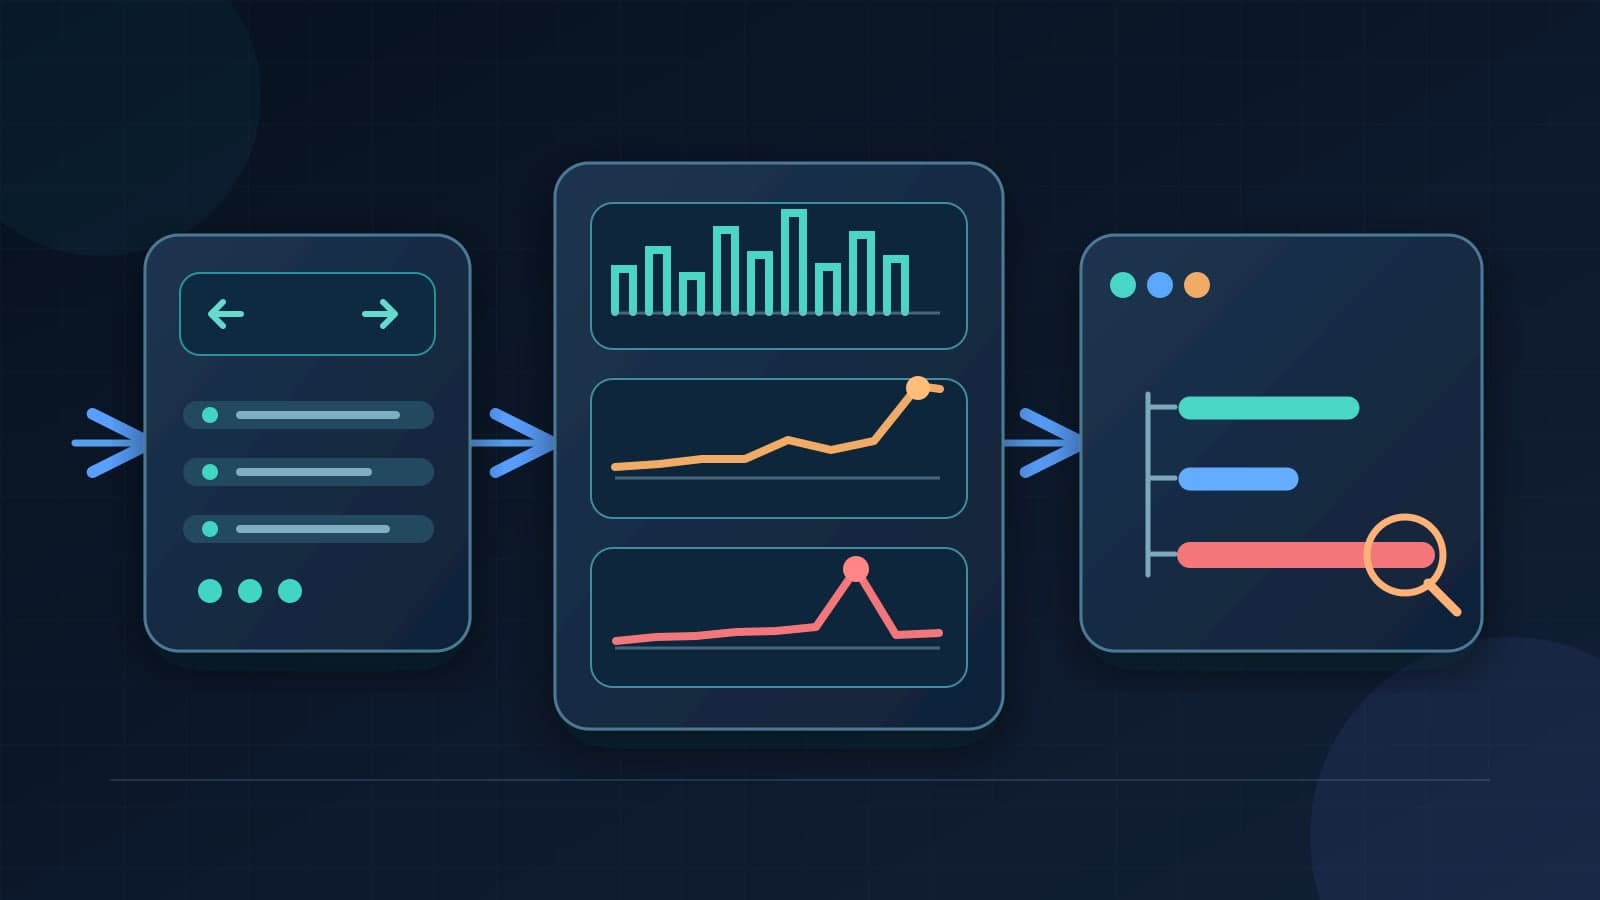
Monitor FastAPI routes with request metrics and OpenTelemetry traces. Check latency, errors, and downstream work before setting alerts.
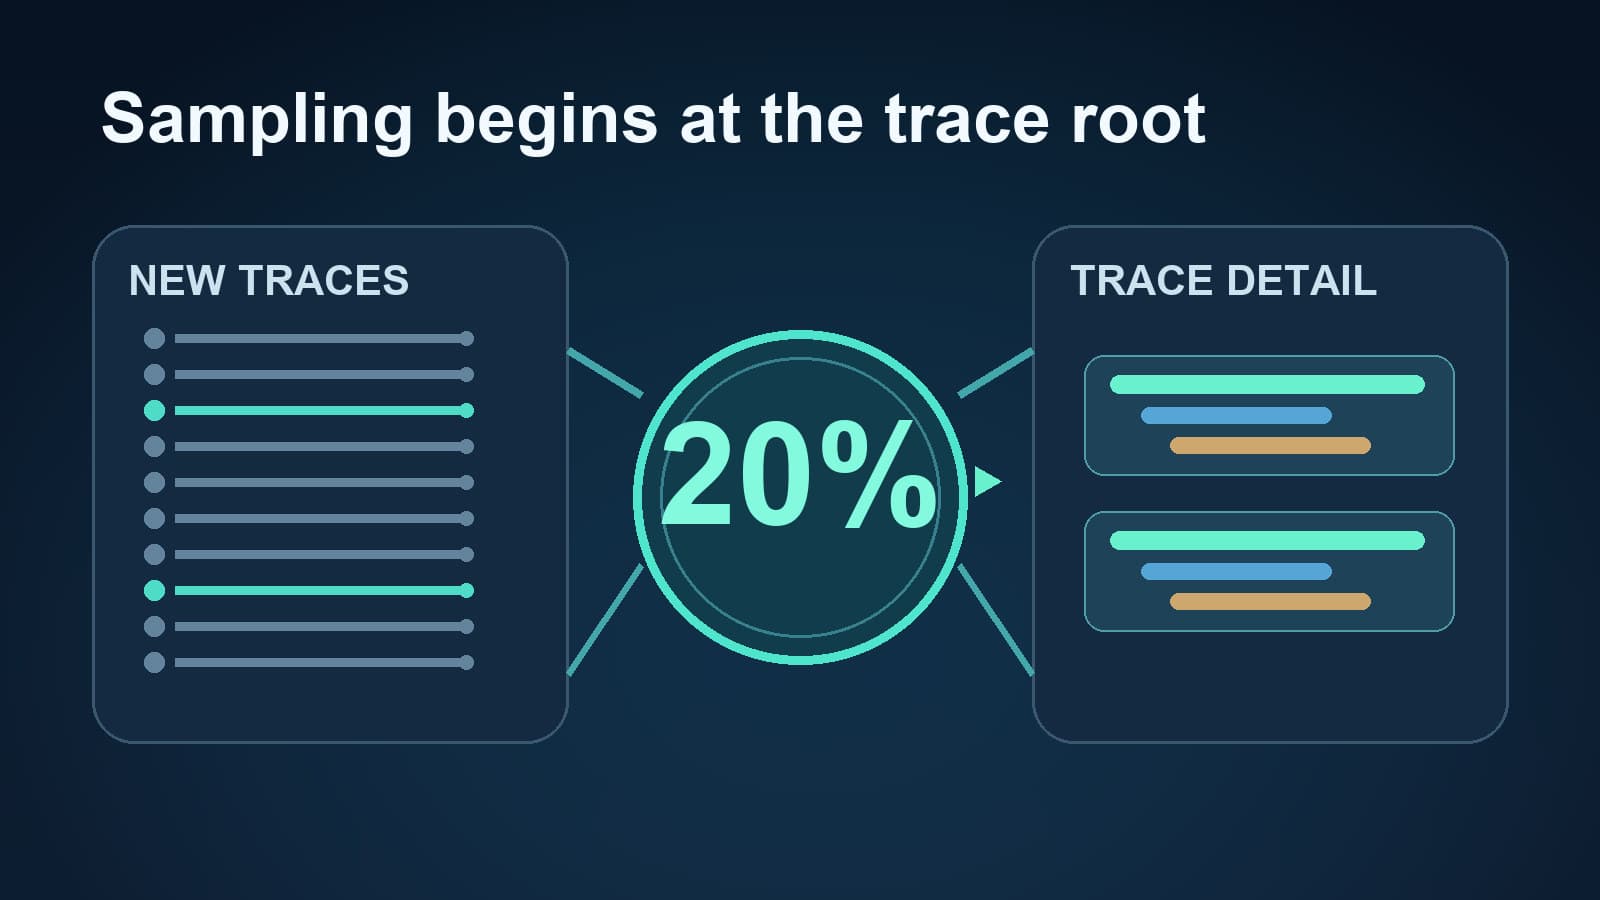
Set ELASTIC_APM_TRANSACTION_SAMPLE_RATE, check why it seems ignored, and map the setting to OpenTelemetry sampling during a migration.
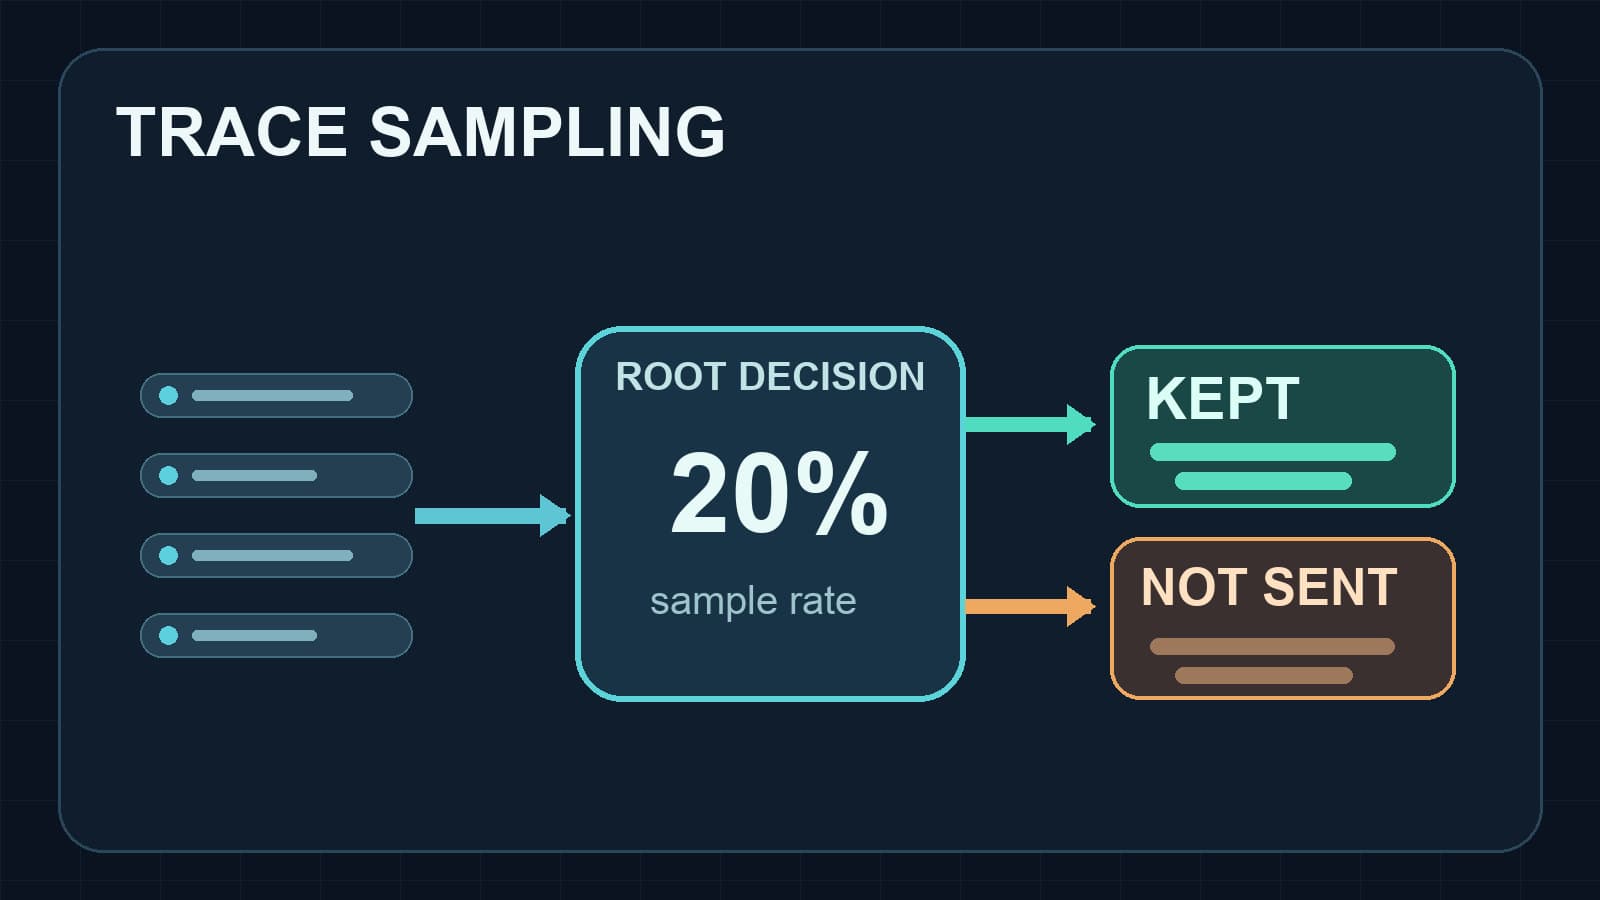
Set DD_TRACE_SAMPLE_RATE in Node.js, understand rate limits and sampling rules, and verify which distributed traces reach Datadog.
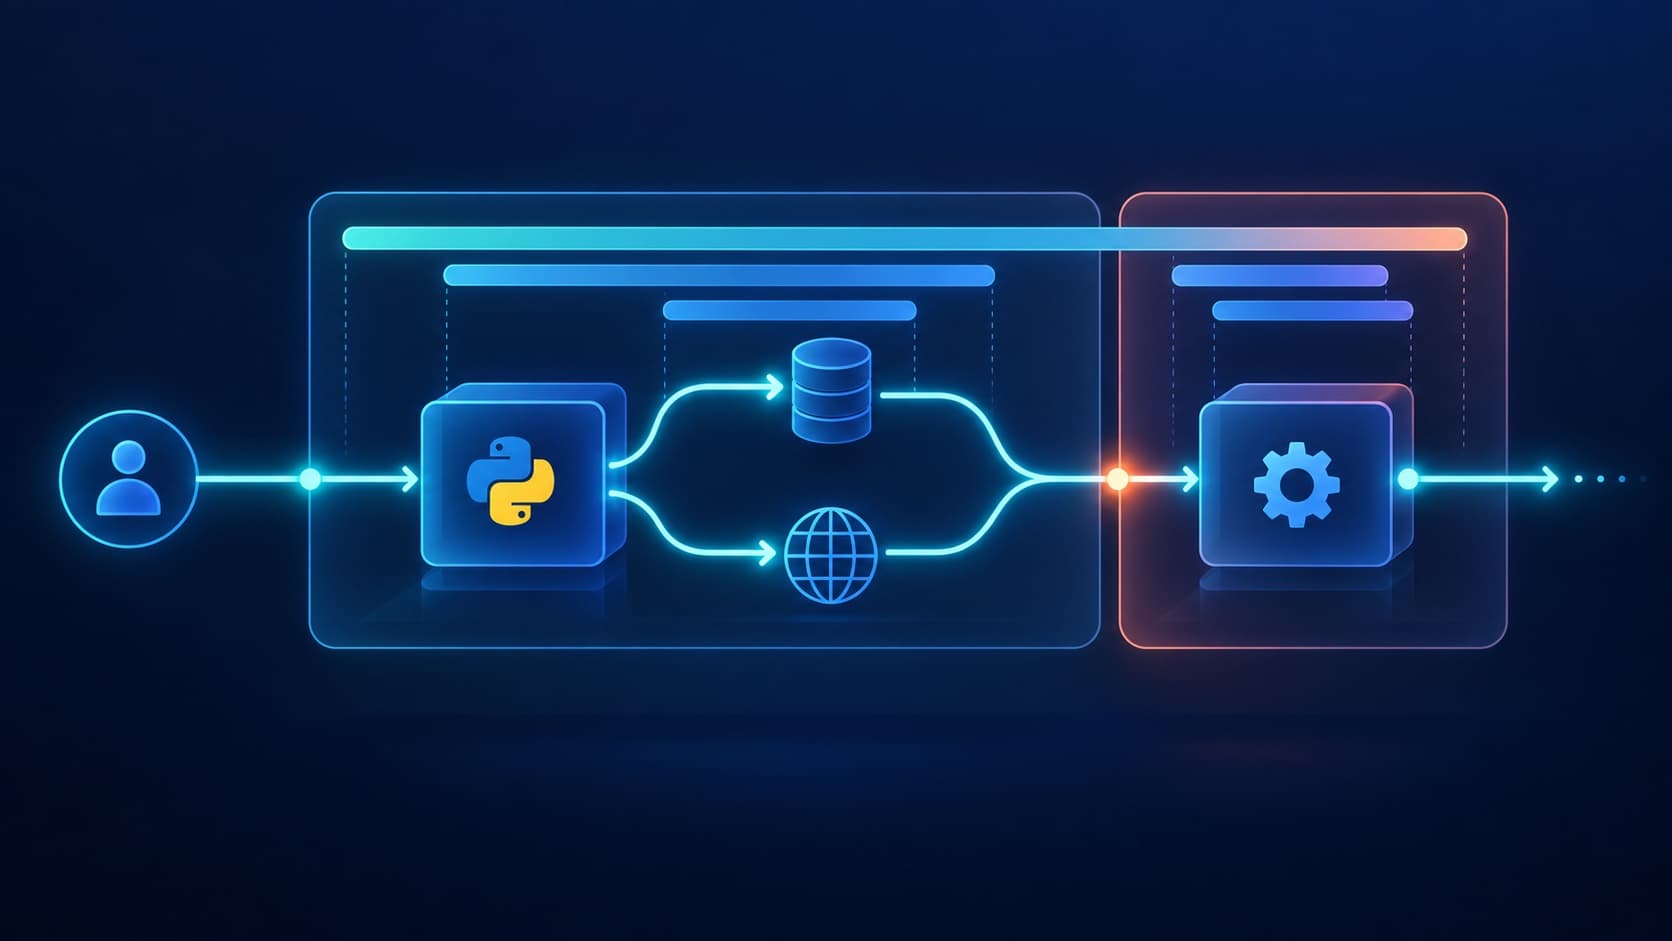
Set up FastAPI tracing with OpenTelemetry. Connect request, SQLAlchemy, and HTTPX spans, then verify trace context across services.
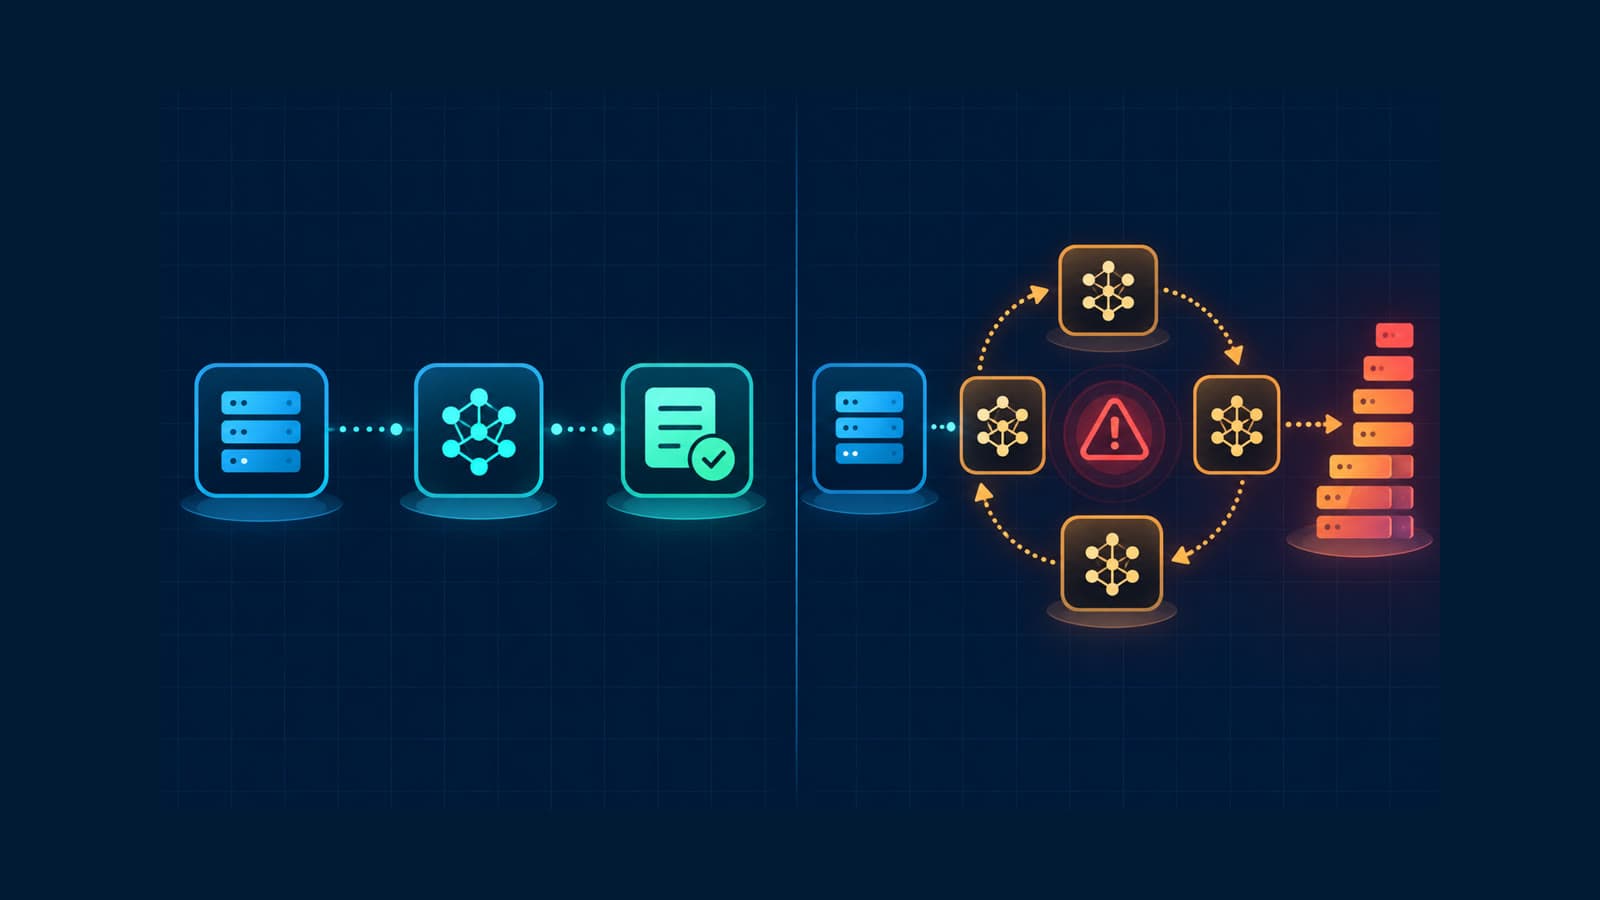
Track rogue LLM calls with traces, call counts, token usage, costs, models, and retry evidence before a loop becomes an incident.
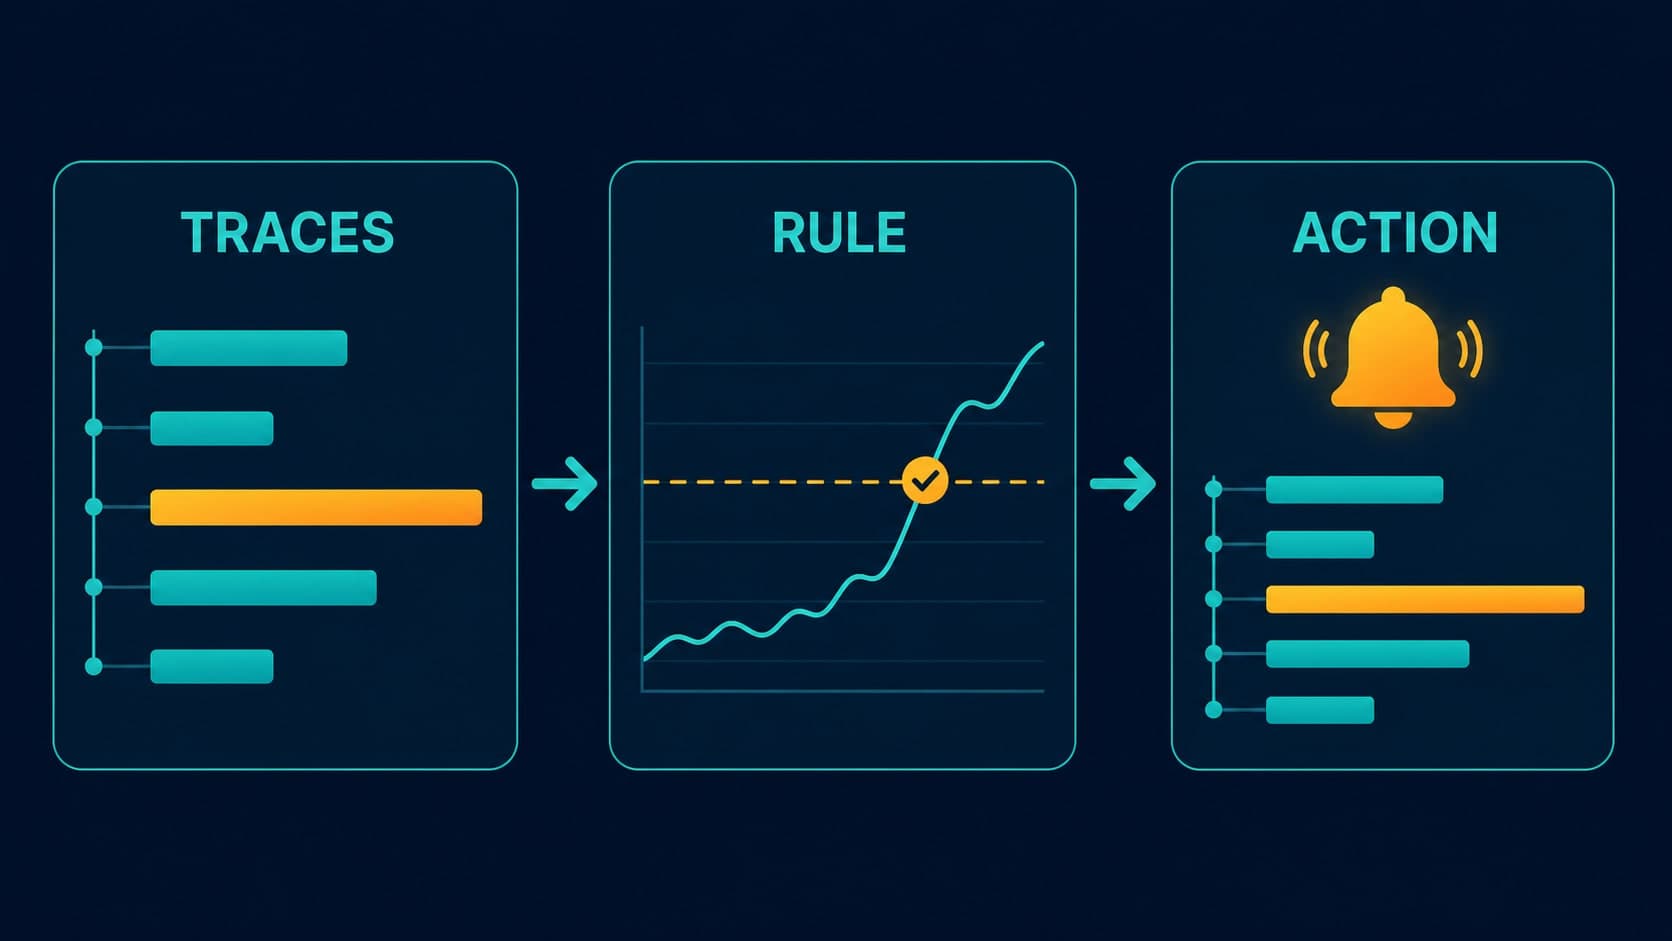
Set up trace based alerts for errors and latency. Check sampling, request counts, time windows, and notification context before paging.