
5 min
OpenTelemetry Manual Spans in Python Applications
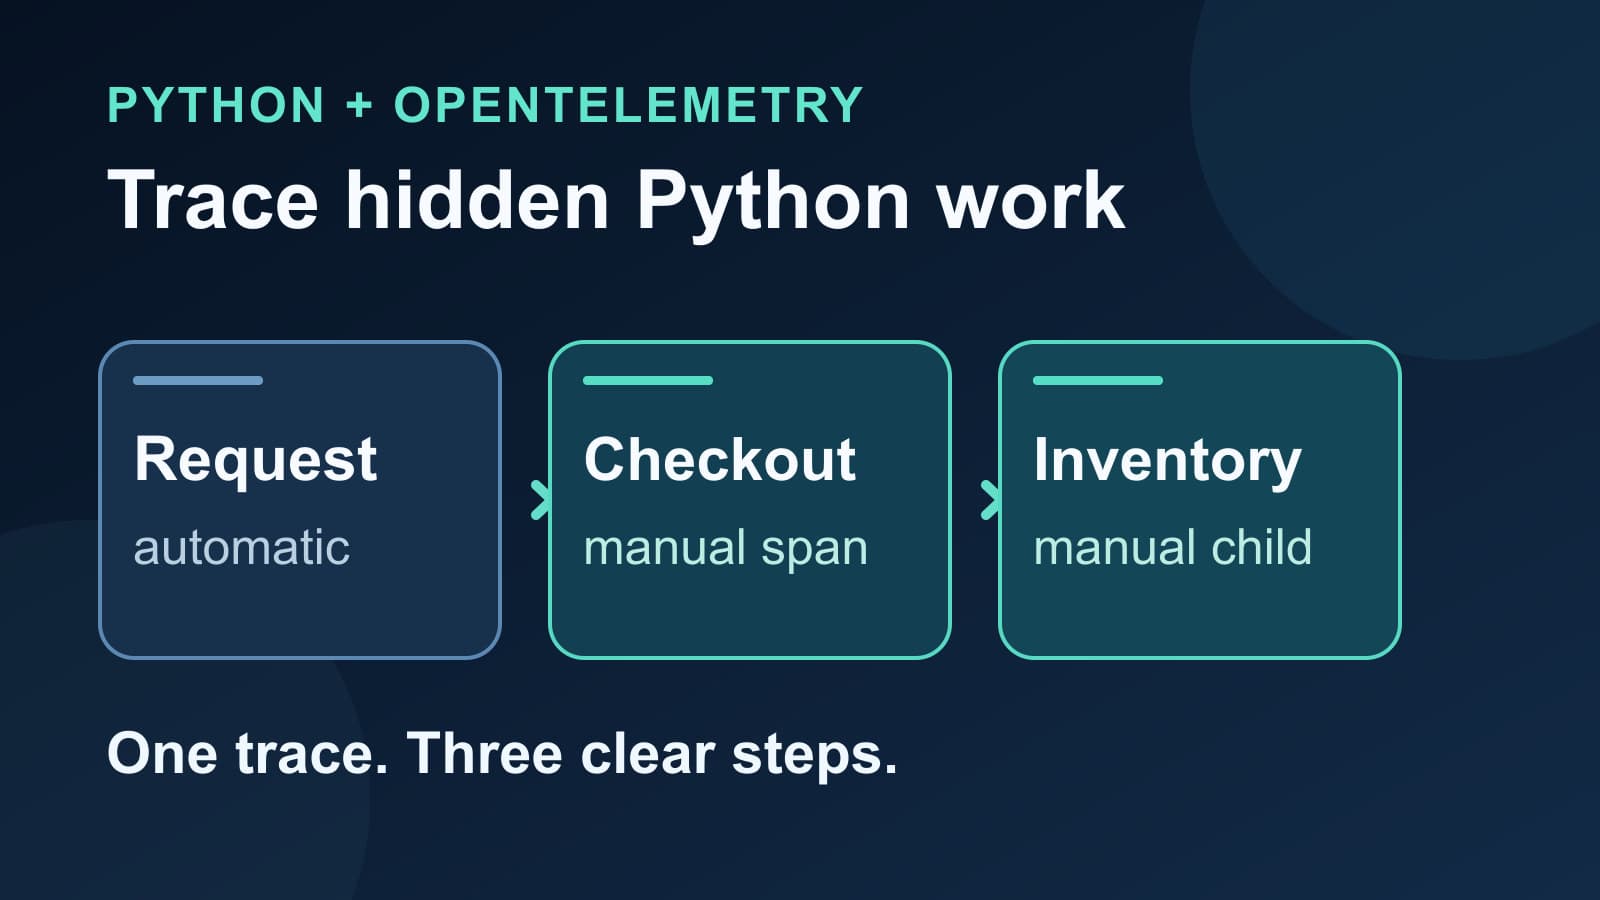
Add OpenTelemetry manual spans to a Python application. See parent-child timing, safe attributes, and a checklist for missing spans.
opentelemetrypython
Engineering insights on observability, distributed tracing, and production debugging.
Add OpenTelemetry manual spans to a Python application. See parent-child timing, safe attributes, and a checklist for missing spans.
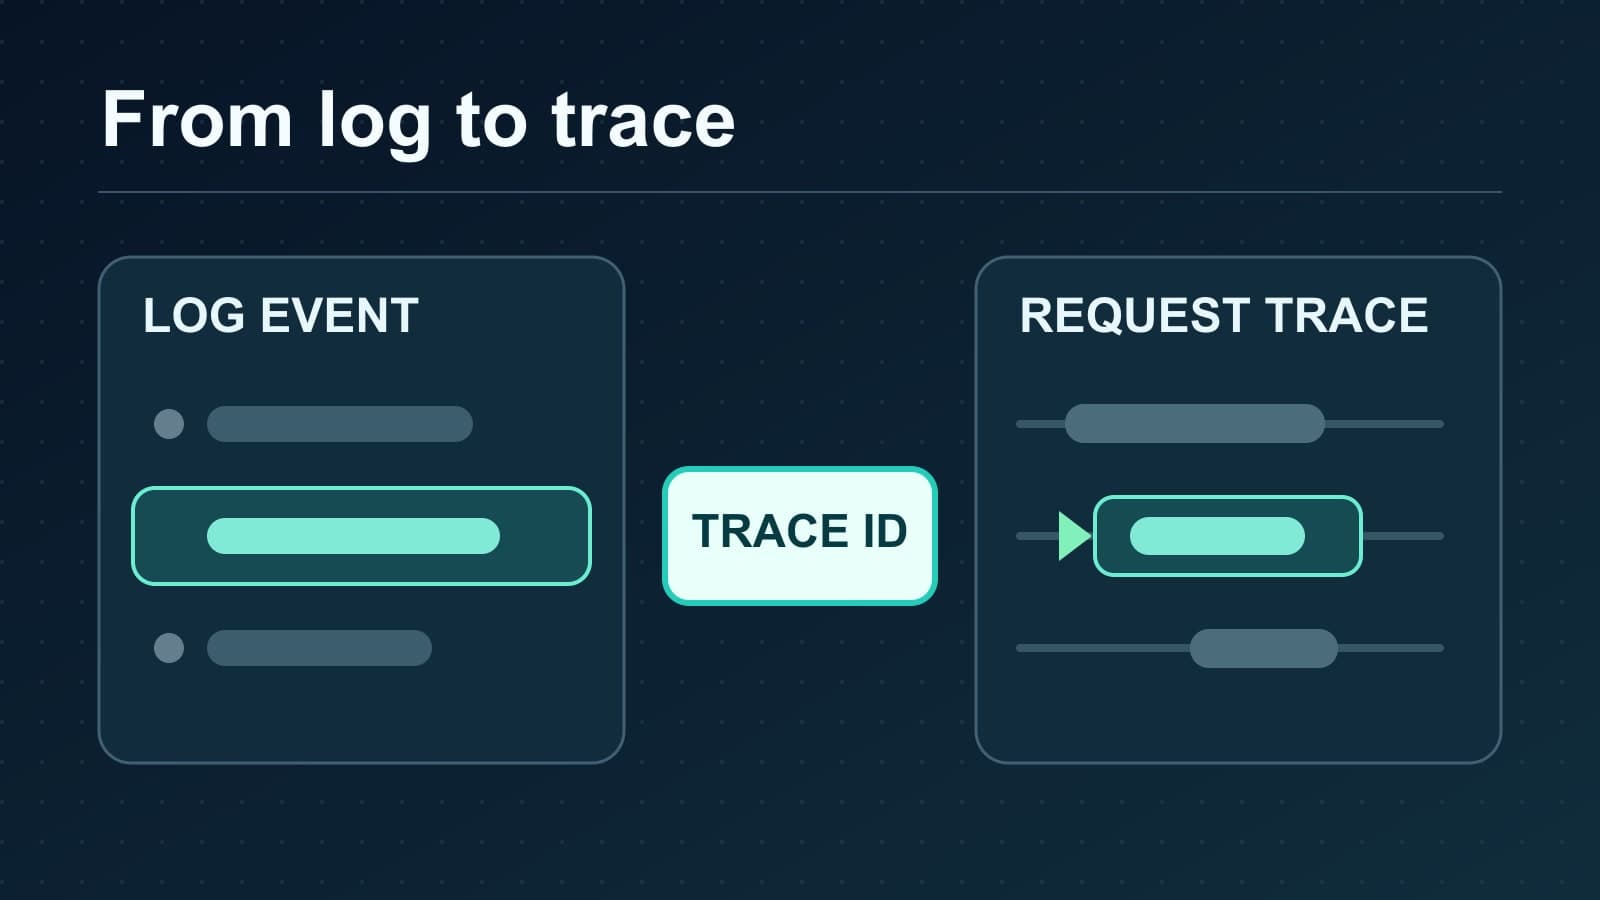
Correlate logs with traces using trace IDs, span IDs, and a request test. Find missing context across services without relying on timestamps alone.
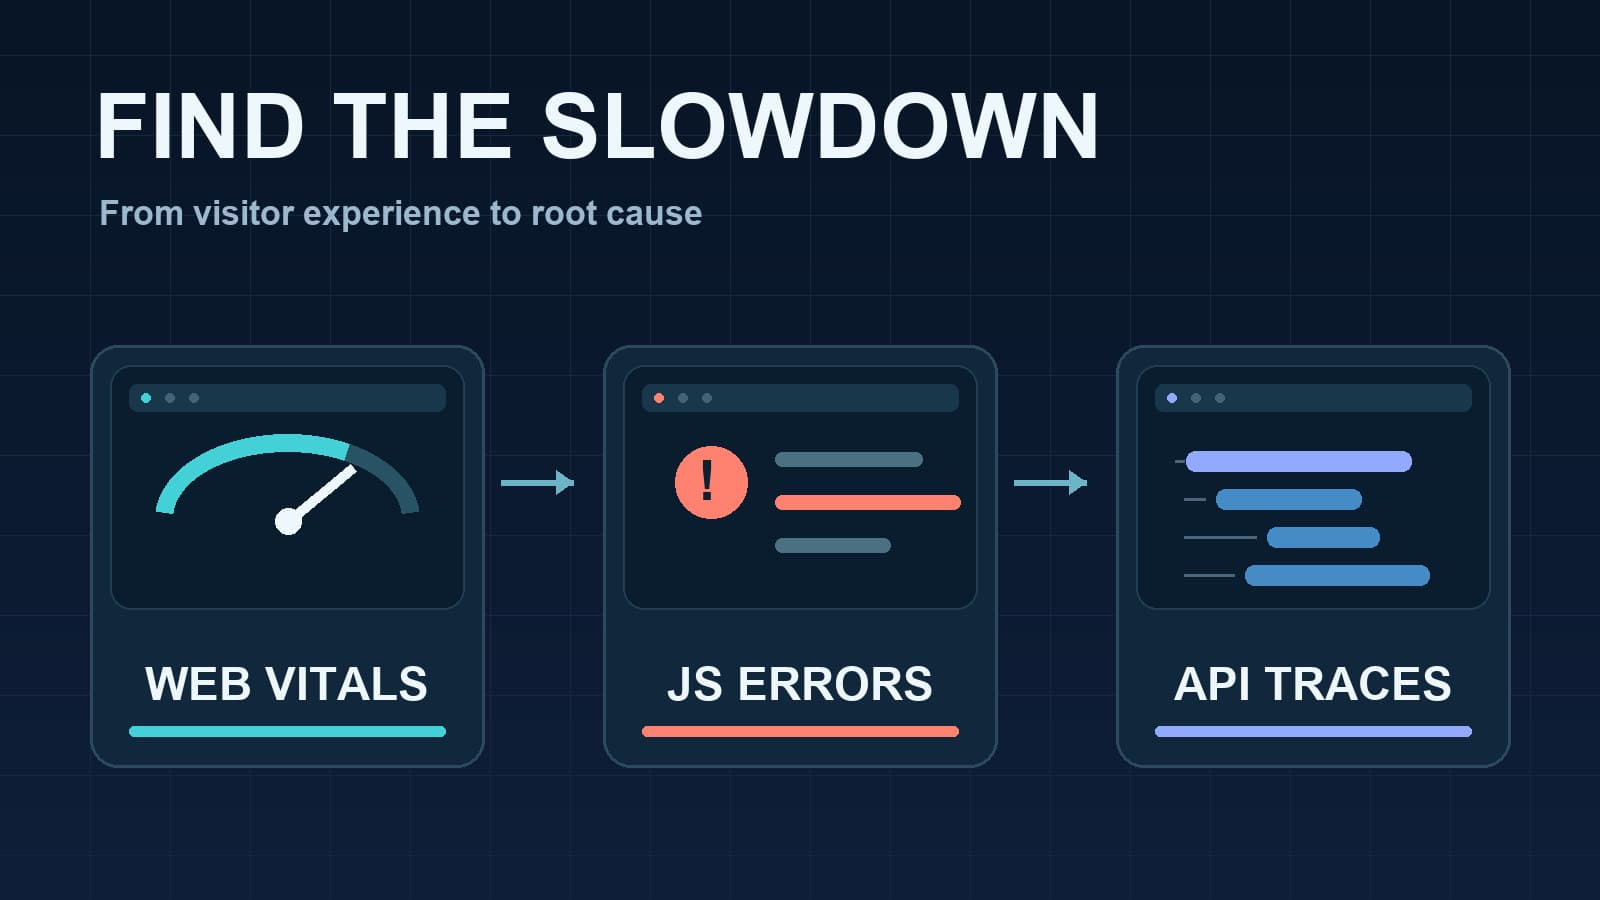
Set up front end performance monitoring with field Web Vitals, browser errors, and request traces. Use this checklist to find the cause of slow pages.
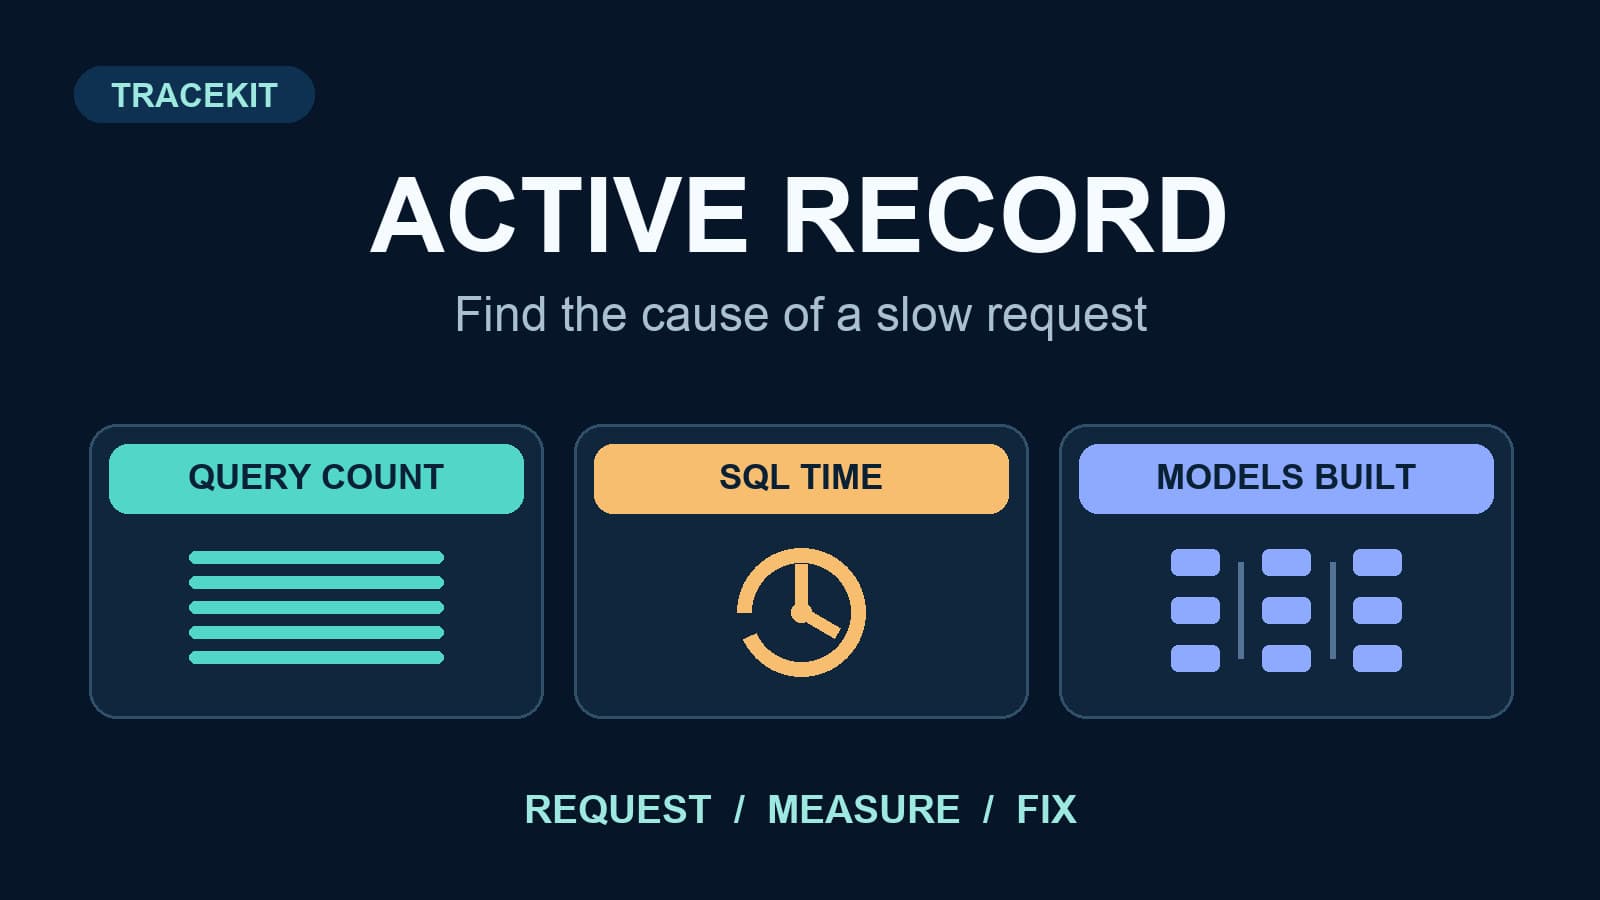
Monitor ActiveRecord query count, SQL time, and object instantiation in Rails. Use request traces to confirm production bottlenecks.
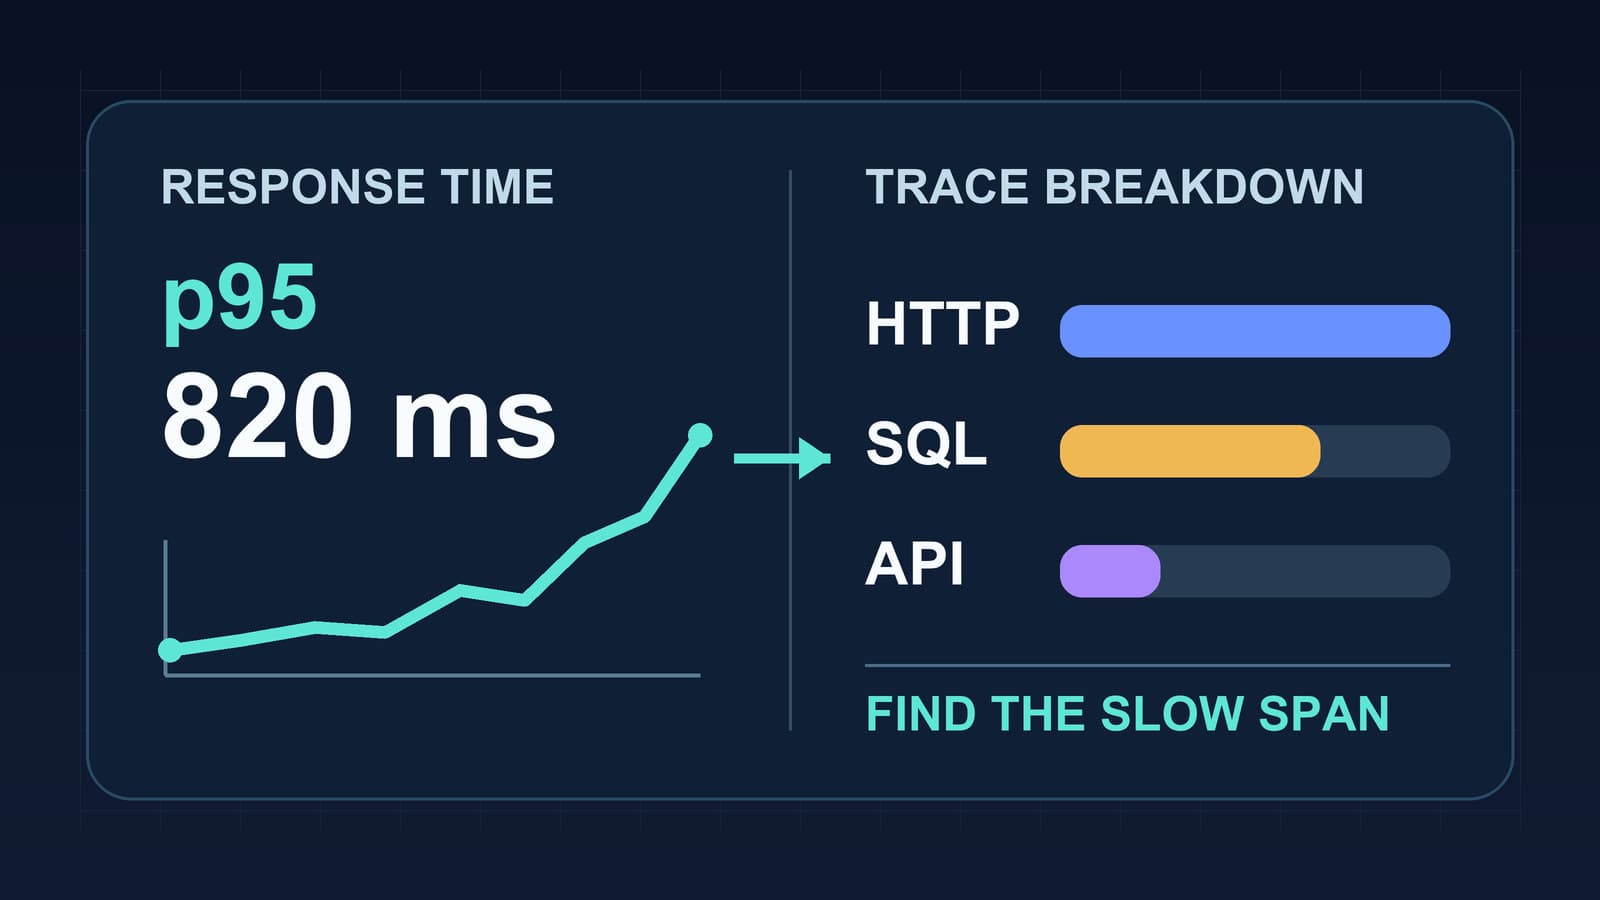
Measure Node.js response time by route, read p95 latency with traces, and separate event loop delays from database and API waits.
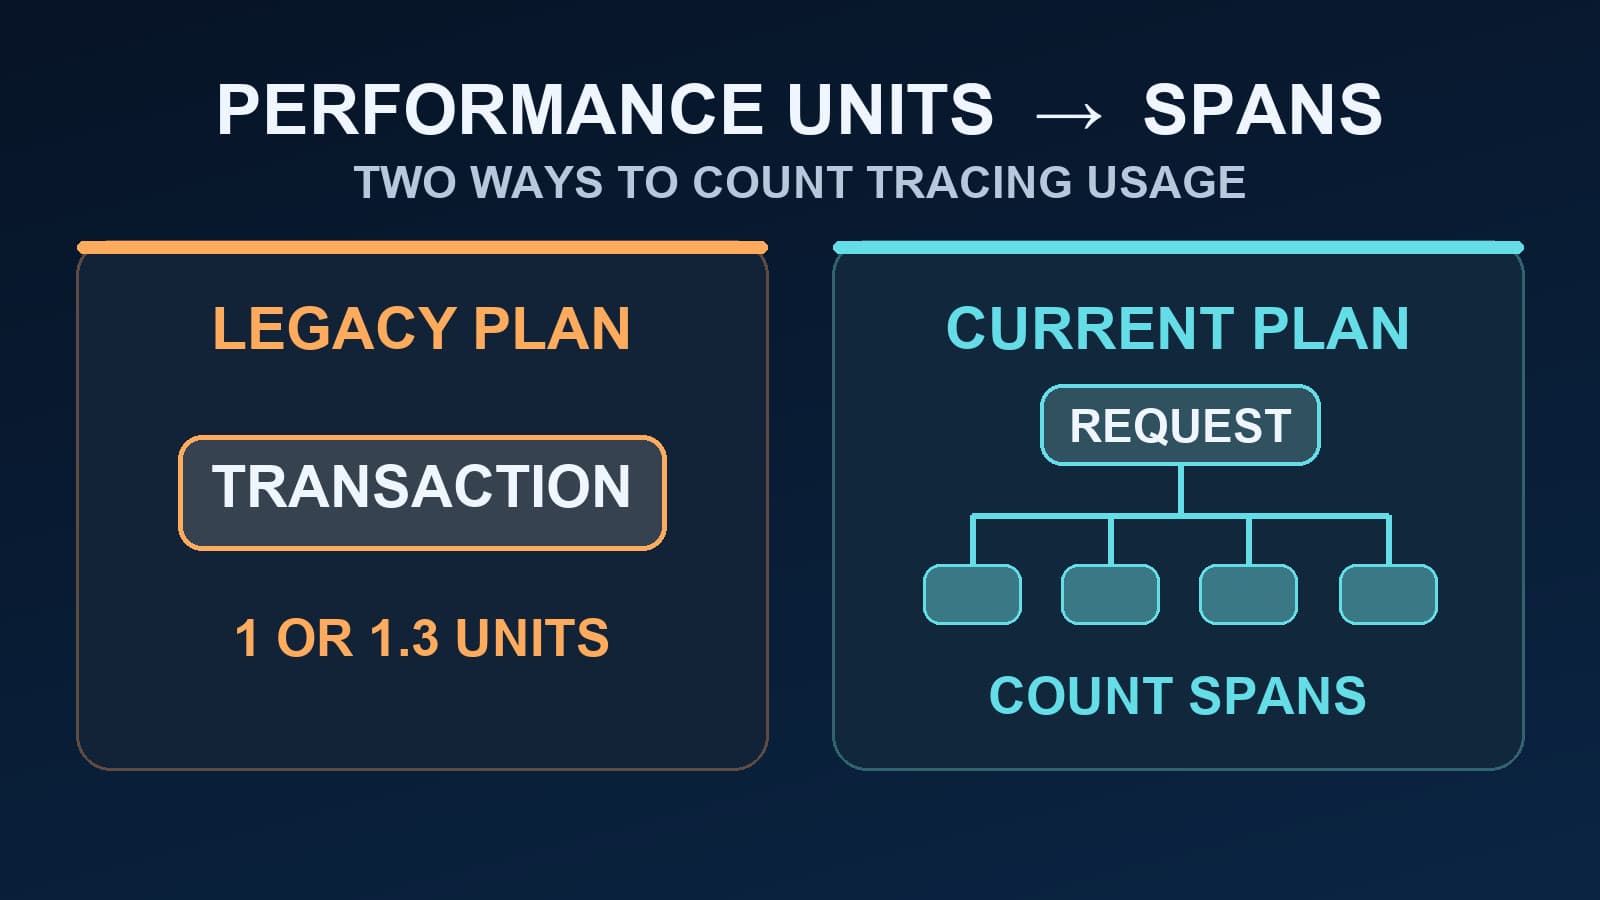
Learn when Sentry performance units still apply, how legacy transactions were counted, and why current span quotas need a different estimate.
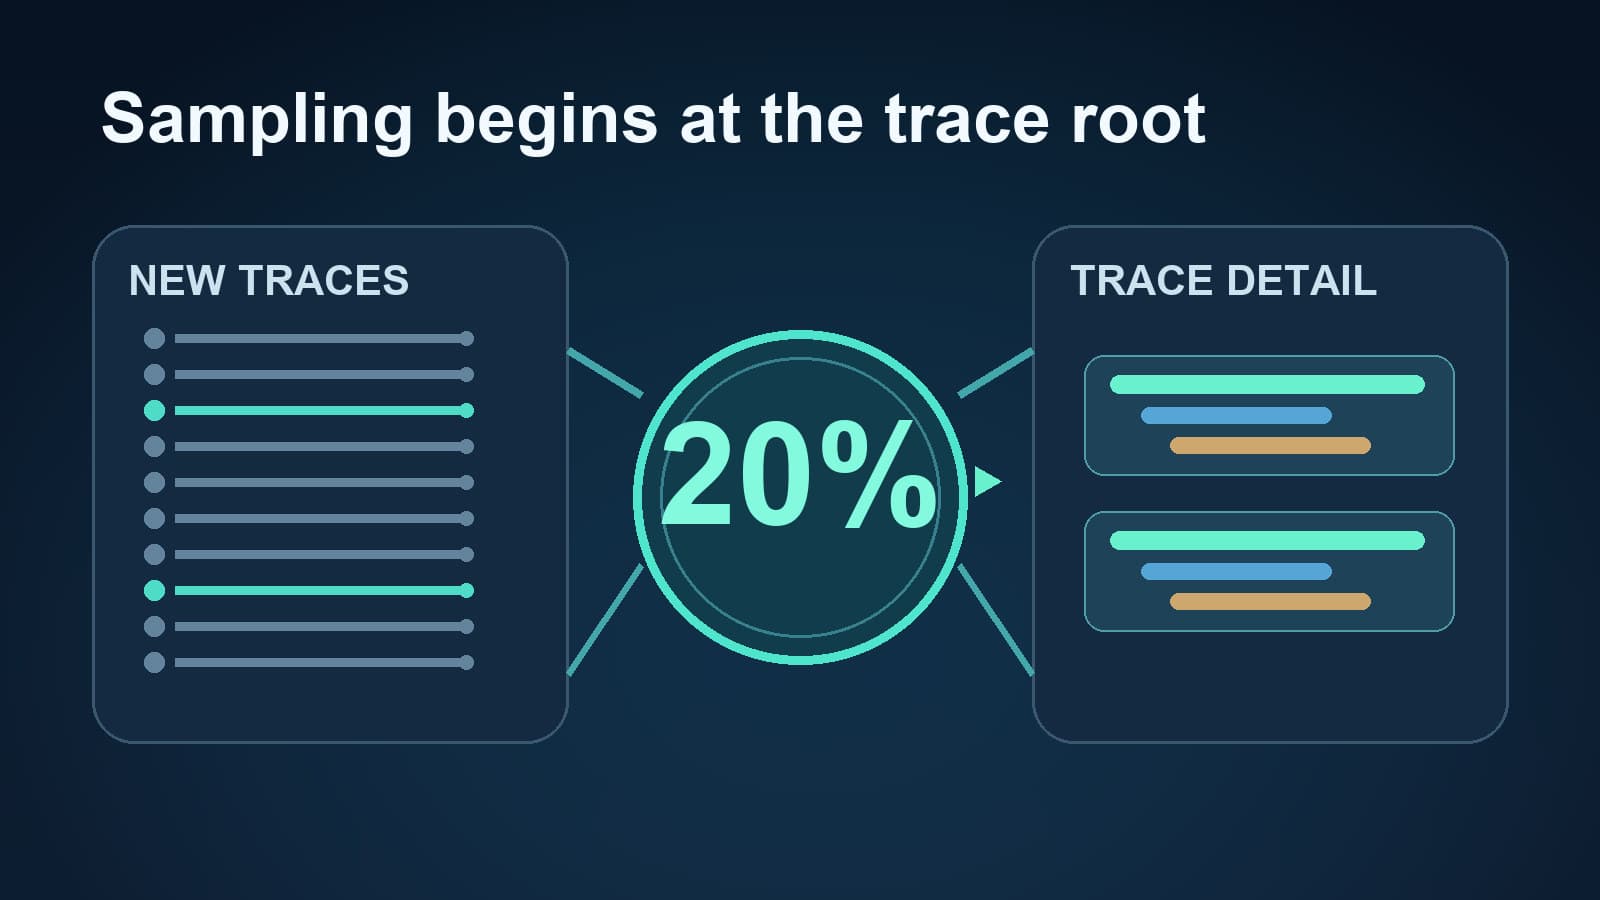
Set ELASTIC_APM_TRANSACTION_SAMPLE_RATE, check why it seems ignored, and map the setting to OpenTelemetry sampling during a migration.
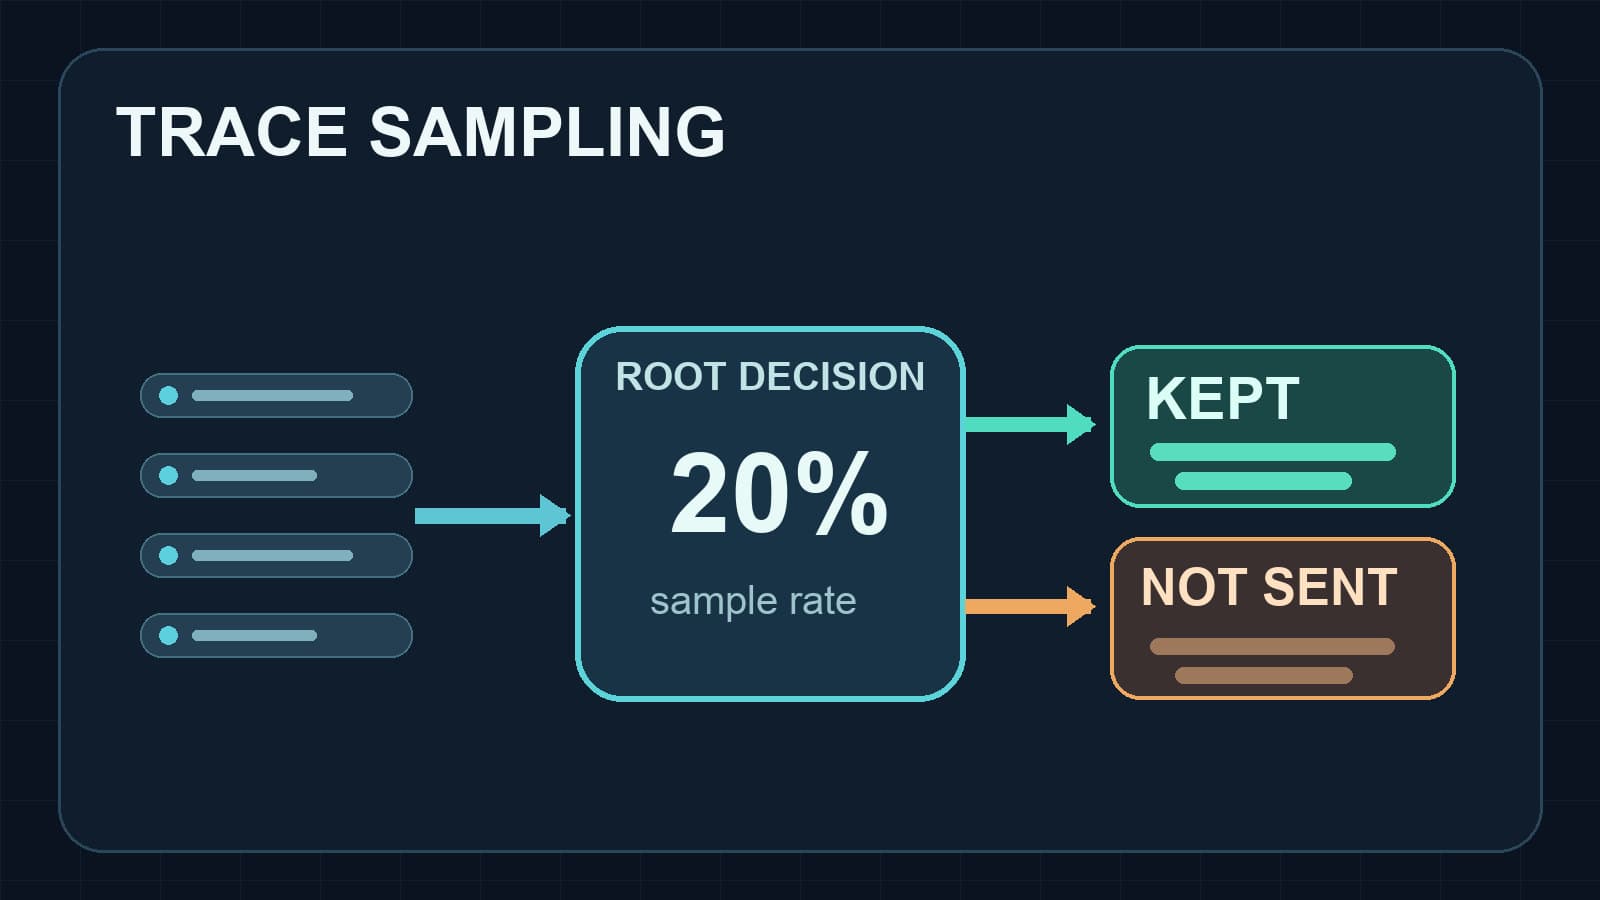
Set DD_TRACE_SAMPLE_RATE in Node.js, understand rate limits and sampling rules, and verify which distributed traces reach Datadog.

Set up FastAPI tracing with OpenTelemetry. Connect request, SQLAlchemy, and HTTPX spans, then verify trace context across services.
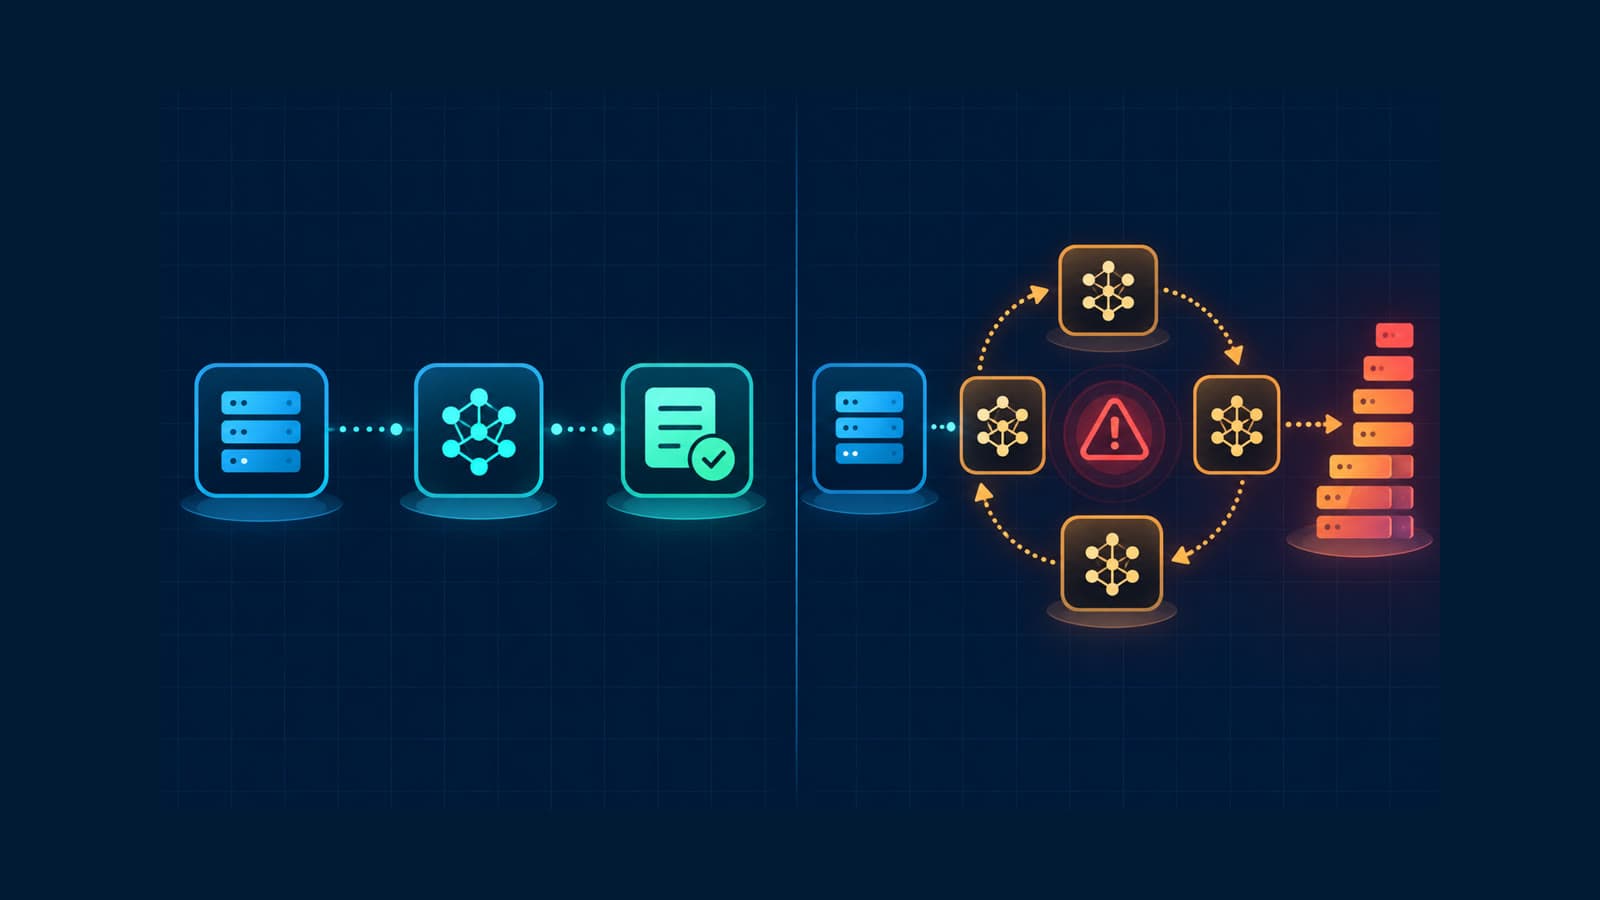
Track rogue LLM calls with traces, call counts, token usage, costs, models, and retry evidence before a loop becomes an incident.
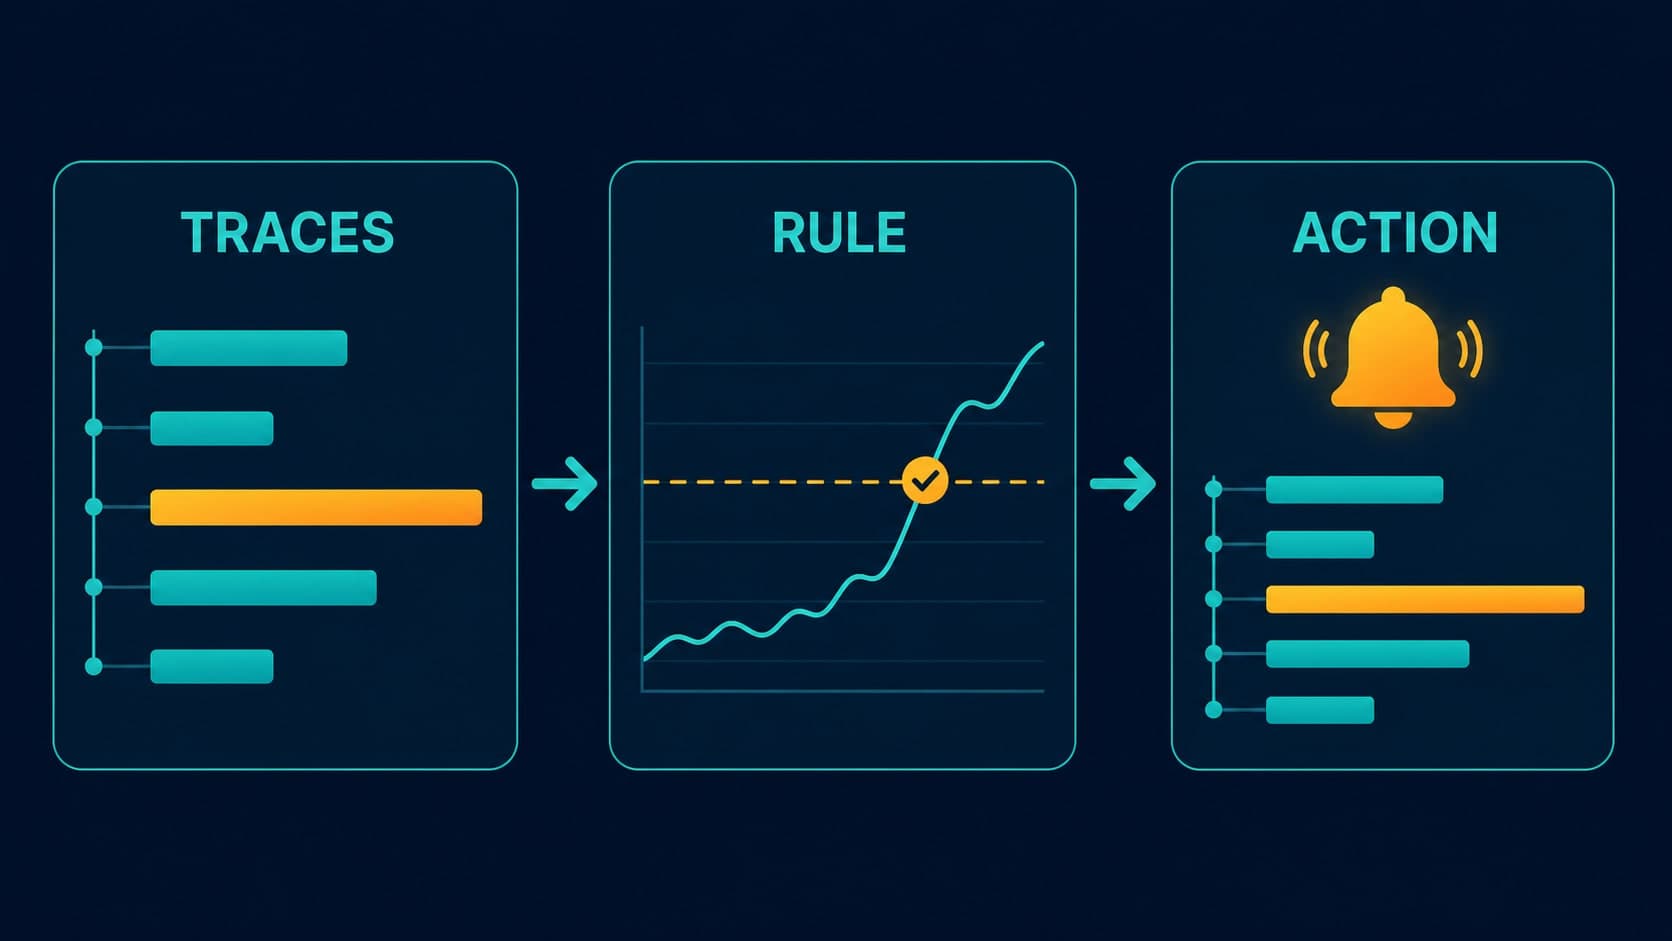
Set up trace based alerts for errors and latency. Check sampling, request counts, time windows, and notification context before paging.
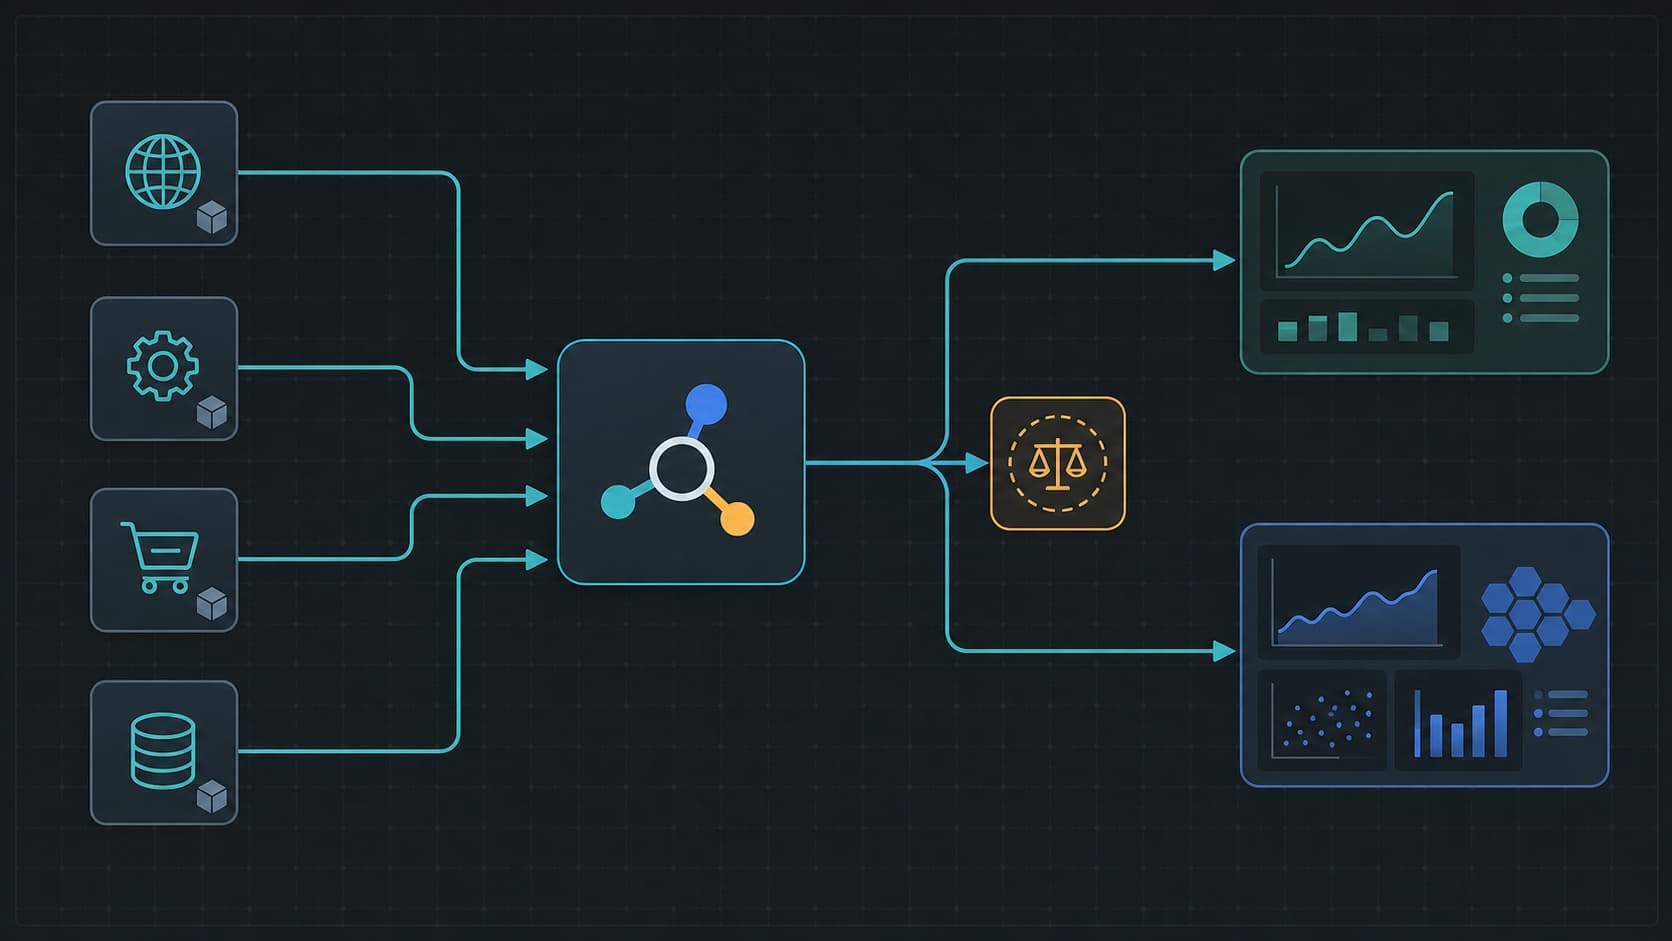
Migrate to OpenTelemetry without downtime with a parallel Collector path, trace parity checks, and a safe service-by-service cutover.