
dd-trace Init Order in Node.js: CommonJS and ESM
Fix dd-trace init order in Node.js with correct CommonJS, ESM, TypeScript, and bundler startup patterns when spans or routes disappear.
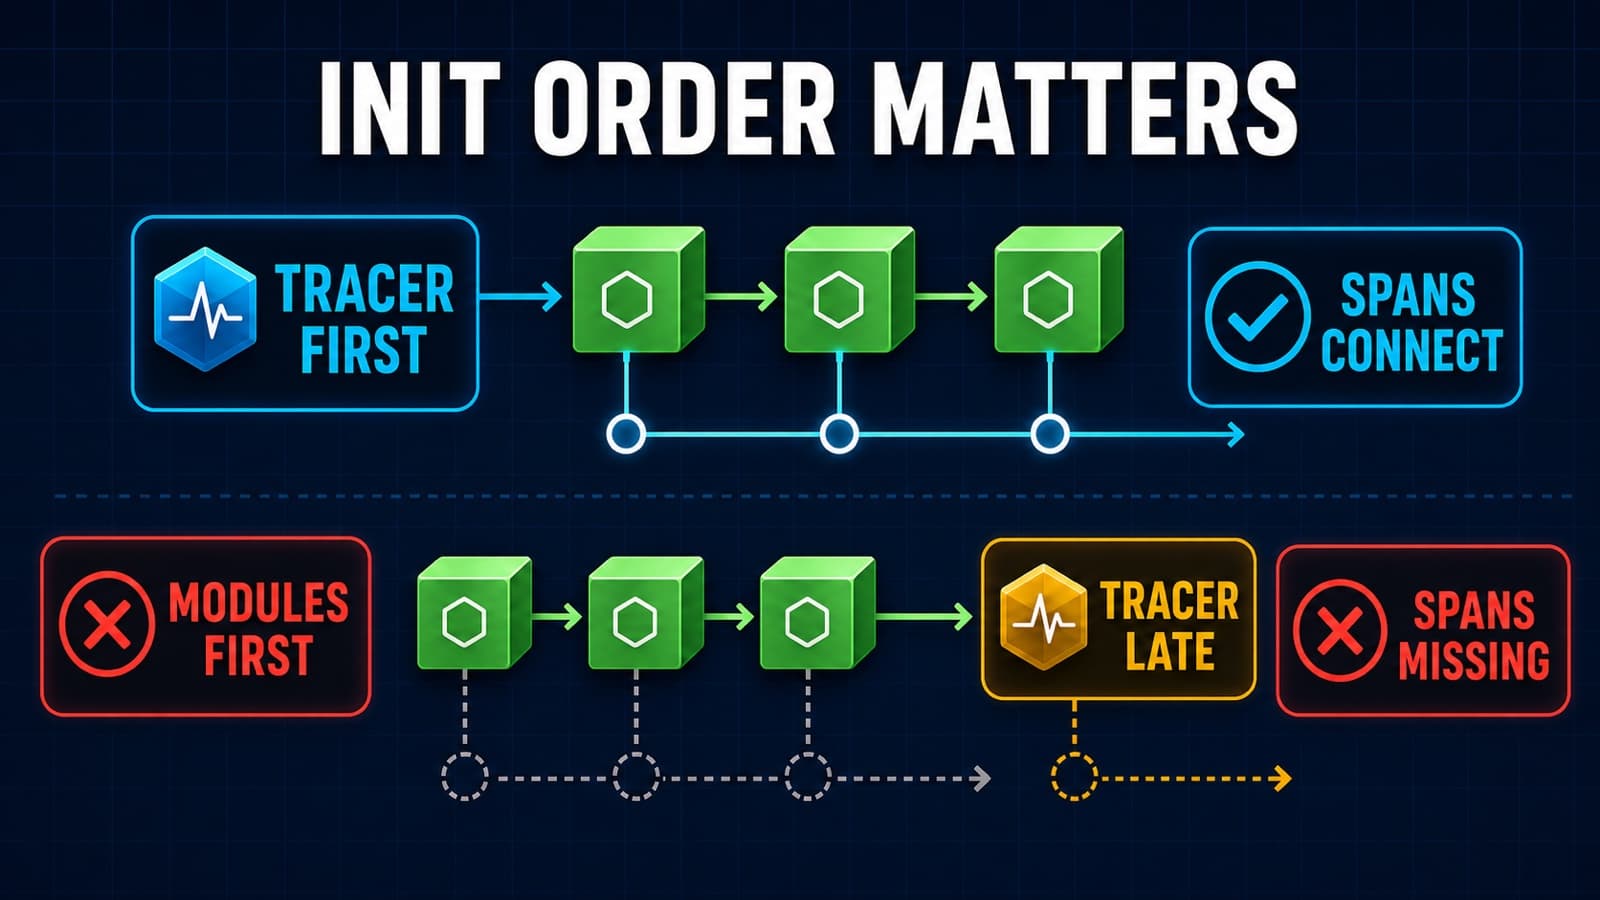
If you searched for "dd-trace init must be first import before other modules Node.js," you probably have partial traces. Requests may appear without route names. Database spans may be missing. Some spans may also look disconnected.
The short answer is simple: dd-trace must start before the modules it needs to instrument. The exact fix depends on CommonJS, ESM, TypeScript, your framework, and your bundler. Moving one import line does not solve every case.
This guide gives you the correct startup patterns and a practical verification checklist. It follows Datadog's current Node.js tracing documentation and Node.js command-line documentation.
The Quick Answer
Choose the pattern that matches your runtime:
| Runtime | Recommended startup pattern |
|---|---|
| CommonJS with environment configuration | node --require dd-trace/init app.js |
| CommonJS with programmatic configuration | node --require ./dd-trace.js app.js |
| ESM on Node.js 20.6 or newer | node --import dd-trace/initialize.mjs app.js |
| ESM before Node.js 20.6 | Add --loader dd-trace/loader-hook.mjs and initialize the tracer before application modules |
| TypeScript or another transpiler | Put initialization in a dedicated external file and load that file first |
| Bundled server code | Follow Datadog's bundler guidance and verify third-party instrumentation after building |
After changing startup order, restart the process and generate real test traffic. Do not treat a successful process start as proof.
If traces appear but their volume is lower than expected, check the Node.js DD_TRACE_SAMPLE_RATE guide after you confirm the startup order.
Why dd-trace Must Load First
The Node.js tracer uses runtime patching. It attaches instrumentation while Node.js loads supported libraries.
Consider this sequence:
- Your application loads Express, PostgreSQL, Redis, or another supported module.
- Node.js caches that loaded module.
- Your application initializes
dd-traceafterward. - The tracer cannot reliably patch work that already started.
The result can look deceptively healthy. You may still receive a root span or some outbound HTTP spans. However, route details, database queries, or connected child spans can be absent.
Datadog's current documentation identifies the same symptoms. It tells users to check initialization when traces have missing routes, missing spans, or disconnected spans.
CommonJS: Preload dd-trace Before app.js
For CommonJS, a preload flag is the clearest option. Node.js runs the preload before it runs your entry file.
node --require dd-trace/init app.js
You can put the same command in package.json:
{
  "scripts": {
    "start": "node --require dd-trace/init app.js"
  }
}
This pattern uses environment variables for tracer configuration. It avoids depending on source-file import order.
CommonJS with programmatic configuration
Use a dedicated preload file when you need configuration in code:
// dd-trace.js
require('dd-trace').init({
  service: 'checkout-api',
  env: process.env.NODE_ENV,
})
Load it before the application entry point:
node --require ./dd-trace.js app.js
Keep application imports out of dd-trace.js. The file should initialize tracing and return control to Node.js.
The fragile CommonJS pattern
This pattern is easy to break during a refactor:
const express = require('express')
const pg = require('pg')
const tracer = require('dd-trace').init()
Express and pg load before the tracer. Moving the tracer to the first line can help in plain CommonJS. A preload is usually clearer and harder to reorder accidentally.
ESM: Source Order Is Not the Whole Story
ESM changes the startup model. Static imports are linked before the module body runs. A visually first line does not provide the same guarantee as a process preload.
Datadog currently requires an additional ESM startup argument. Use the command that matches your Node.js version.
Node.js 20.6 or newer
Datadog provides a shorthand that registers the ESM hooks and initializes the tracer:
node --import dd-trace/initialize.mjs app.js
Datadog also documents the expanded form:
node --import dd-trace/register.js --require dd-trace/init app.js
The shorthand is easier to keep consistent across local development, containers, and production commands.
Node.js before 20.6
Older supported ESM runtimes use the loader hook:
node --loader dd-trace/loader-hook.mjs --require dd-trace/init app.js
Check your exact Node.js and dd-trace versions before you copy this into production. Datadog changes support across major tracer versions.
Do not trust a top-level ESM import alone
This file can look correct while still missing the required loader behavior:
import 'dd-trace/init'
import express from 'express'
Use Datadog's documented ESM startup flags. Then keep the command identical in development and production.
TypeScript, NestJS, Next.js, and Transpilers
Transpilers and frameworks can move, hoist, or wrap imports. They can also create a bootstrap path that differs from your source tree.
Datadog recommends a dedicated external initialization file for TypeScript, Webpack, Babel, and similar tools. Load that file as a whole before the built application.
Use this checklist:
- Identify the real production entry command.
- Check whether it runs TypeScript directly or runs compiled JavaScript.
- Put tracer initialization outside the application import graph.
- Apply the required ESM flag when the compiled output uses ESM.
- Confirm the final container command still includes the preload.
- Test framework routes, database calls, and outbound HTTP calls after deployment.
NestJS and Next.js add their own bootstrap behavior. Datadog's current documentation directs these frameworks to its complex framework setup. Do not assume main.ts is the first executed instrumentation point.
For a vendor-neutral NestJS path, see the NestJS tracing with OpenTelemetry guide. It explains the HTTP interceptor boundary and background work.
Bundlers Can Remove the Hook Point
dd-trace relies on module loading to instrument third-party packages. Bundlers can replace those module loads with bundled code.
This can produce a confusing result:
- built-in
httpspans still appear; - Express route details disappear;
- database client spans disappear;
- the production bundle behaves differently from local development.
Datadog documents bundler-specific requirements and an esbuild plugin. It also explains when dependencies must remain external.
Do not stop after checking the source entry point. Inspect the built artifact and run traffic through the production-style bundle.
How to Verify the Fix
Use a route that exercises several instrumented layers. A health check alone does not prove enough.
Create one test request that includes:
- an incoming Express, Fastify, NestJS, or framework route;
- one database operation;
- one outbound HTTP request;
- one controlled error path, when safe;
- stable service and environment metadata.
Then verify these results in your tracing backend:
- The server span has the expected route.
- The database operation appears as a child span.
- The outbound request appears as a child span.
- The spans share one trace instead of separate traces.
- The service name and environment match the running process.
- The same result appears from the built production command.
If only the root span appears, inspect module order again. If local traces work but production traces fail, inspect the container command and bundler settings.
Common Failure Patterns
| Symptom | Likely cause | First check |
|---|---|---|
| Requests appear without route names | Framework loaded before tracer patching | Confirm the process preload runs first |
| Database spans are absent | Database client loaded too early or bundled | Check import order and bundler externals |
| ESM app has partial traces | Required ESM hook is missing | Add the version-appropriate --import or --loader flag |
| Local works, container fails | Production start command dropped the preload | Inspect CMD, ENTRYPOINT, and process manager configuration |
| TypeScript source looks correct, output fails | The transpiler changed module order | Use a dedicated external preload file |
| NestJS traces start late | Framework bootstrap ran before tracer setup | Follow Datadog's complex framework guidance |
The Same Startup Rule Applies Beyond dd-trace
The broader lesson is not specific to Datadog. Auto-instrumentation must register before the libraries it observes.
OpenTelemetry's Node.js getting-started guide uses a separate instrumentation file for this reason. It starts the SDK before the application entry point.
Tracekit's current Node.js integration guide gives the same practical instruction. Initialize Tracekit before importing database and HTTP client libraries that need automatic instrumentation.
const tracekit = require('@tracekit/node-apm')

const client = tracekit.init({
  apiKey: process.env.TRACEKIT_API_KEY,
  serviceName: 'checkout-api',
})

const express = require('express')
const pg = require('pg')
Tracekit connects these traces with alerts, releases, errors, and dynamic logs. When a trace finds the suspicious path, a capture point can collect runtime state without another redeploy.
Keep normal application logs in your logger. Use dynamic logs for bounded runtime state that you did not predict before the incident.
For a wider Node.js production checklist, read Node.js performance monitoring for production apps. You can also use the OpenTelemetry config generator for an OTLP-first setup.
Final dd-trace Init Order Checklist
- The tracer starts before instrumented modules.
- CommonJS uses a
--requirepreload. - ESM uses the correct flag for the Node.js version.
- TypeScript or transpiled builds use a dedicated initialization file.
- The production start command matches the tested command.
- Bundled builds preserve the required instrumentation hooks.
- Test traffic includes a route, database call, and outbound request.
- Route names and child spans appear in one connected trace.
The important result is not that dd-trace starts without errors. The important result is a complete trace from the real production command.
Related Posts
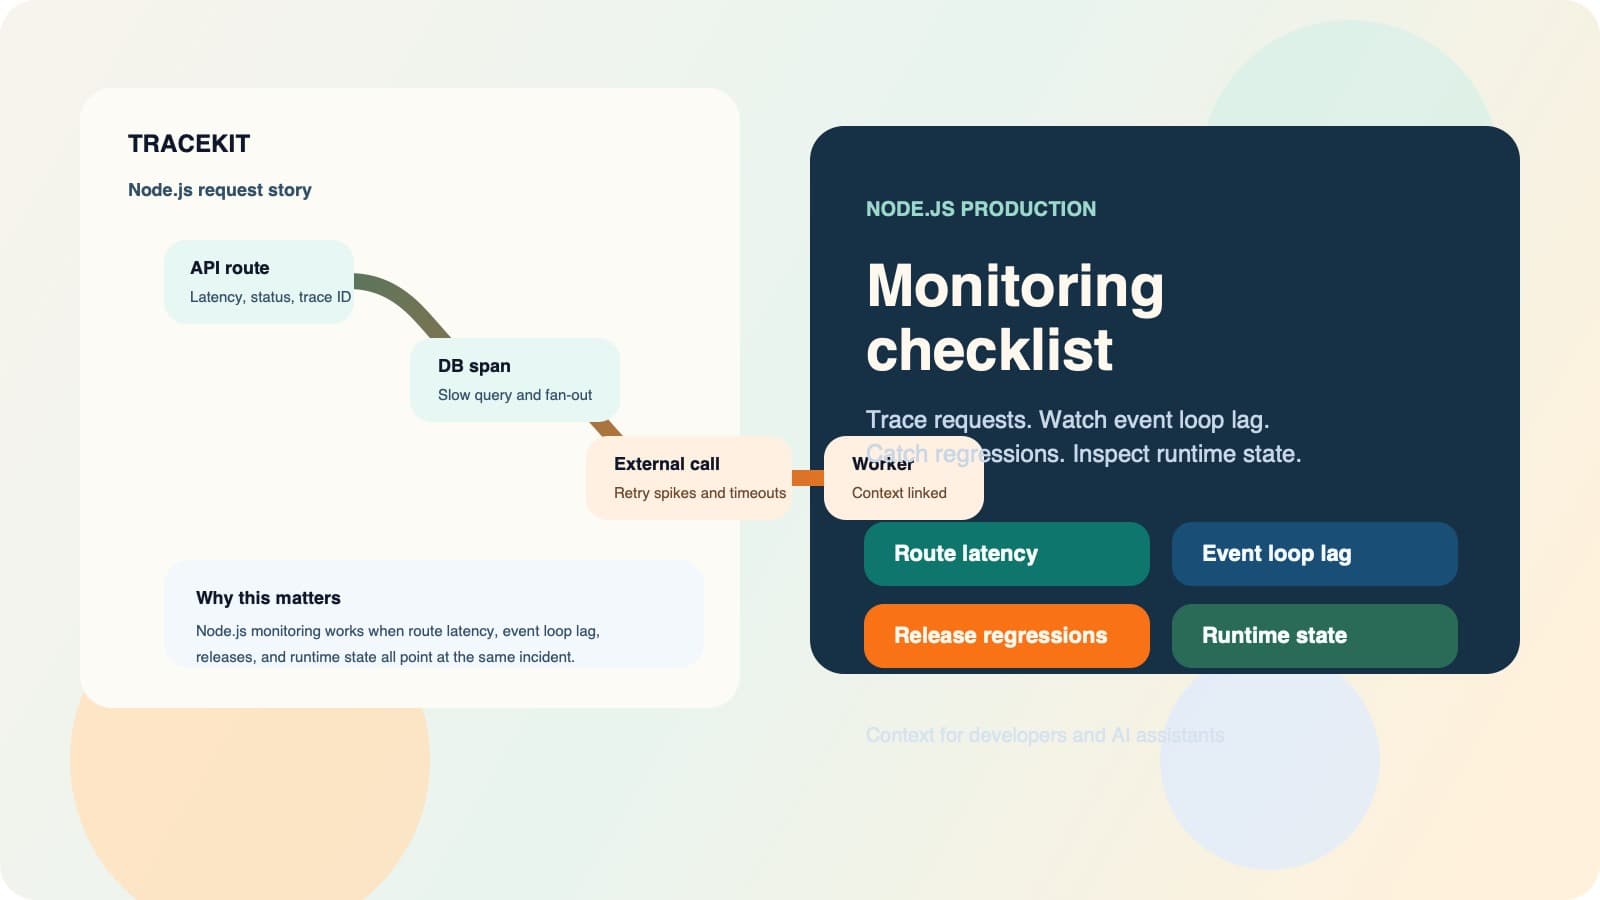
Node.js Application Performance Monitoring Guide
Use Node.js application performance monitoring to connect request traces, event loop health, dependencies, releases, and runtime state.
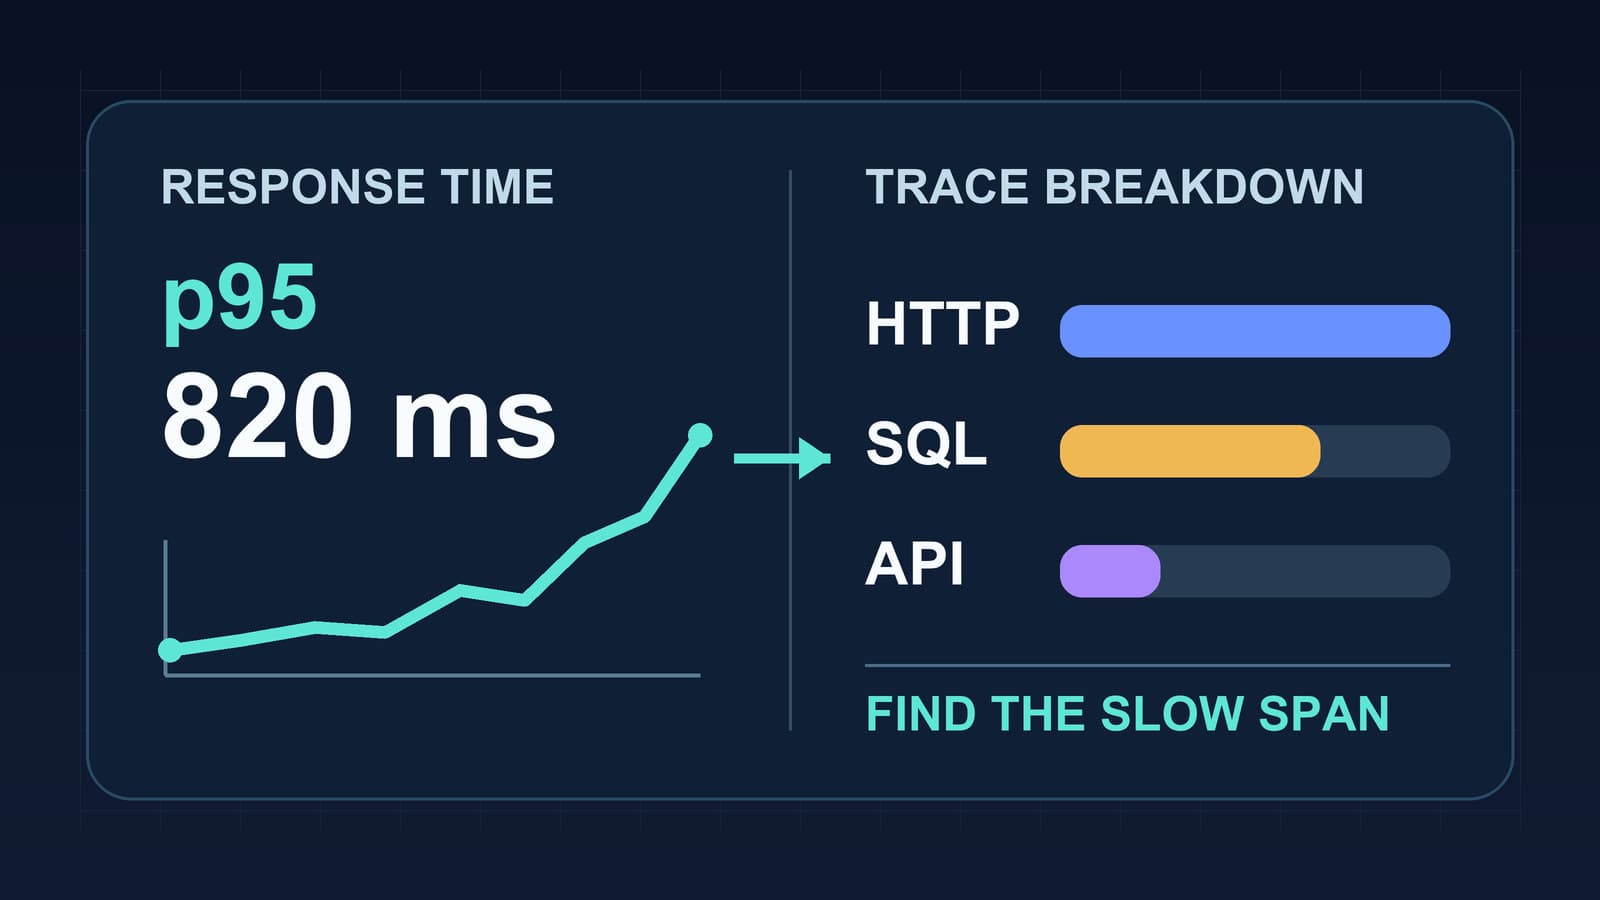
Node.js Response Time Monitoring by Route
Measure Node.js response time by route, read p95 latency with traces, and separate event loop delays from database and API waits.
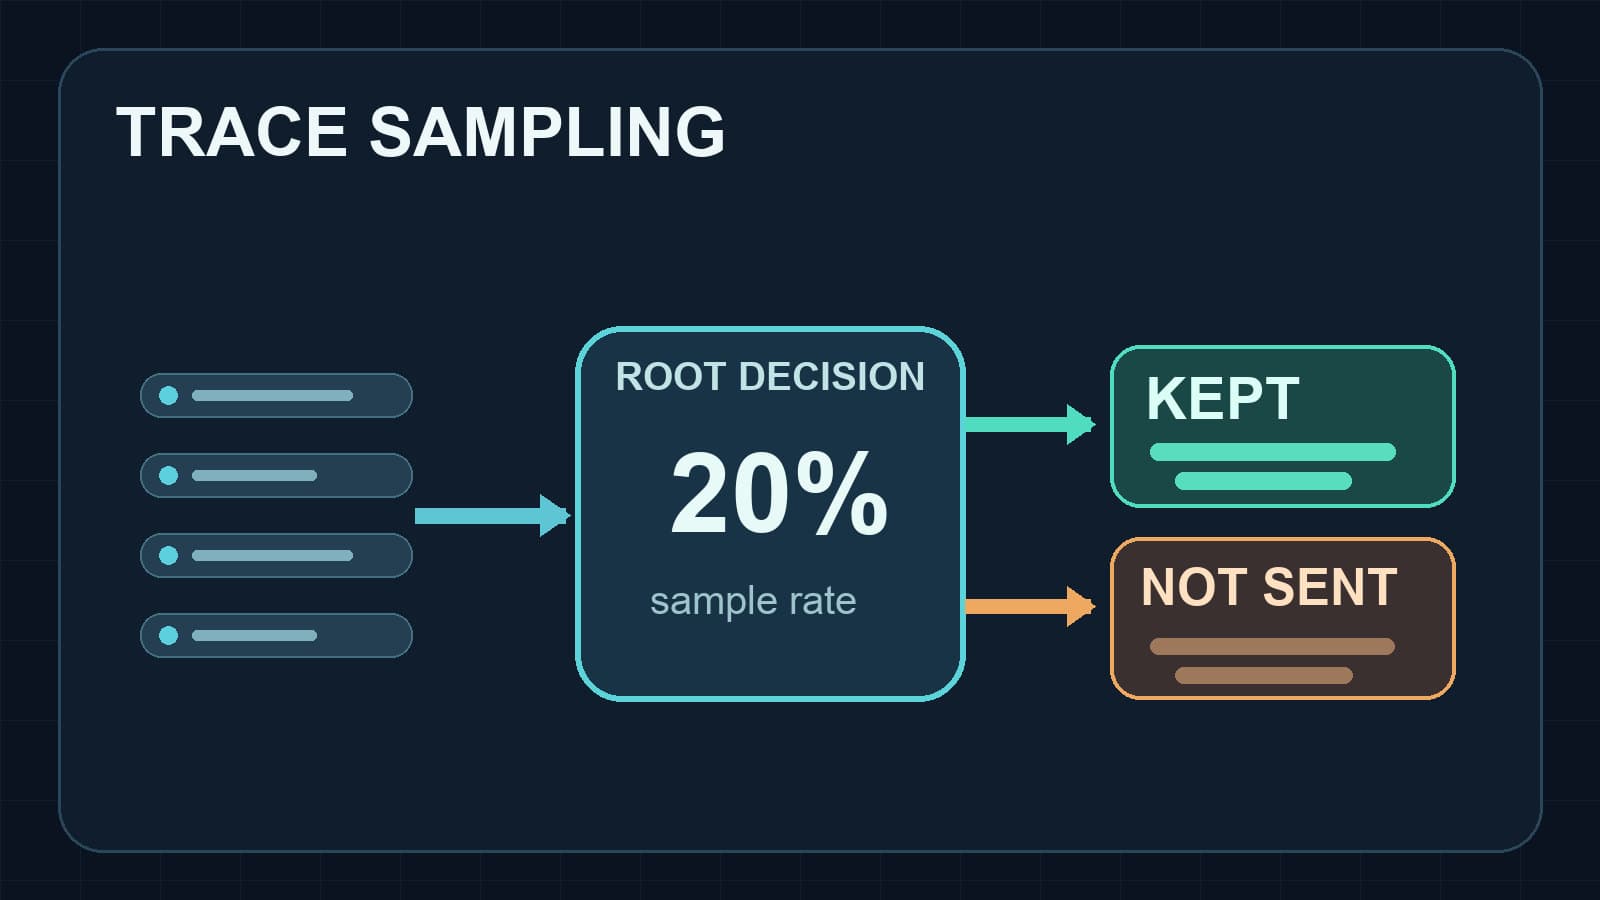
DD_TRACE_SAMPLE_RATE in Node.js: A Practical Guide
Set DD_TRACE_SAMPLE_RATE in Node.js, understand rate limits and sampling rules, and verify which distributed traces reach Datadog.