
Best APM Tools for 2026: What to Compare Before You Commit
Compare the best APM tools for 2026 by debugging workflow, OpenTelemetry fit, pricing model, and runtime-state visibility.
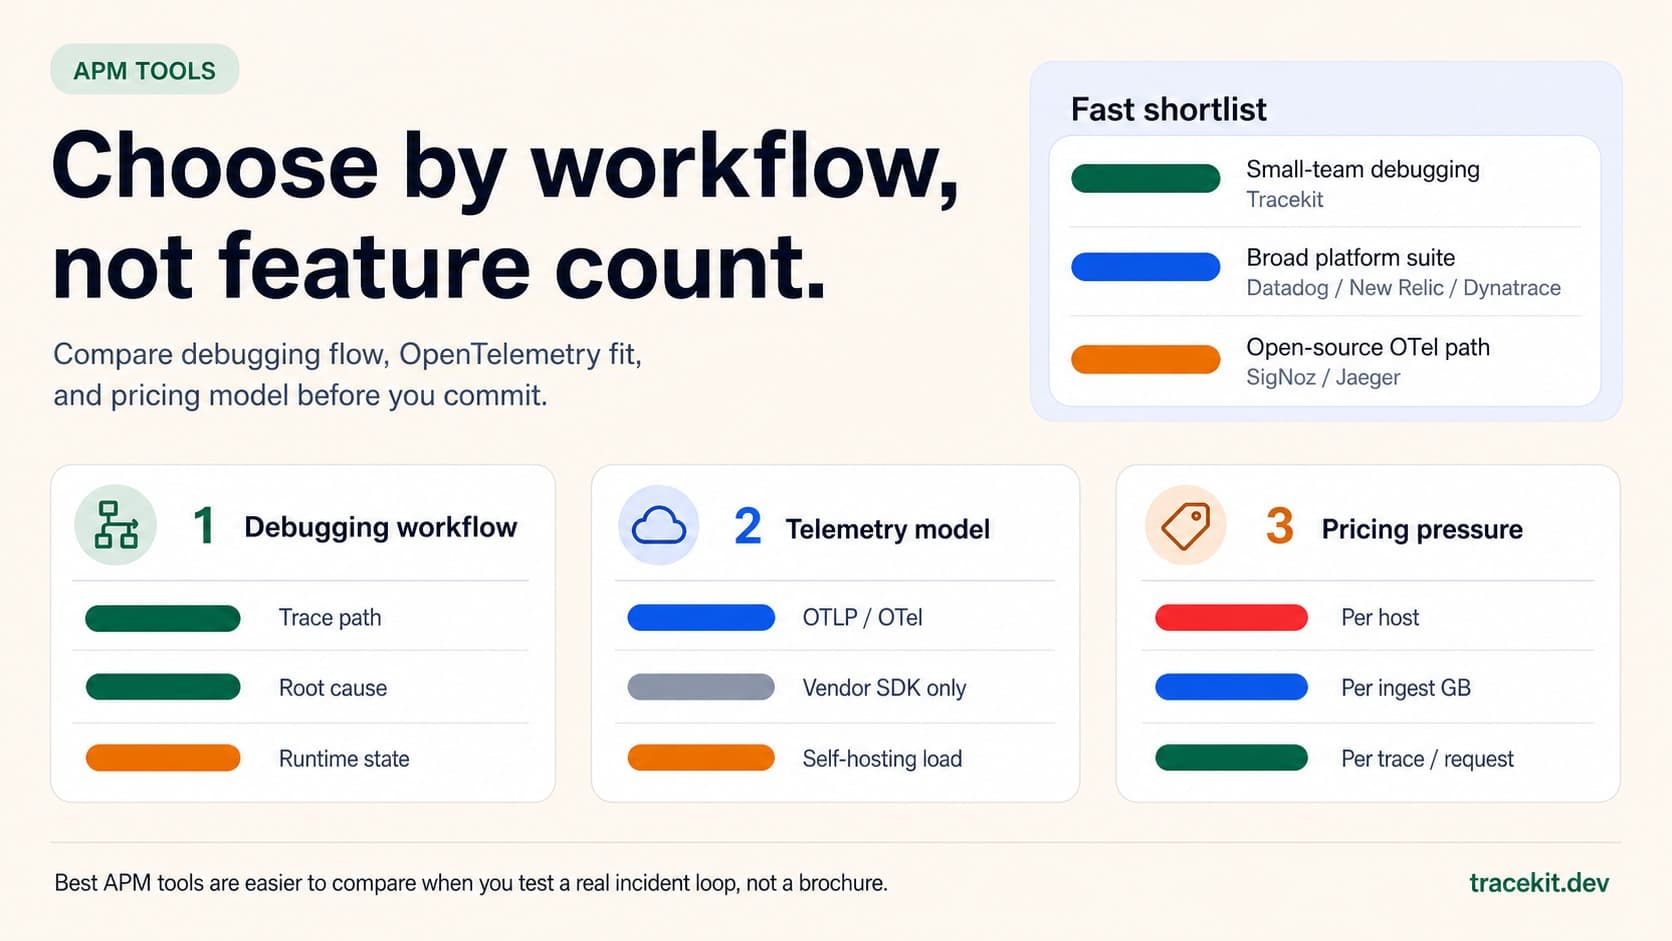
If you are searching for the best APM tools, the real question usually is not "which dashboard has the most tabs?" It is "which tool will actually help my team explain a production incident faster, with the least operational drag and the fewest pricing surprises?" That is a narrower and more useful buying question.
This guide targets the search intent behind best apm tools and apm tools: how to compare modern application performance monitoring options by debugging workflow, OpenTelemetry fit, pricing model, and runtime-state visibility. It is grounded in Tracekit's current distributed tracing, dynamic logs docs, pricing page, tool comparison index, and the current product-state reference. For the broader tool landscape, it also lines up with the current official product pages for Datadog APM pricing, New Relic pricing, Dynatrace pricing, Honeycomb pricing, SigNoz, and Jaeger APIs, plus the official OpenTelemetry traces concept docs.
The Best APM Tool Depends on the Incident Workflow You Need
APM tools are not all solving the same day-two problem.
Some are broad observability suites that combine infrastructure, logs, traces, security, and digital experience in one large platform. Others are trace-first debugging tools. Others are open-source tracing backends that give you a waterfall but leave more assembly to your team.
Before you compare vendors, decide which of these jobs matters most:
- Seeing the full request path across services, queues, and databases
- Finding the exact route, query, or dependency that consumed the latency budget
- Explaining runtime state on the suspicious code path without another redeploy
- Keeping pricing predictable as traffic, hosts, or telemetry volume grow
- Avoiding a large self-hosted observability stack if your team is small
If your team skips that framing, every tool starts to look like a list of spans, alerts, and checkboxes.
What to Compare First
The fastest way to eliminate the wrong tools is to compare these five areas first:
| Area | What to ask | Why it matters |
|---|---|---|
| Debugging workflow | Can I move from a slow request to the missing context quickly? | APM value is in incident response speed, not screenshot aesthetics |
| OpenTelemetry fit | Does it work cleanly with OTLP and standard instrumentation? | OTel keeps migration and instrumentation choices flexible |
| Pricing unit | Am I paying by host, ingest, event volume, or trace volume? | Cost surprises often come from the billing unit, not the list price |
| Operational burden | Is this managed, self-hosted, or partially self-assembled? | Small teams often underestimate the cost of owning the stack |
| Runtime-state visibility | Can I inspect the code path after the trace points at it? | Traces show where time went; they do not always explain branch decisions |
That last point is where many comparisons stay too shallow. Plenty of products can show a trace waterfall. Fewer help you inspect the runtime state that made one request fail while another succeeded.
Best APM Tools for 2026: Quick Fit Guide
This is the short version if you need a first pass:
| Tool | Best fit | Why teams choose it | Watch out for |
|---|---|---|---|
| Tracekit | Small teams that want faster production debugging | OpenTelemetry-native traces, dynamic logs, releases, alerts, and request-based pricing | Not positioned as a full infrastructure monitoring suite |
| Datadog | Larger teams that want a broad commercial observability platform | Huge integration surface and mature multi-product platform | Host-based and add-on pricing can get expensive fast |
| New Relic | Teams that want a large managed platform with usage-based entry | Free tier and broad platform coverage | Budgeting still depends on ingest and plan shape |
| Dynatrace | Enterprises that want deep automation and broad platform scope | Full-stack observability, topology, and enterprise workflow depth | More platform than many small teams need |
| Honeycomb | Teams that live in high-cardinality trace and event analysis | Strong exploratory workflow and event-based model | Better fit for query-heavy observability cultures than generic buyer checklists |
| SigNoz | Teams that want an OpenTelemetry-native open-source path | Cloud or self-hosted, logs/metrics/traces together | You still own more setup and operations than with a tightly managed tool |
| Jaeger | Teams that need a trace backend more than a full APM product | Widely known open-source tracing backend | Not a complete APM workflow by itself |
1. Tracekit
Tracekit is the better fit when your team cares most about production debugging speed rather than owning the biggest observability bundle.
The current product truth is clear:
- distributed tracing is a core surface
- dynamic logs are the user-facing runtime-state workflow
- the platform connects traces, alerts, releases, session replay, and AI-assisted investigation
- the public pricing page says the free tier includes
200K traces/month, and paid plans start at$29/month
That makes Tracekit a strong fit for teams that want to:
- keep OpenTelemetry compatibility
- avoid host-based APM pricing
- inspect runtime state after a trace identifies the suspicious path
- get from "the request is slow" to "this code path made the wrong decision"
The product boundary matters too: Tracekit should not be positioned as a generic log-ingestion clone or a complete infrastructure-monitoring replacement for every buyer. It is strongest when the problem is application debugging, runtime evidence, and faster incident resolution.
If that is your workflow, start with distributed tracing, dynamic logs, and the broader comparison index.
2. Datadog
Datadog is still one of the default answers when teams want a large commercial observability suite with broad ecosystem coverage.
Why teams choose it:
- broad platform across APM, logs, infrastructure, security, and more
- mature integrations and operational coverage
- strong fit for organizations already standardized on Datadog across several teams
The tradeoff is cost structure and scope. Datadog's own APM billing docs currently list APM pricing per underlying APM host, which is exactly the kind of billing model that can punish horizontally scaled systems or container-heavy environments.
Datadog is often the right answer when you truly want the broader platform. It is less obviously the right answer when your main pain is simply "we need to debug application incidents faster without buying the whole enterprise bundle."
For a narrower Tracekit-specific comparison, use Tracekit vs Datadog.
3. New Relic
New Relic is a good fit for teams that want a large managed platform with a lower-friction starting point than classic host-based pricing.
Why teams choose it:
- broad observability platform
- current pricing page publicly includes a free tier with
100 GB/monthof ingest - strong commercial platform footprint across APM and related products
The tradeoff is that "usage-based" does not automatically mean "predictable." You still need to understand what drives ingest, which users need full access, and how your spend changes when adoption expands.
New Relic is usually a sensible shortlist candidate if your team wants a large SaaS platform but does not want to start with host-based APM billing.
4. Dynatrace
Dynatrace fits enterprises that want very broad application observability and are willing to buy into a larger platform model.
Why teams choose it:
- strong application observability positioning
- automatic topology and dependency mapping
- enterprise workflow depth
The tradeoff is usually not capability. It is fit. Dynatrace can be a lot of platform for a small engineering team whose real requirement is "show me the slow request, the failing downstream dependency, and the runtime state that explains the bug."
Dynatrace's current pricing pages are public, but they also reinforce the platform point: this is a large commercial offering with multiple pricing dimensions, not a minimalist debugging workflow.
5. Honeycomb
Honeycomb is a strong option for teams that think in terms of exploratory analysis, high-cardinality events, and deep production investigation.
Why teams choose it:
- strong observability workflow for asking new questions against production telemetry
- public pricing built around ingest volume rather than host count
- good fit for OpenTelemetry-native teams that care about rich event and trace analysis
The tradeoff is fit for the buyer, not product quality. Teams that want a more guided "APM dashboard plus obvious path" experience may prefer another tool. Teams that already work comfortably with richer trace and event exploration often find Honeycomb more compelling.
6. SigNoz
SigNoz is one of the clearest open-source-oriented answers for teams that want logs, metrics, and traces together in an OpenTelemetry-native stack.
Why teams choose it:
- open-source positioning
- OpenTelemetry-native workflow
- self-hosted or cloud path
The tradeoff is operational ownership. Even when the product surface is strong, self-hosting or assembling more of the deployment, upgrades, and day-two operations is still work. That can be the right trade. It is just not free.
If you are evaluating Tracekit against that path specifically, the focused version is Tracekit vs SigNoz plus the SigNoz Laravel guide.
7. Jaeger
Jaeger is still relevant, but it is important to compare it honestly.
Jaeger is best understood as a trace backend and trace-inspection workflow, not as the full answer to every APM requirement. The official Jaeger docs make the API and ingestion model clear, and the project remains useful when you want open-source tracing infrastructure and know what additional tooling you will own around it.
That means Jaeger can be the right choice when:
- you explicitly want an open-source trace backend
- your team is comfortable composing the rest of the workflow around it
- you do not need a more opinionated managed debugging path
It is a weaker fit when the buyer thinks they are selecting a full APM workflow but is actually only buying the trace-storage layer.
The Most Common Buying Mistake
The most common APM buying mistake is comparing tools by feature count instead of by incident loop.
A better comparison question is:
- How fast can we find the bad request?
- How fast can we isolate the slow dependency, query, or fan-out?
- How fast can we explain the runtime condition that caused the bug?
- How much operational or pricing drag do we accept for that workflow?
If you run that test honestly, the shortlist usually gets much smaller.
What Small Teams Should Prioritize
Small teams usually benefit most from these traits:
- OpenTelemetry compatibility, so instrumentation does not lock you in
- predictable pricing, so growth does not force "observability budget triage"
- fast trace search and readable waterfalls
- a way to inspect runtime state after the trace points to the suspicious code path
- low operational burden
That is why a smaller team can rationally choose Tracekit over a broader suite. Not because the other products are weak, but because the buyer's real problem is debugging speed, not platform sprawl.
How to Choose in Practice
Use this rubric:
| If your team needs... | Start here |
|---|---|
| Broad enterprise observability across many product areas | Datadog, New Relic, or Dynatrace |
| Open-source or self-hosted OpenTelemetry-native stack | SigNoz or Jaeger-based paths |
| Exploratory high-cardinality telemetry workflow | Honeycomb |
| Fast application debugging with traces plus runtime-state capture | Tracekit |
Then verify the decision with one real exercise:
- Instrument one important service
- Generate one realistic failure or slowdown
- Trace the request end to end
- Try to explain the incident from the product alone
- Compare cost and operator effort after that test, not before it
That gives you a more truthful answer than any feature matrix by itself.
Final Checklist for the Best APM Tools
Before you commit to a platform, make sure you can answer:
- Does it support the way your team already instruments services?
- Can it show the full request path across HTTP, database, queue, and external calls?
- Can it help you inspect runtime state when the trace alone is not enough?
- Is the pricing model aligned with how your system actually scales?
- Are you buying a managed workflow, or are you also buying operational ownership?
Those are the questions that separate a useful APM tool from an expensive telemetry archive.
If you want the shortest Tracekit path, start with distributed tracing, the free OTel config generator, dynamic logs, and the broader tool comparison index.
Related Posts
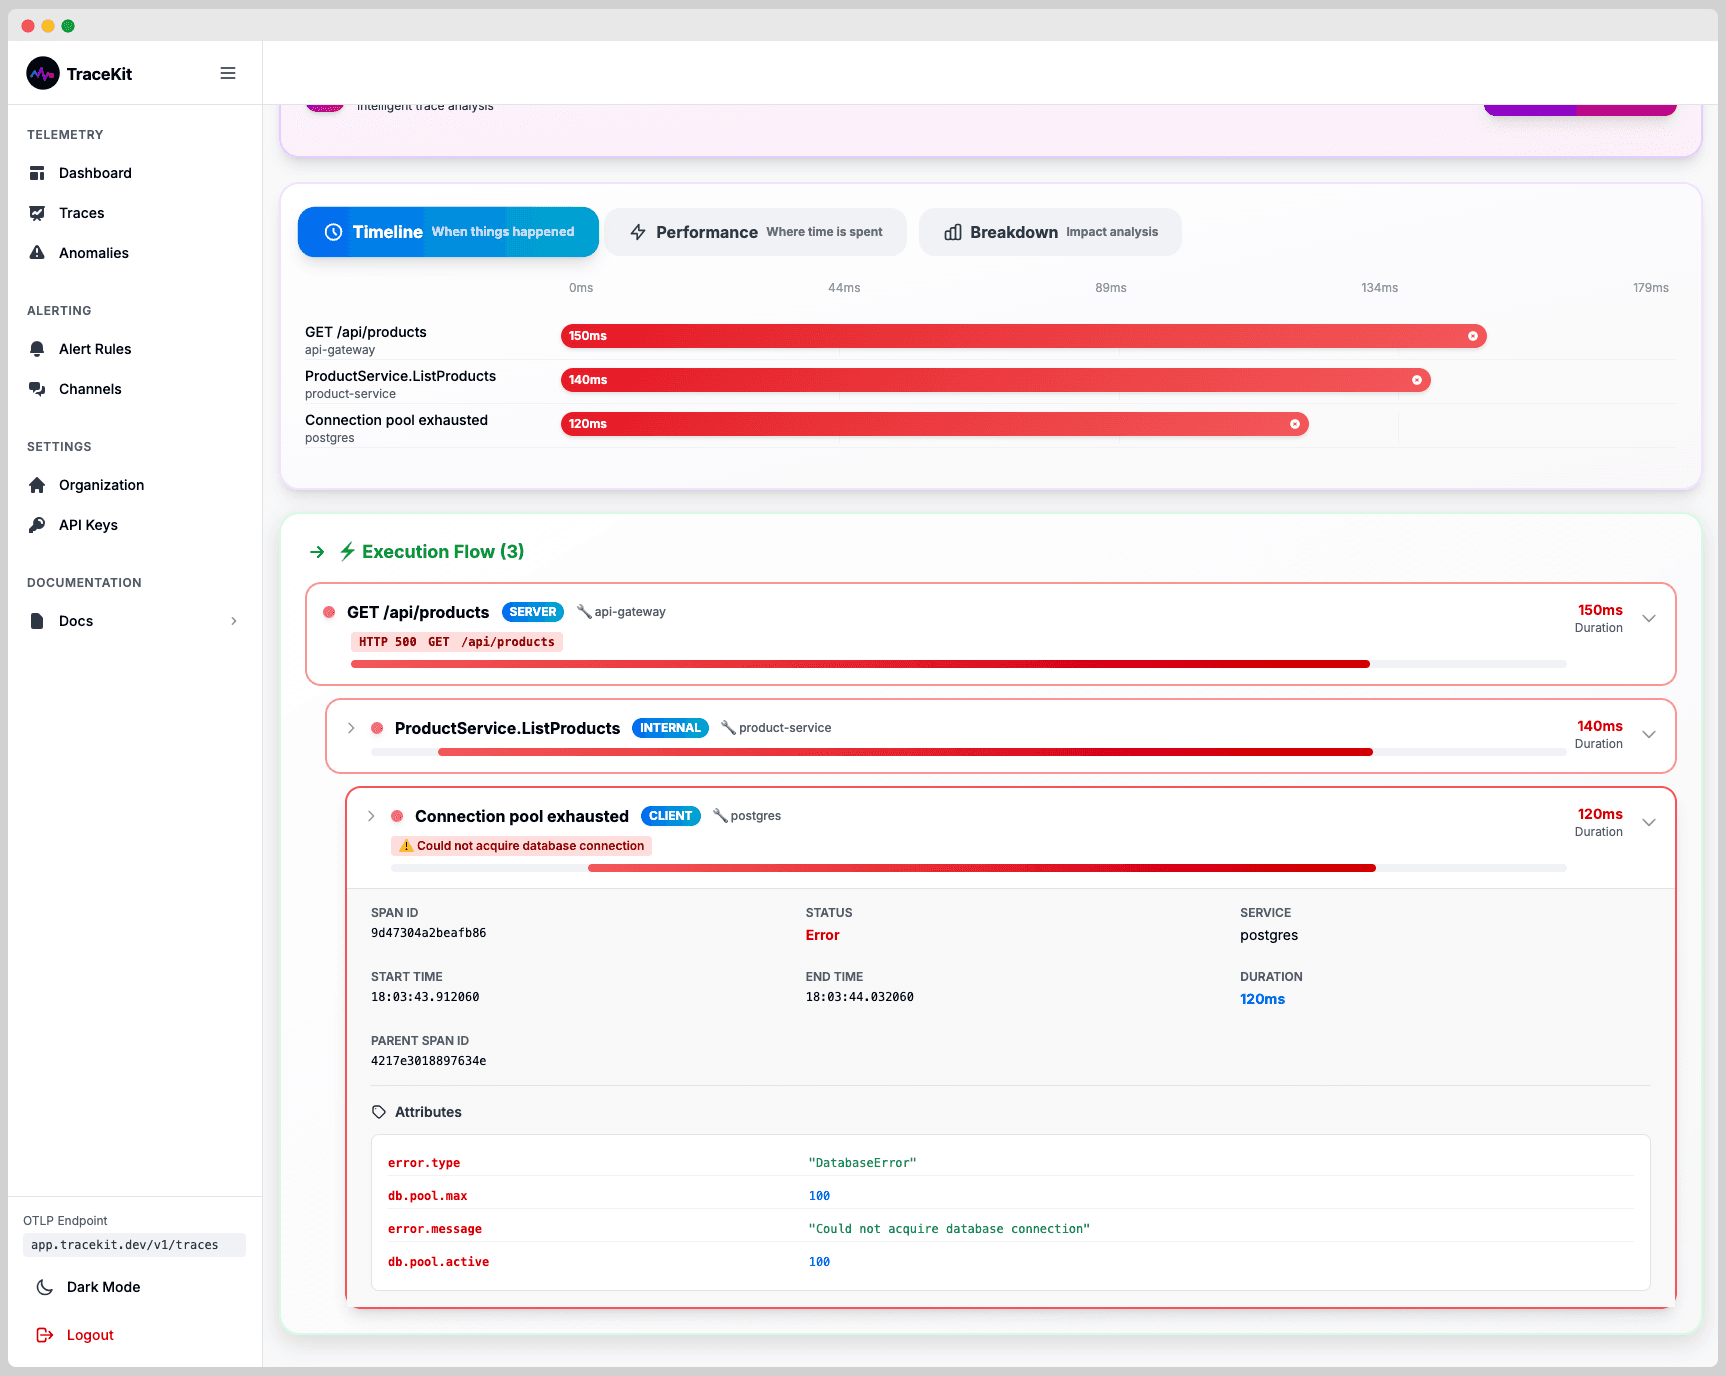
Your API Just Threw a 500. Here's How to Actually Fix It.
Your API threw a 500 at 3 AM. A systematic approach to diagnose, trace, and fix production API errors without the panic and guesswork.
OpenTelemetry Implementation Guide: Step-by-Step Setup (2026)
Complete OpenTelemetry setup guide. Install the SDK, configure exporters, and ship your first traces in under 5 minutes. Covers Node.js, Python, Go, and Java.
Observability Definition: Complete Guide for 2026
What is observability? Complete guide covering the three pillars (metrics, logs, traces), implementation strategies, and tools for modern software systems.