

9 min
Message Latency Tracking in Microservices
Instrument message latency tracking in microservices with OpenTelemetry spans, queue-age metrics, trace context, percentiles, and practical alert rules.
microservicesmessage-queues
Instrument message latency tracking in microservices with OpenTelemetry spans, queue-age metrics, trace context, percentiles, and practical alert rules.

Use distributed tracing for root cause analysis. Track requests across microservices with trace IDs and spans to pinpoint bottlenecks and failures.

Improve service dependency mapping accuracy by finding missing trace edges, stale services, broken context, and fragmented monitoring data.

Explore five innovative ways to debug production applications in real-time without redeploying, ensuring smooth user experiences.
Go observability for production: OpenTelemetry setup for Gin, Echo, gRPC, and GORM. Distributed tracing, metrics, and monitoring for Go services.
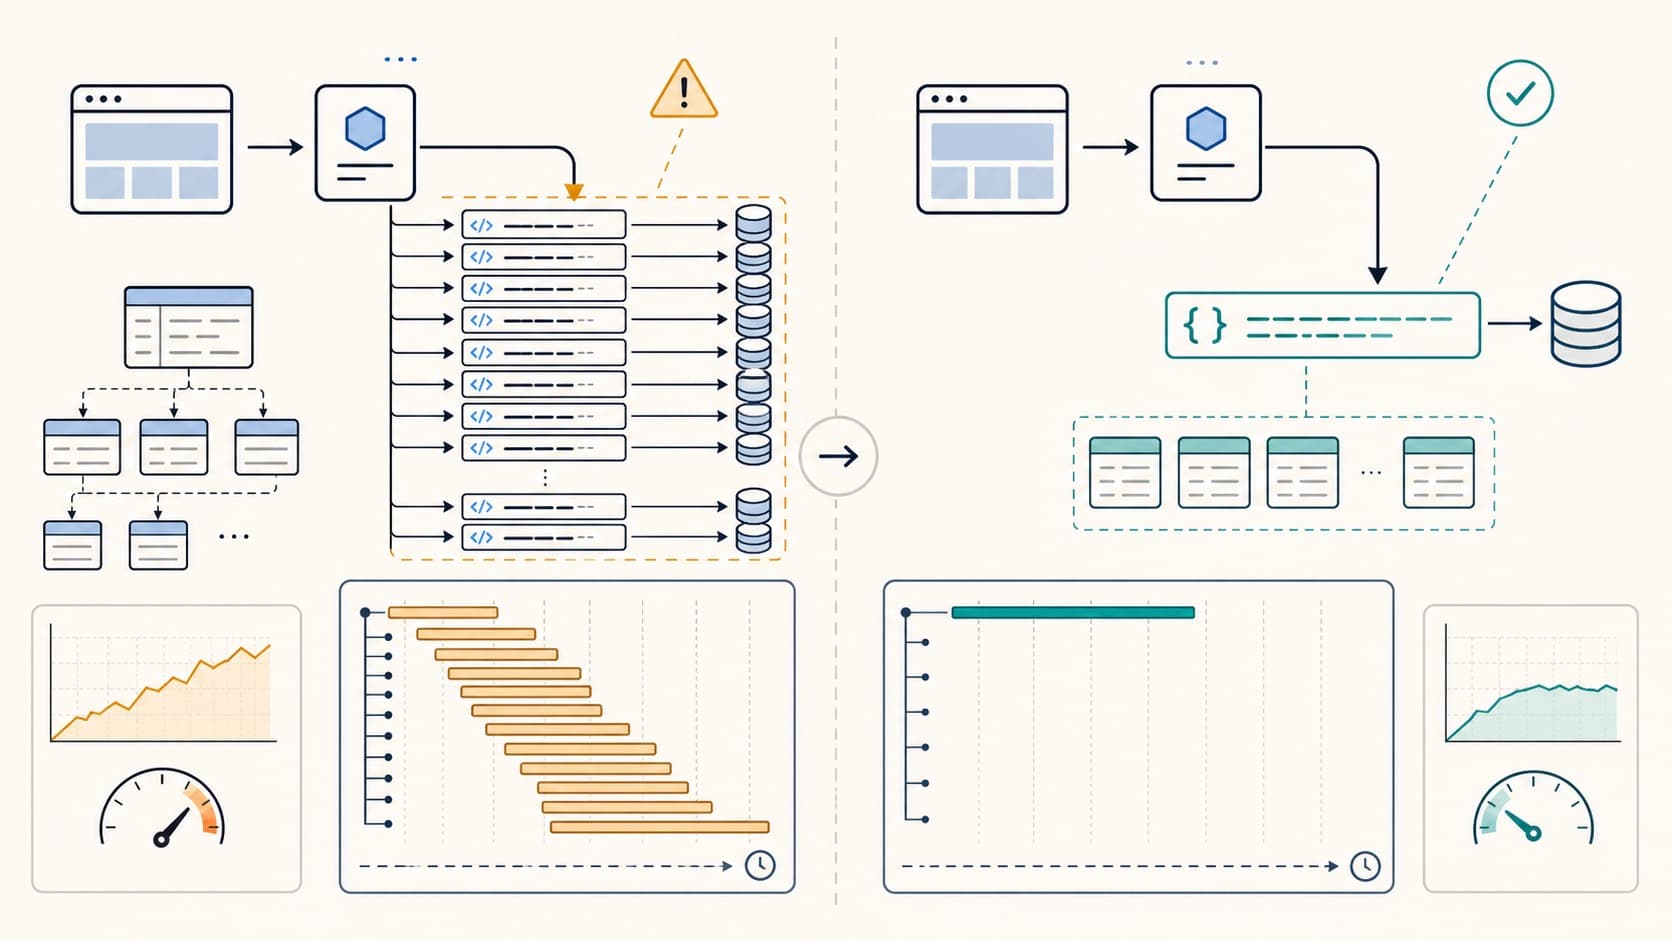
Detect N+1 queries with query counts and traces. Find repeated database calls, fix ORM loading, and verify the result in production.
Complete OpenTelemetry setup guide. Install the SDK, configure exporters, and ship your first traces in under 5 minutes. Covers Node.js, Python, Go, and Java.
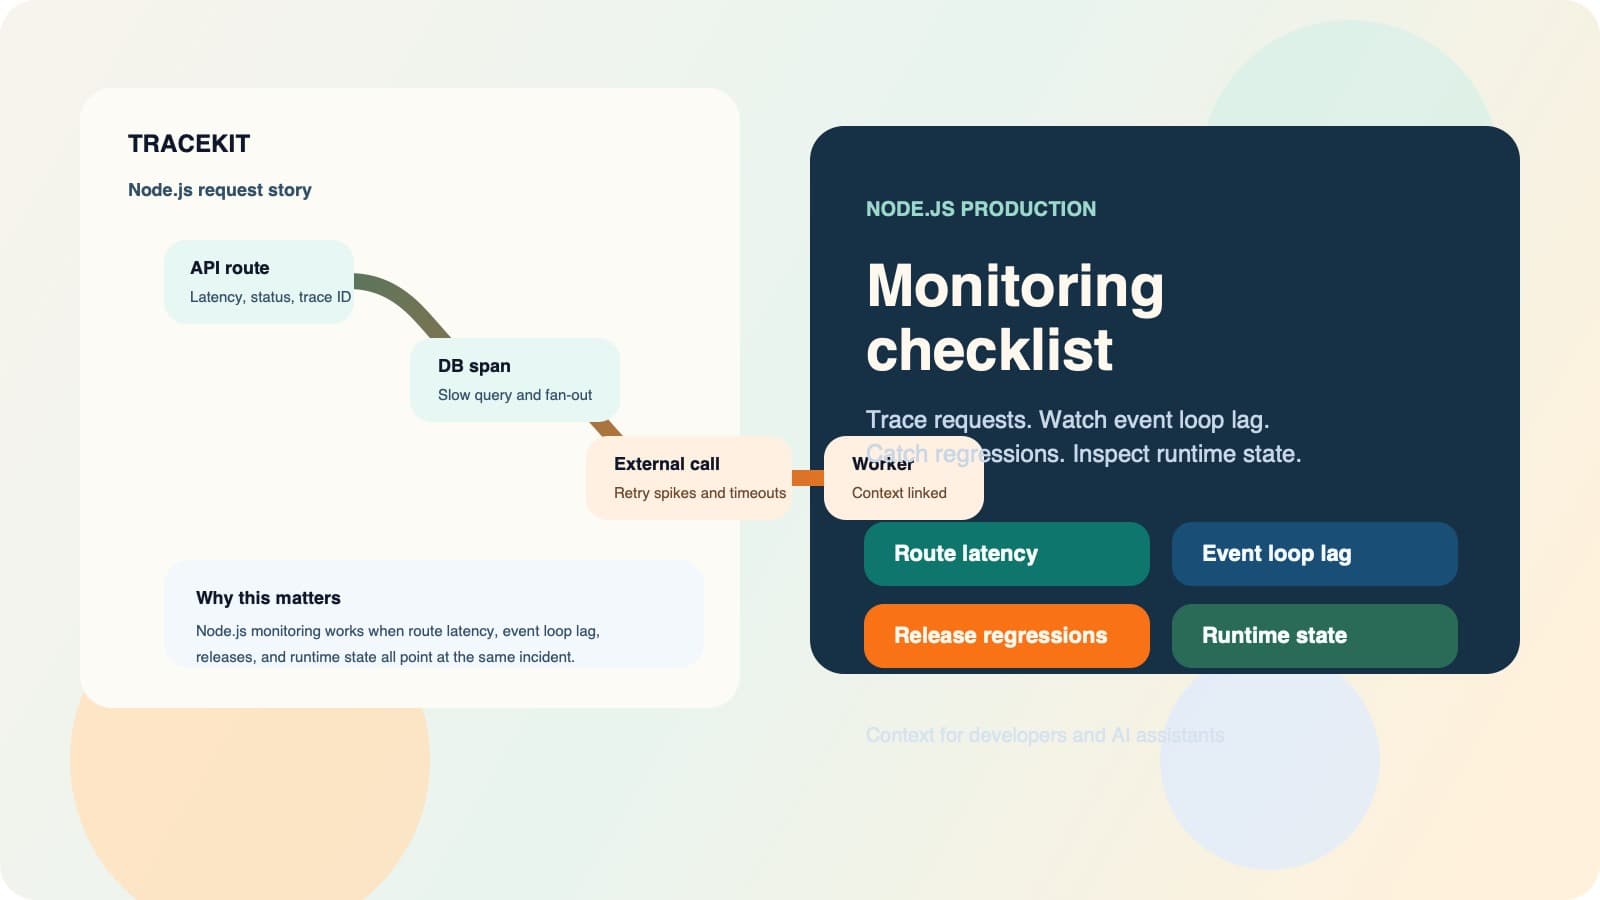
Use Node.js application performance monitoring to connect request traces, event loop health, dependencies, releases, and runtime state.
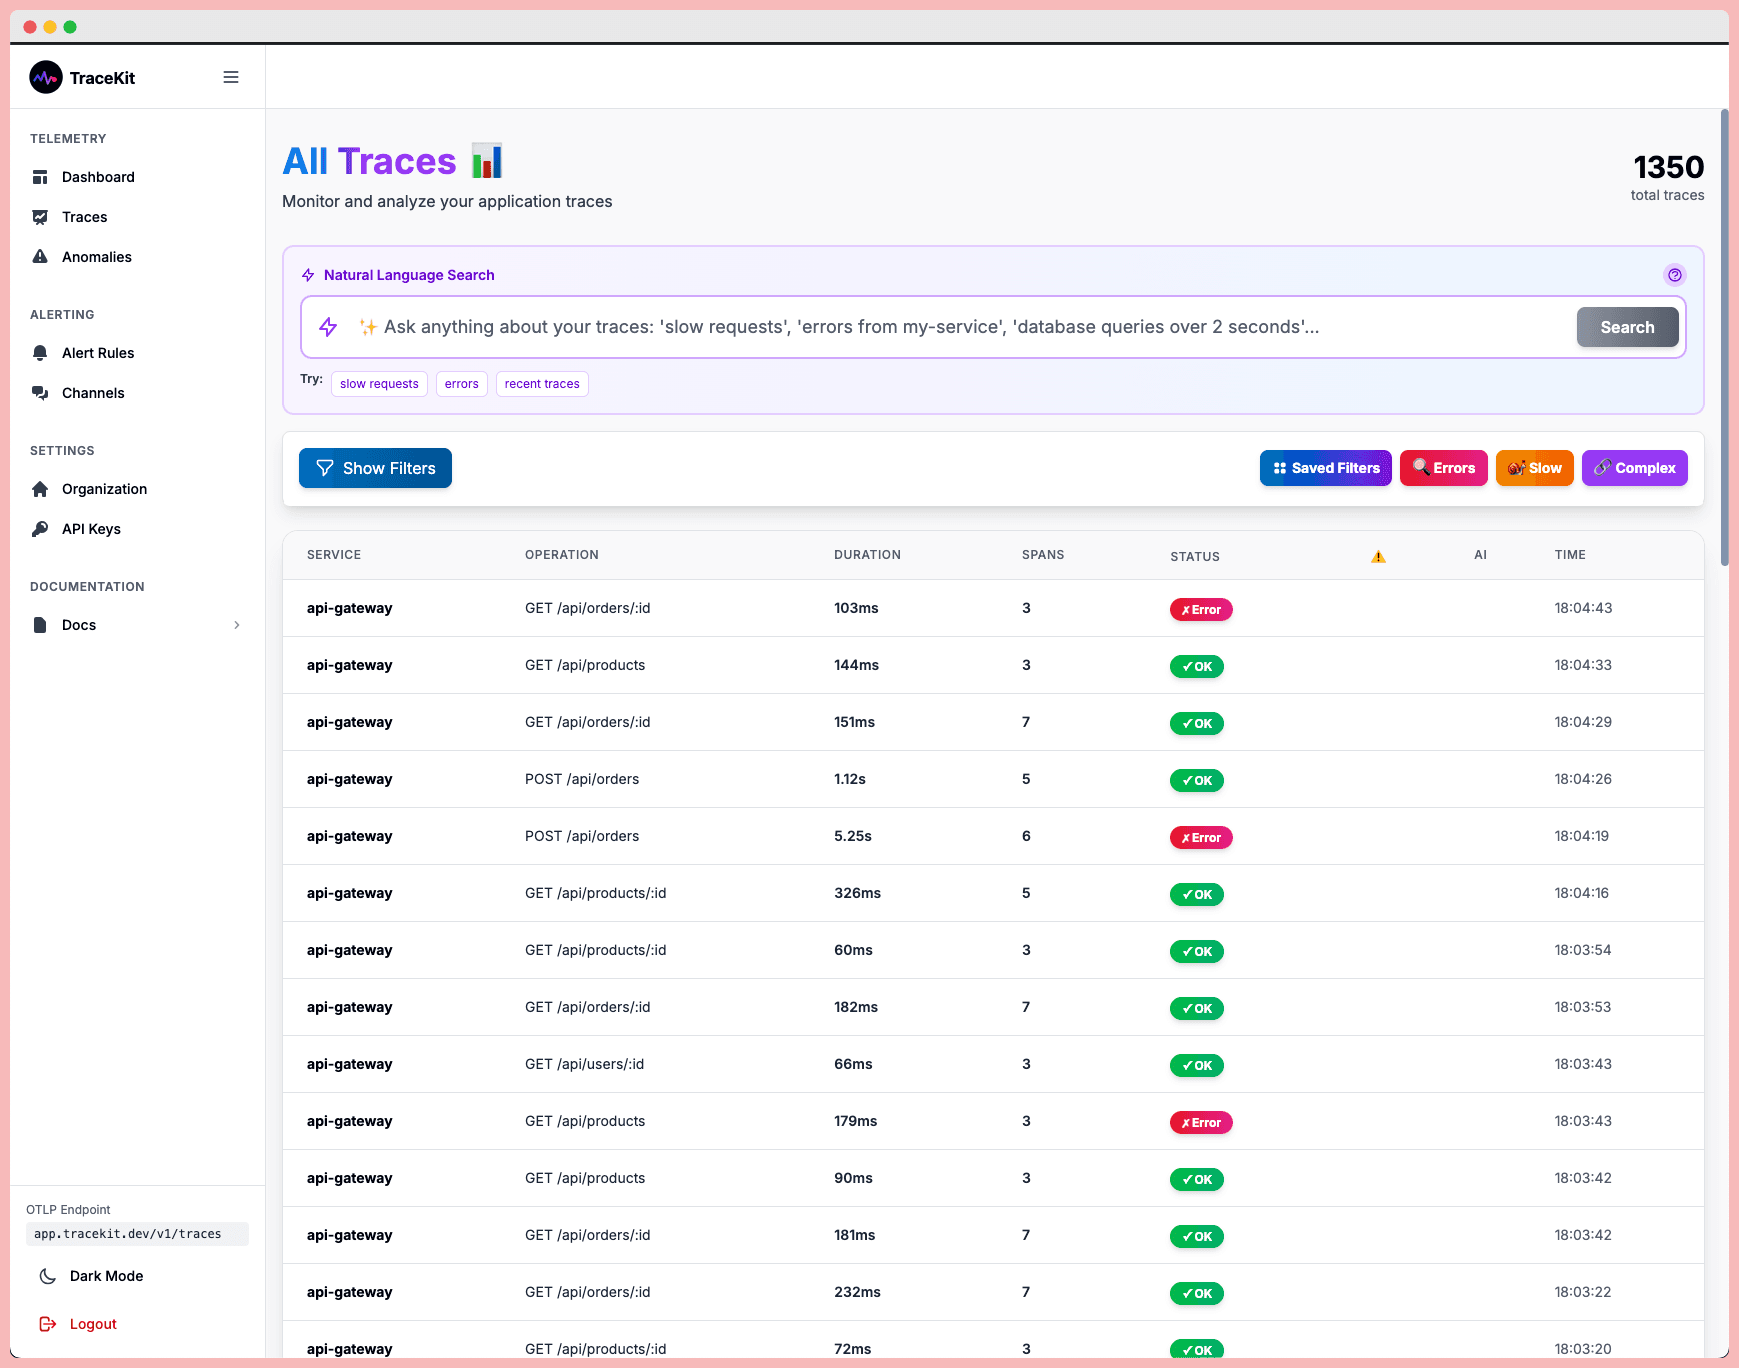
What is observability? Complete guide covering the three pillars (metrics, logs, traces), implementation strategies, and tools for modern software systems.
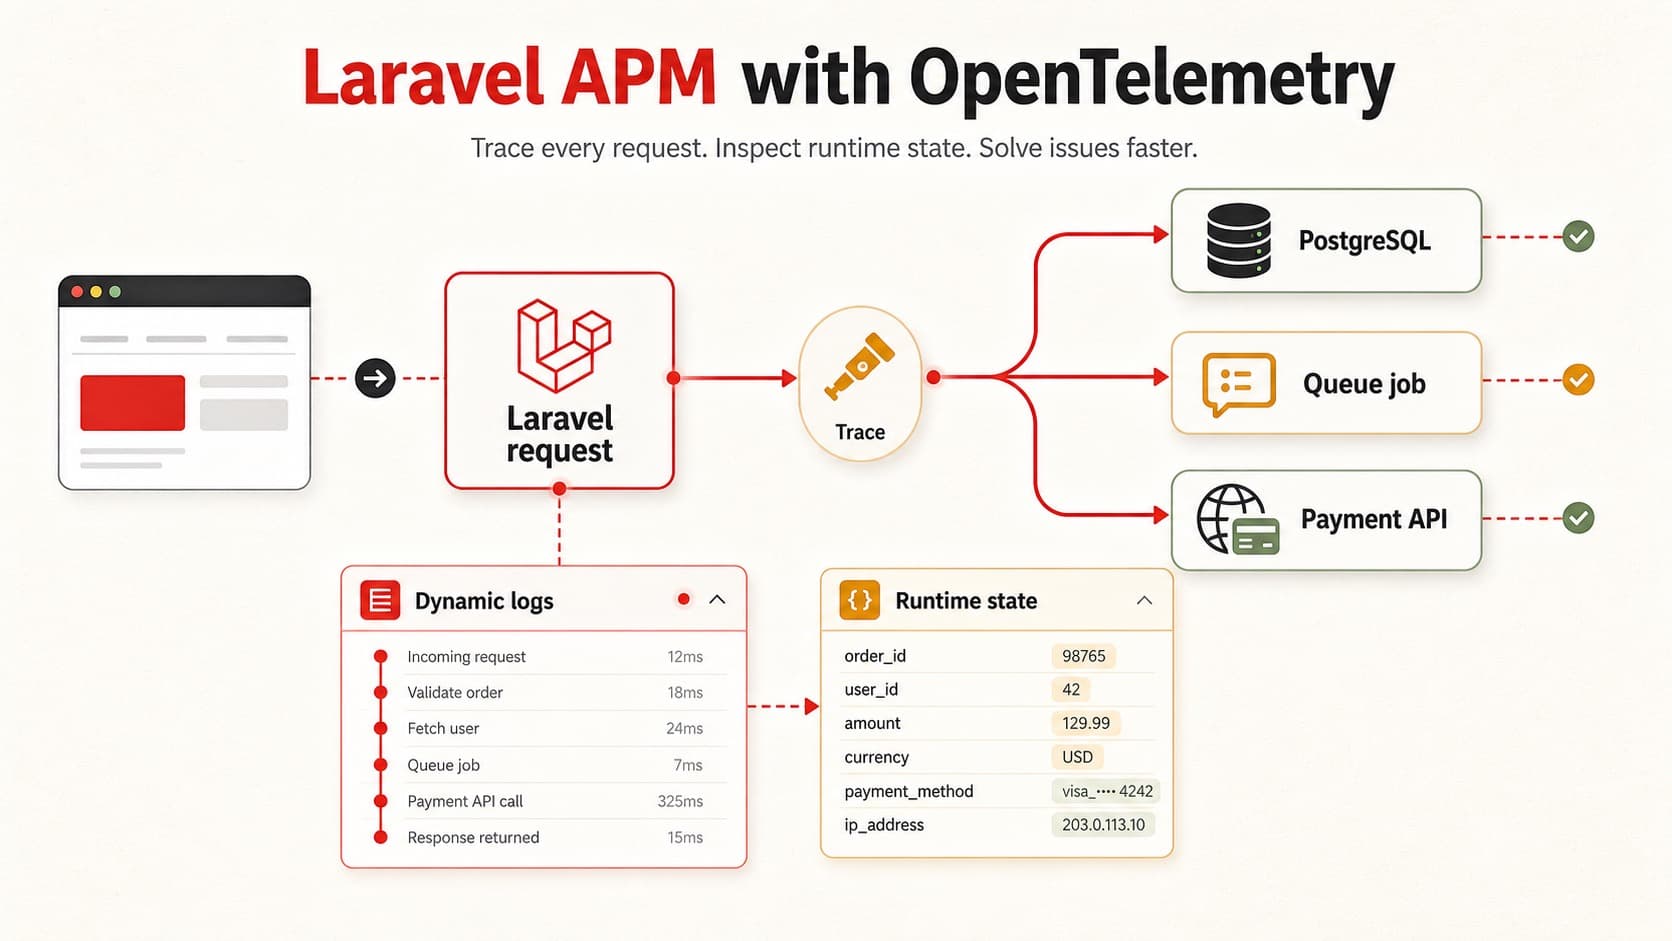
Add OpenTelemetry tracing to Laravel with verified request, database, queue, and HTTP client spans, plus production checks for trace gaps.
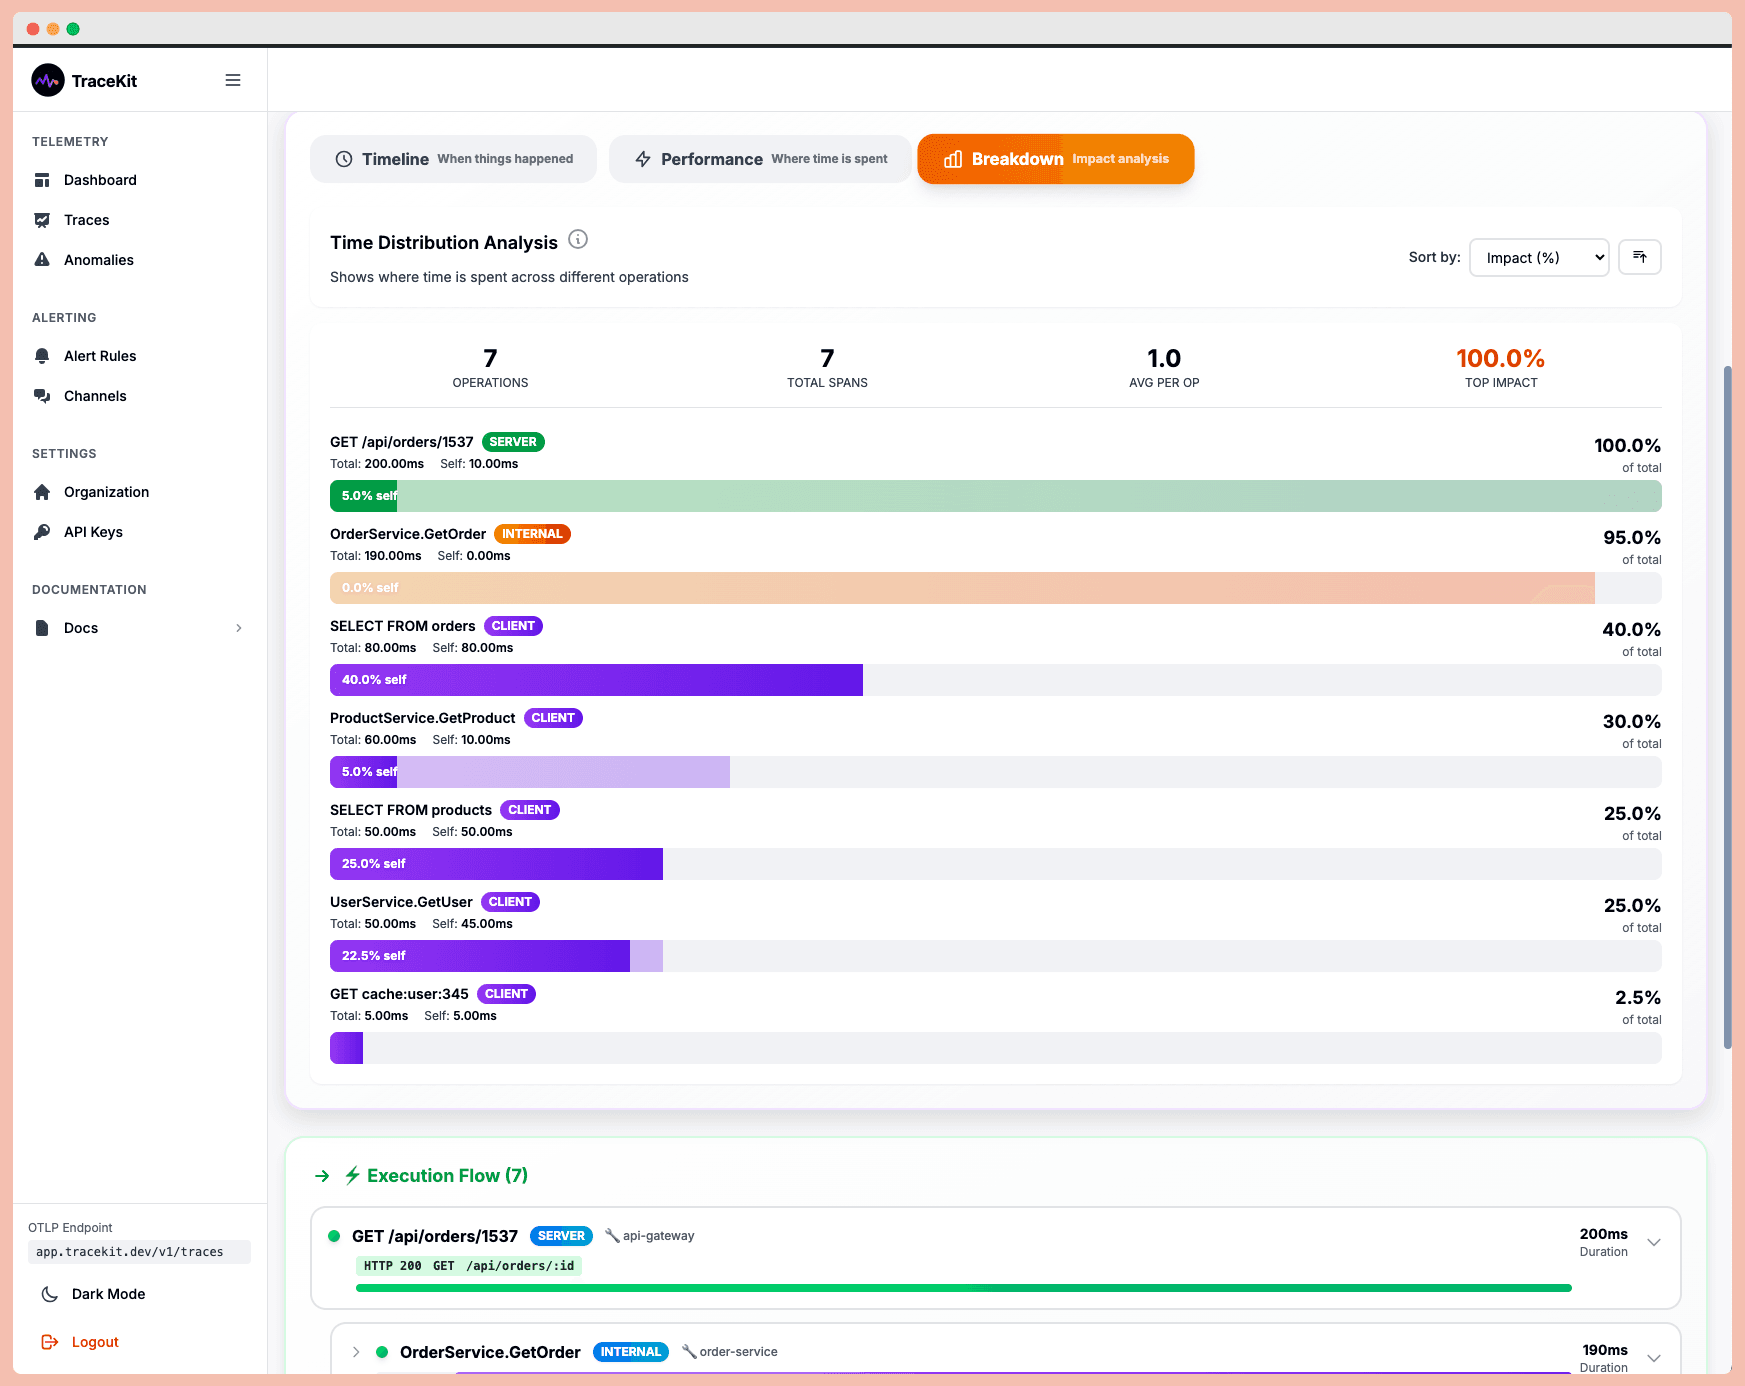
Debug production issues 10x faster with distributed tracing. Track requests across microservices, find bottlenecks, and resolve errors without log diving.

Learn how to read a flame graph, separate CPU samples from trace timing, find wide hotspots, and verify each performance bottleneck.