Find what broke before users get stuck
Tracekit connects traces, errors, sessions, LLM calls, alerts, and dynamic logs. Ask what changed, where it failed, and what to fix next.
Incident investigation
Ask what broke. Get the evidence.
Dashboards still matter, but production incidents need a direct path to the cause. Tracekit gives your team and AI tools the context behind the error, trace, session, and service.
Collect the context
01Traces, LLM calls, sessions, alerts, releases, and dynamic logs stay connected to the same service and request path.
Ask from the workflow
02Use Tracekit Copilot or your MCP-enabled AI tool to ask what changed, which service regressed, or why spend moved.
Return evidence
03Answers cite services, spans, token usage, latency, recent calls, and the exact telemetry behind the recommendation.
Act with confidence
04Jump into the trace, replay, alert rule, dynamic log capture, or owner while the investigation is still fresh.
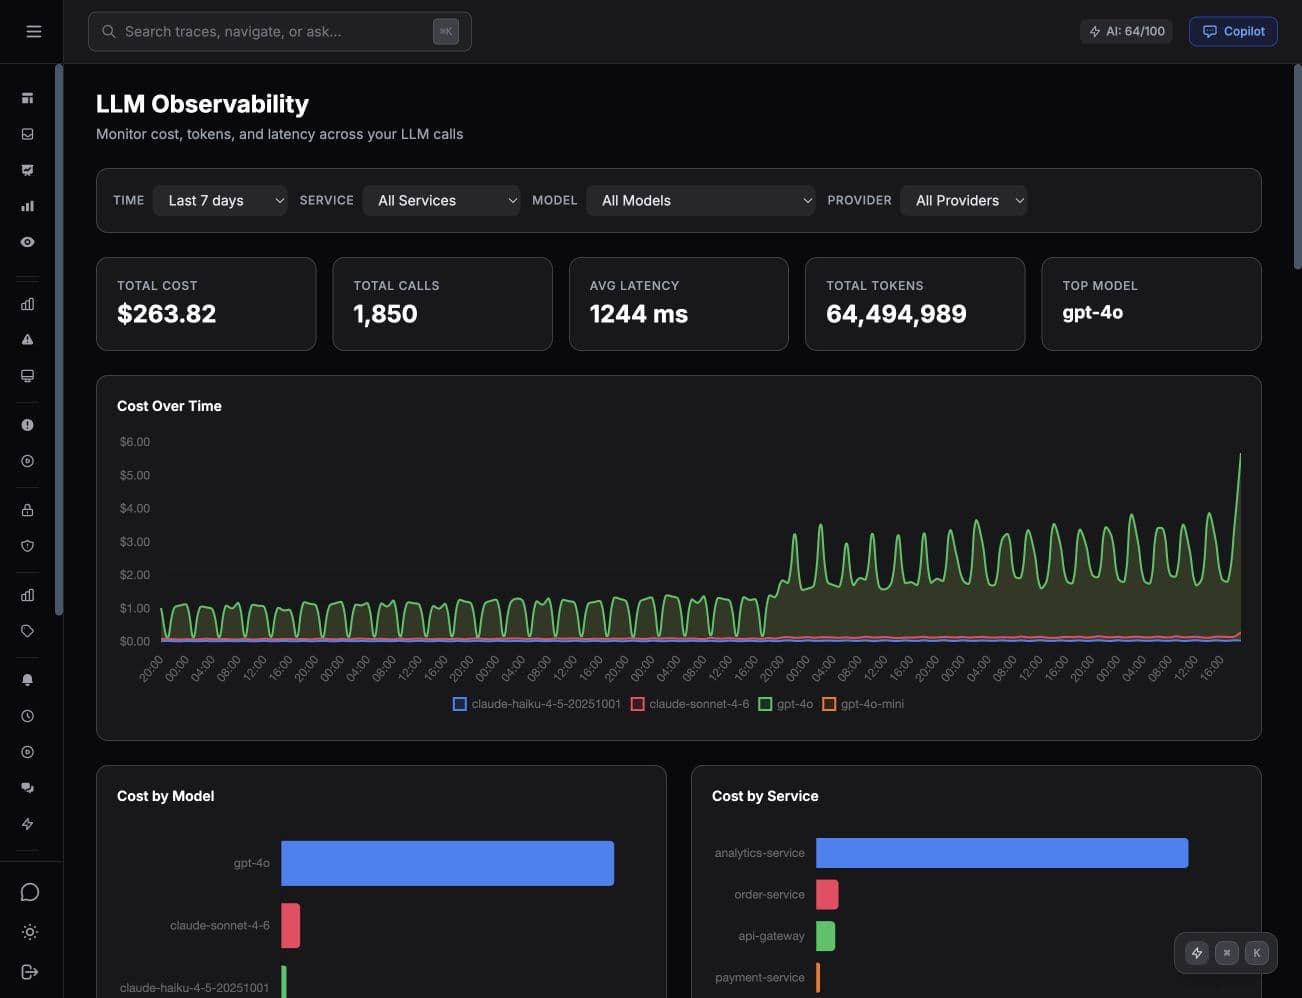
LLM observability
AI spend is easier to fix when it is tied to traces.
Tracekit records model, provider, token count, latency, service, and trace context for LLM calls. That turns a billing spike into a concrete engineering question: which workflow created it, and what changed?
- Every LLM call lands as a span inside the originating trace.
- Cost, tokens, and latency roll up by service, model, and provider.
- Spikes link straight to the calls and prompts that caused them.
MCP for AI tools
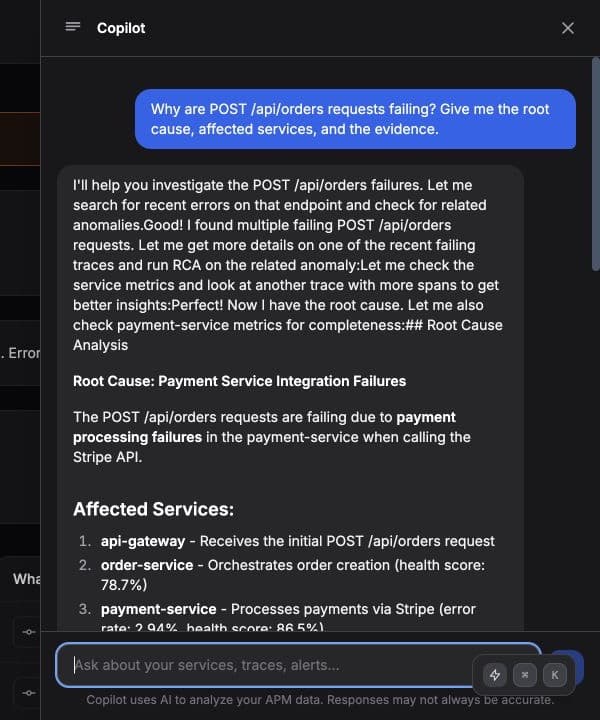
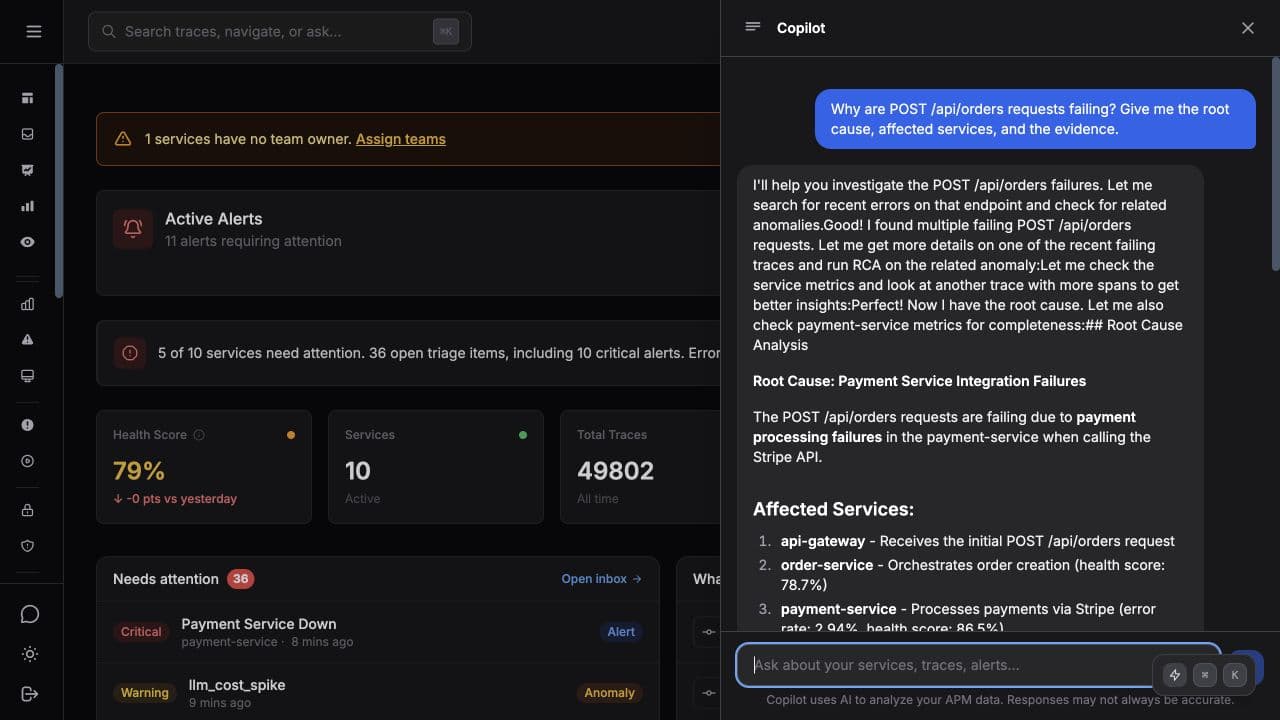
Ask your AI tool what broke in production.
The Tracekit MCP server lets Claude, Cursor, and other assistants inspect real traces, errors, services, and LLM calls instead of guessing from a screenshot.
Connect once
Expose Tracekit telemetry through an MCP endpoint secured by your account.
Ask naturally
Ask about service health, slow traces, LLM usage, alert history, or dynamic log captures.
Inspect proof
Open the trace, call detail, runbook, or replay that supports the assistant answer.
What developers are saying about Tracekit
Unfiltered feedback from engineers using Tracekit to understand production issues, LLM calls, and AI-generated code.
Platform
The signals you need to find the cause
Tracekit keeps the important details connected, so alerts, traces, sessions, LLM calls, and dynamic logs point to the same problem.
LLM observability
Attribute OpenAI and Anthropic cost, latency, token volume, and model usage to the services making the calls.
MCP server
Give Claude, Cursor, and compatible assistants access to live production context without copying dashboard screenshots.
Distributed tracing
Follow requests across services with OpenTelemetry-native spans, waterfalls, latency, errors, and service health.
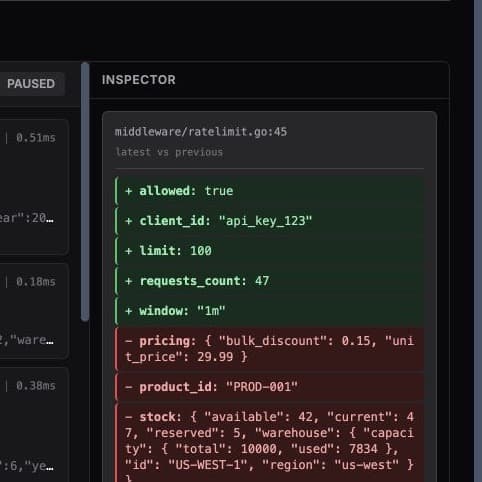
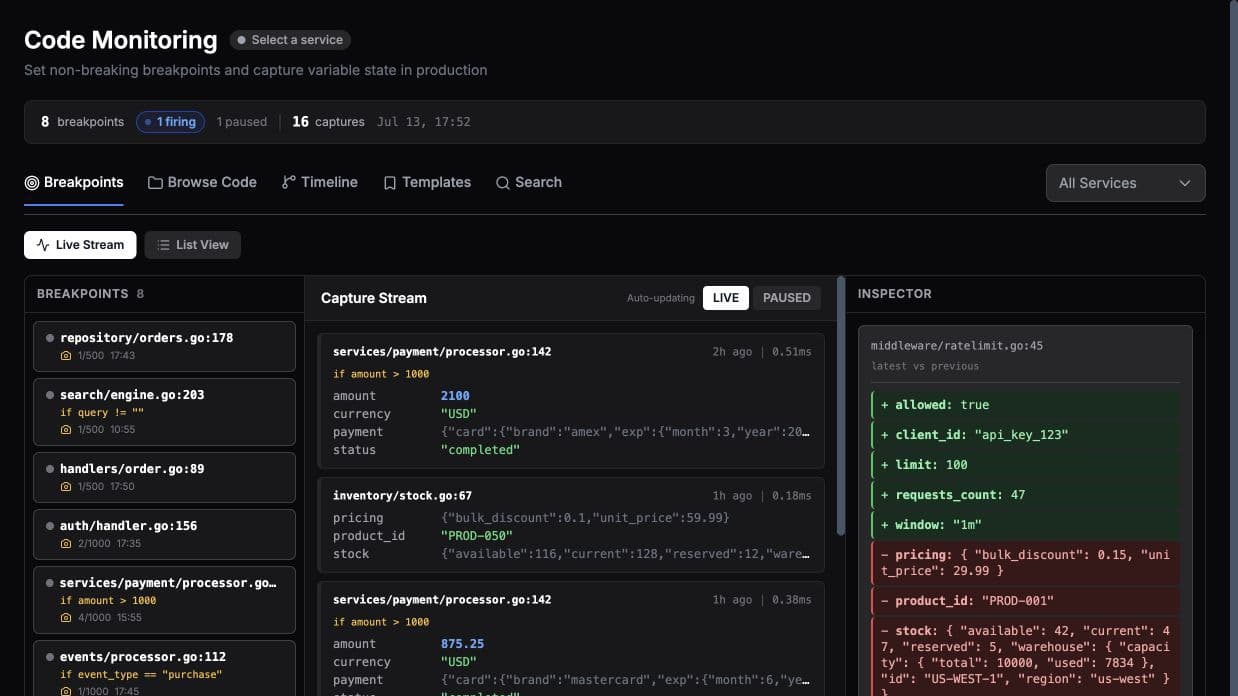
Dynamic logs
Capture variable state from running production code without redeploying or asking engineers to add another log line.
Session replay
See the frontend behavior that produced a backend trace, error, or failed checkout path.
Alerts and incidents
Connect anomaly detection, alert history, ownership, and incident replay to the same evidence trail.
Instrument once
Tracekit speaks the stack developers already run.
Use Tracekit SDKs or send OpenTelemetry data directly. The goal is not another proprietary island. It is clean telemetry that AI tools can query when production gets confusing.
Open standards first
OpenTelemetry-native ingestion keeps teams from locking production truth inside one vendor format.
Built for small teams
Start with useful defaults, free traces, and AI credits without needing a dedicated observability owner.
Designed for operators
Keyboard-friendly workflows, inspectable evidence, and direct links into the trace or replay behind an answer.
Find the cause faster with real production context
Start free with 200K traces/month, 100 AI credits, alerting, LLM monitoring, and enough context to see what broke and what to fix.
Free forever plan. Upgrade when your services and usage grow.