
How to Visualize OpenTelemetry Traces Online
Visualize OpenTelemetry traces online, read the waterfall, fix export errors, and choose the right OTel trace viewer for each debugging job.
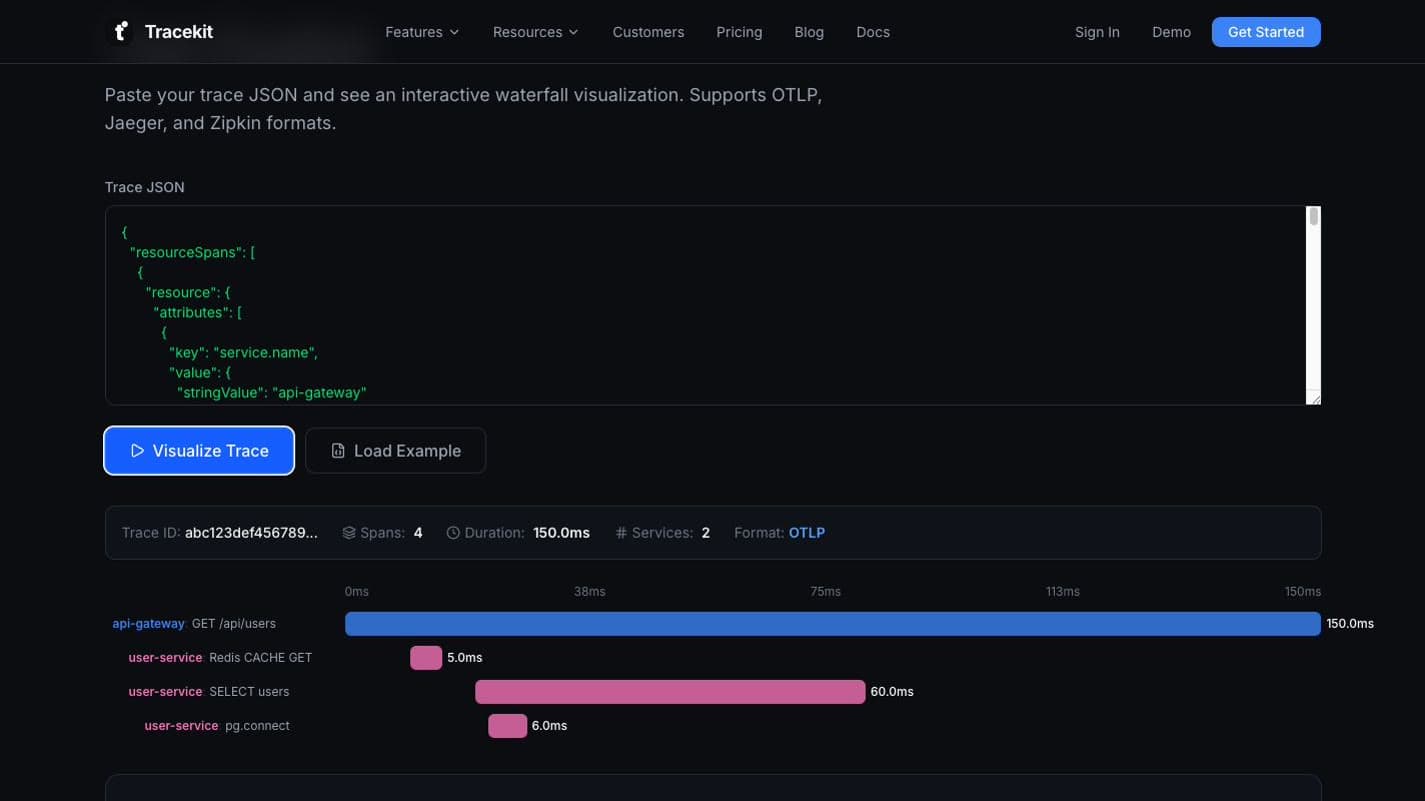
To visualize OpenTelemetry traces online, start with one complete trace in OTLP JSON. Load it into a viewer, confirm the parent-child tree, and read the longest dependent path. Then inspect the attributes on the first slow or failed span.
That sounds simple. Search results make it harder. They mix application traces, Playwright test traces, system profiles, and network traces. Each format needs a different viewer.
This guide shows the shortest path for application traces. You will learn how to prepare the JSON, use an online OTel trace viewer, read the waterfall, and fix common format errors.
Quick Answer: Visualize an OTel Trace in Five Steps
- Export one complete application trace as OTLP JSON, Jaeger JSON, or Zipkin v2 JSON.
- Remove secrets and personal data from span attributes.
- Open the free Tracekit Trace Visualizer.
- Paste the JSON and select Visualize Trace.
- Start at the root span. Follow the slowest dependent path and inspect its attributes.
The Trace Visualizer shows the trace ID, span count, total duration, service count, format, waterfall, and span details. It also includes a safe example when you do not have an export ready.
First Confirm That You Have an Application Trace
The word trace describes several unrelated files. Check the source before you choose a tool.
| Trace type | Typical source | Correct viewer |
|---|---|---|
| OpenTelemetry application trace | OTel SDK, Collector, or backend export | OTel waterfall viewer or tracing backend |
| Jaeger application trace | Jaeger UI export | Jaeger-compatible JSON viewer |
| Zipkin application trace | Zipkin API or UI export | Zipkin-compatible JSON viewer |
| Playwright test trace | trace.zip from a browser test | Playwright Trace Viewer |
| System profile | Perfetto, Linux tracing, or Android tracing | Perfetto or another system profiler |
| Network path trace | traceroute or tracert | Network path visualizer |
An OpenTelemetry trace contains related spans for one request or workflow. The official OpenTelemetry tracing API defines one root span and parent-child relationships for the other spans. A waterfall makes those relationships and timings visible.
Do not load a Playwright archive or a system profile into an OTel viewer. A format error is correct in that case.
Prepare Trace JSON Before You Paste It
An online viewer needs a supported JSON envelope. The fields inside the envelope also need consistent identifiers and timestamps.
OTLP JSON
OTLP JSON uses lower camel case field names. A trace export request normally starts with resourceSpans:
{
  "resourceSpans": [
    {
      "resource": {
        "attributes": [
          {
            "key": "service.name",
            "value": { "stringValue": "checkout-api" }
          }
        ]
      },
      "scopeSpans": [
        {
          "spans": [
            {
              "traceId": "5b8efff798038103d269b633813fc60c",
              "spanId": "eee19b7ec3c1b174",
              "name": "POST /checkout",
              "startTimeUnixNano": "1790010000000000000",
              "endTimeUnixNano": "1790010000420000000"
            }
          ]
        }
      ]
    }
  ]
}
The OTLP specification requires hexadecimal traceId and spanId values in JSON. It also requires lower camel case names such as resourceSpans and startTimeUnixNano.
The OpenTelemetry file exporter can write one JSON object per line. If your file uses JSON Lines, copy one complete trace export object. Do not paste several lines as one invalid JSON document.
Jaeger JSON
The current Tracekit viewer detects a Jaeger export through its top-level data array. It reads each trace's spans and processes data.
{
  "data": [
    {
      "traceID": "5b8efff798038103d269b633813fc60c",
      "spans": [],
      "processes": {}
    }
  ]
}
Use a Jaeger UI trace export. Do not depend on Jaeger's internal query JSON API for a stable integration. The Jaeger API documentation marks that HTTP JSON API as internal.
Zipkin v2 JSON
Zipkin v2 JSON is an array of span objects:
[
  {
    "traceId": "5b8efff798038103d269b633813fc60c",
    "id": "eee19b7ec3c1b174",
    "name": "post /checkout",
    "timestamp": 1790010000000000,
    "duration": 420000,
    "localEndpoint": { "serviceName": "checkout-api" }
  }
]
The official Zipkin v2 API accepts a list of spans. Each child span can include a parentId so a viewer can rebuild the tree.
How to Use the Tracekit Trace Visualizer
The Tracekit Trace Visualizer supports the three envelopes above. The current implementation parses the pasted JSON in browser code. It does not call a trace upload endpoint.
1. Test the viewer with the built-in example
Select Load Example, then select Visualize Trace. You should see an OTLP waterfall with four spans and two services.
This check separates a viewer problem from an export problem. If the example works, inspect your JSON next.
2. Paste one complete trace
Use one trace at a time. A single export can contain several resource groups, but every span should belong to the same trace ID.
Do not paste:
- a Collector configuration file
- an OTLP Protobuf binary payload
- a console log prefix around the JSON
- several JSON objects without an array or valid envelope
- a partial span that omits its parent and timing fields
3. Confirm the summary
Check these values before you read the waterfall:
- Trace ID: all displayed spans should belong to this request.
- Spans: a very low count can indicate sampling or missing instrumentation.
- Duration: this should match the root operation's elapsed time.
- Services: unexpected
unknownvalues usually mean missingservice.nameresource data. - Format: confirm that the viewer detected OTLP, Jaeger, or Zipkin.
4. Select a span
Select a waterfall row to inspect its name, service, duration, status, span ID, parent ID, and attributes.
Attributes explain what the generic bar represents. Useful fields often include route, method, database system, peer service, status code, or messaging operation. OpenTelemetry publishes trace semantic conventions so tools can interpret common operations consistently.
How to Read the Waterfall Without Guessing
A waterfall answers timing questions. Read it in this order.
1. Find the root span
The root span has no parent. It should represent the request, job, or event that owns the trace duration.
If the root is missing, the export may be incomplete. Sampling or broken context propagation can also split one request into separate traces.
2. Follow the critical path
The critical path is the dependent chain that controls the final response time. It is not always the single longest bar.
For example, three database spans can run in parallel. Their durations can overlap, so you must not add them together. Follow parent-child timing and look for work that blocks the next operation.
3. Find the first abnormal span
Start with the earliest span that is slow, failed, or unexpectedly serial. Later spans can be symptoms.
Ask:
- Did one database call dominate the request?
- Did a retry create repeated child spans?
- Did a queue or HTTP call lose its parent context?
- Did an error appear before the slow cleanup work?
- Did one service start much later than expected?
4. Read attributes before you assign blame
A span name can hide the real operation. Read its route, database, peer, status, and messaging attributes.
Also check the service resource. A missing service.name makes cross-service traces much harder to read.
5. Decide whether the trace answered the incident
The trace can answer a timing problem. It cannot always explain a wrong branch, tenant-specific value, or malformed payload.
When timing identifies the suspicious code path, use dynamic logs to capture bounded runtime state. Tracekit dynamic logs use capture points. They do not pause production execution or replace normal log ingestion.
Common OTel Trace Viewer Errors
| Symptom | Likely cause | Fix |
|---|---|---|
Unexpected token or another JSON error | Prefix text, JSON Lines, or a truncated export | Keep one complete JSON value and validate it first |
Missing resourceSpans field | The payload is not OTLP JSON | Use a supported Jaeger or Zipkin envelope, or export OTLP JSON |
| No spans found | The request envelope is empty | Check scopeSpans[].spans[] and upstream sampling |
Every service is unknown | service.name is absent | Set service.name on the OpenTelemetry resource |
| Broken or flat tree | Parent IDs are missing or inconsistent | Check context propagation and the exported parentSpanId values |
| Durations look impossible | Units or timestamps are wrong | OTLP uses nanosecond timestamp fields; Zipkin uses microseconds |
| Several unrelated roots appear | The export contains more than one trace | Filter the payload to one trace ID |
| Sensitive values appear | Attributes contain raw request or user data | Redact the payload before using any viewer |
OpenTelemetry context propagation carries the trace ID and parent span ID across service boundaries. If that context disappears, the viewer cannot rebuild one connected request.
Choose the Right OTel Viewer for the Job
| Job | Best starting point | Why |
|---|---|---|
| Inspect one JSON export now | Tracekit Trace Visualizer | No storage setup is needed |
| Watch local spans during development | Local OTel receiver or desktop viewer | It receives a live OTLP stream |
| Search retained traces | Jaeger or another tracing backend | It adds storage, filters, and cross-trace search |
| Debug repeated production failures | Tracekit distributed tracing | It connects retained traces with service and release context |
| Inspect code state after finding the slow path | Tracekit dynamic logs | It captures runtime state at bounded capture points |
Jaeger can receive OTLP directly and provides a query service and UI. Its architecture documentation describes both roles. Use a backend when you need more than one pasted trace.
Protect Sensitive Data in Trace Exports
Trace attributes can contain URLs, database statements, user identifiers, and request metadata. Treat every export as production data.
Before you use an online viewer:
- Remove access tokens, API keys, cookies, and authorization headers.
- Remove personal data that the investigation does not need.
- Replace customer identifiers with safe placeholders.
- Keep only the trace and spans needed for the incident.
- Use a local or approved backend when policy forbids browser tools.
Do not assume that sampling removes sensitive fields. Sampling decides which spans you retain. It does not sanitize the attributes inside those spans.
From One Trace to a Repeatable Workflow
An online viewer works well for a single export. Production debugging needs a longer path:
- Instrument the request and its dependencies.
- Preserve context across HTTP, queues, and background work.
- Export through OTLP to a tracing backend.
- Search for the affected service, route, release, or latency range.
- Read the critical path.
- Add runtime-state capture only where the trace leaves a question.
If you need help with the exporter, use the OTel Config Generator. For a broader introduction, read the OpenTelemetry guide. For production search and service context, use Tracekit distributed tracing.
Final Checklist
Before you trust an OTel trace visualization, confirm each point:
- The file contains an application trace, not a test or system trace.
- The JSON uses a supported OTLP, Jaeger, or Zipkin envelope.
- Every span belongs to one trace ID.
- Parent IDs rebuild one connected tree.
- Timestamps and durations use the correct units.
- Each resource includes a useful
service.name. - Sensitive attributes are removed.
- The critical path explains the delay.
- You move to runtime state only when timing is not enough.
Start with the free Tracekit Trace Visualizer when you have one raw trace. Move to a tracing backend when you need retention and search. Add dynamic logs when the trace shows where the problem lives but not why the code chose that path.
Related Posts
PHP Observability Checklist for Production Apps
Use this PHP observability checklist to trace requests, surface PDO and HTTP bottlenecks, and inspect runtime state without redeploying.
Python Application Performance Monitoring with OpenTelemetry
Set up Python application performance monitoring with OpenTelemetry. Measure latency, errors, throughput, and dependency spans across production requests.

Inspect Production Variables Without Redeploying
Learn when logs, traces, and dynamic logs help inspect production variables without redeploying. Includes setup limits and a safe capture checklist.