2 min
NestJS Tracing with OpenTelemetry: Production Setup Guide
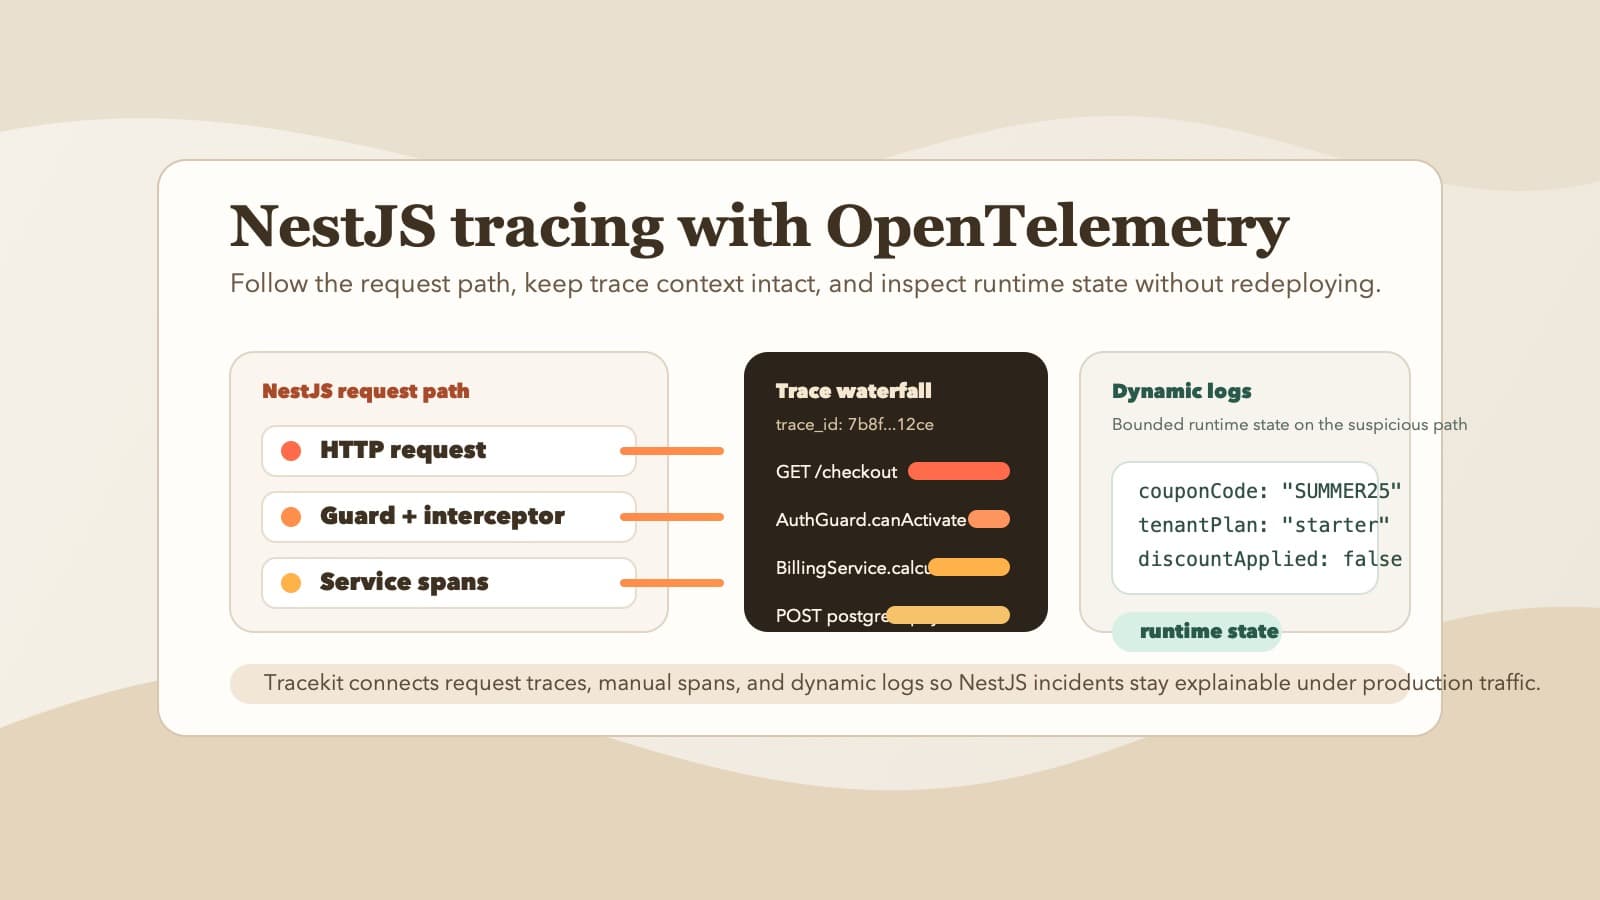
Set up NestJS tracing with OpenTelemetry and Tracekit so you can follow requests, catch regressions, and inspect runtime state without redeploying.
nestjsopentelemetry
Engineering insights on observability, distributed tracing, and production debugging.
Set up NestJS tracing with OpenTelemetry and Tracekit so you can follow requests, catch regressions, and inspect runtime state without redeploying.
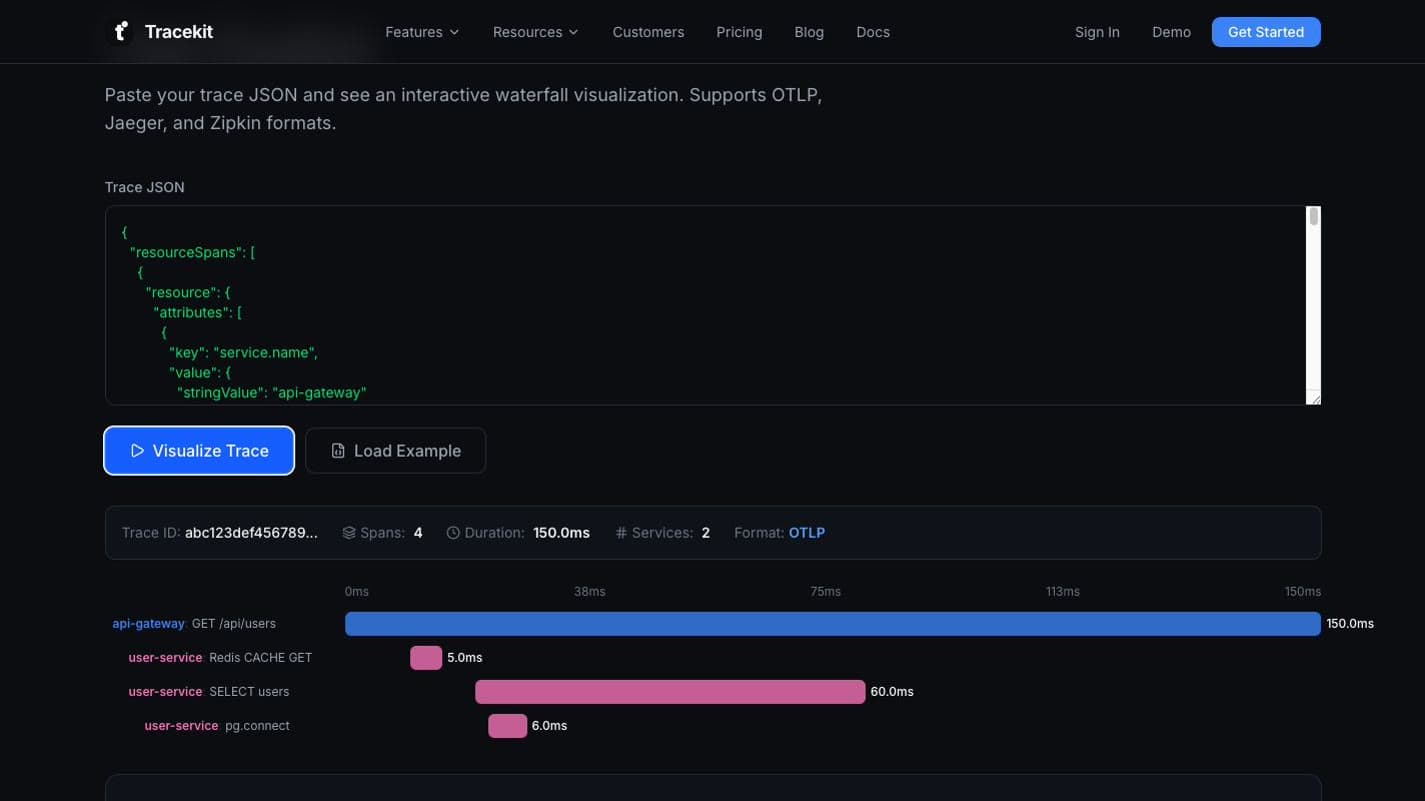
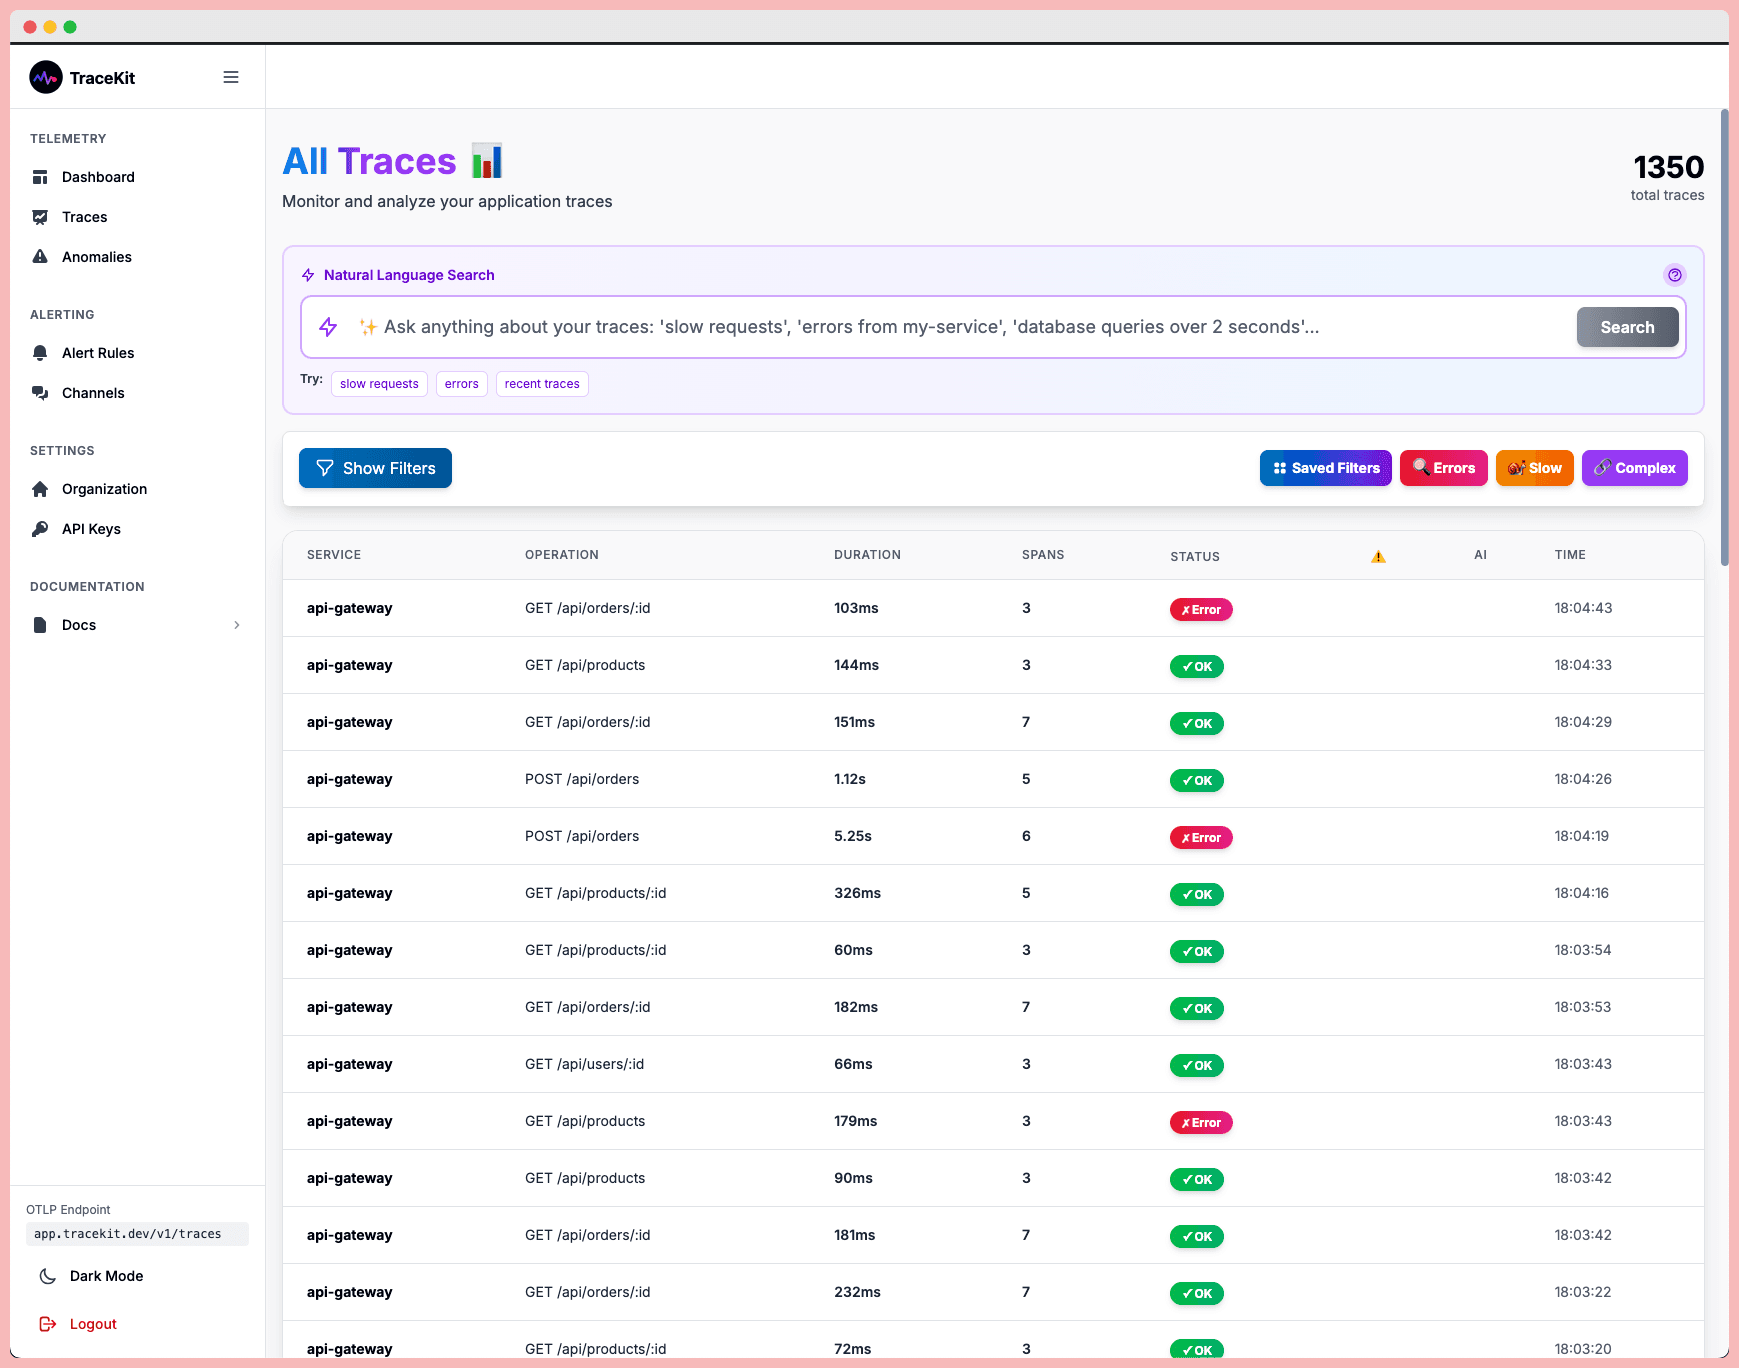
Compare OTel trace viewer options, learn how to read OpenTelemetry traces, and inspect OTLP, Jaeger, or Zipkin payloads faster.

Debug Gin framework apps in production with OpenTelemetry tracing, pprof profiling, GORM query optimization, and structured logging for Go services.

Set up OpenTelemetry in Laravel step by step. Install the PHP SDK, configure TraceKit as your backend, add custom spans, and verify trace exports.
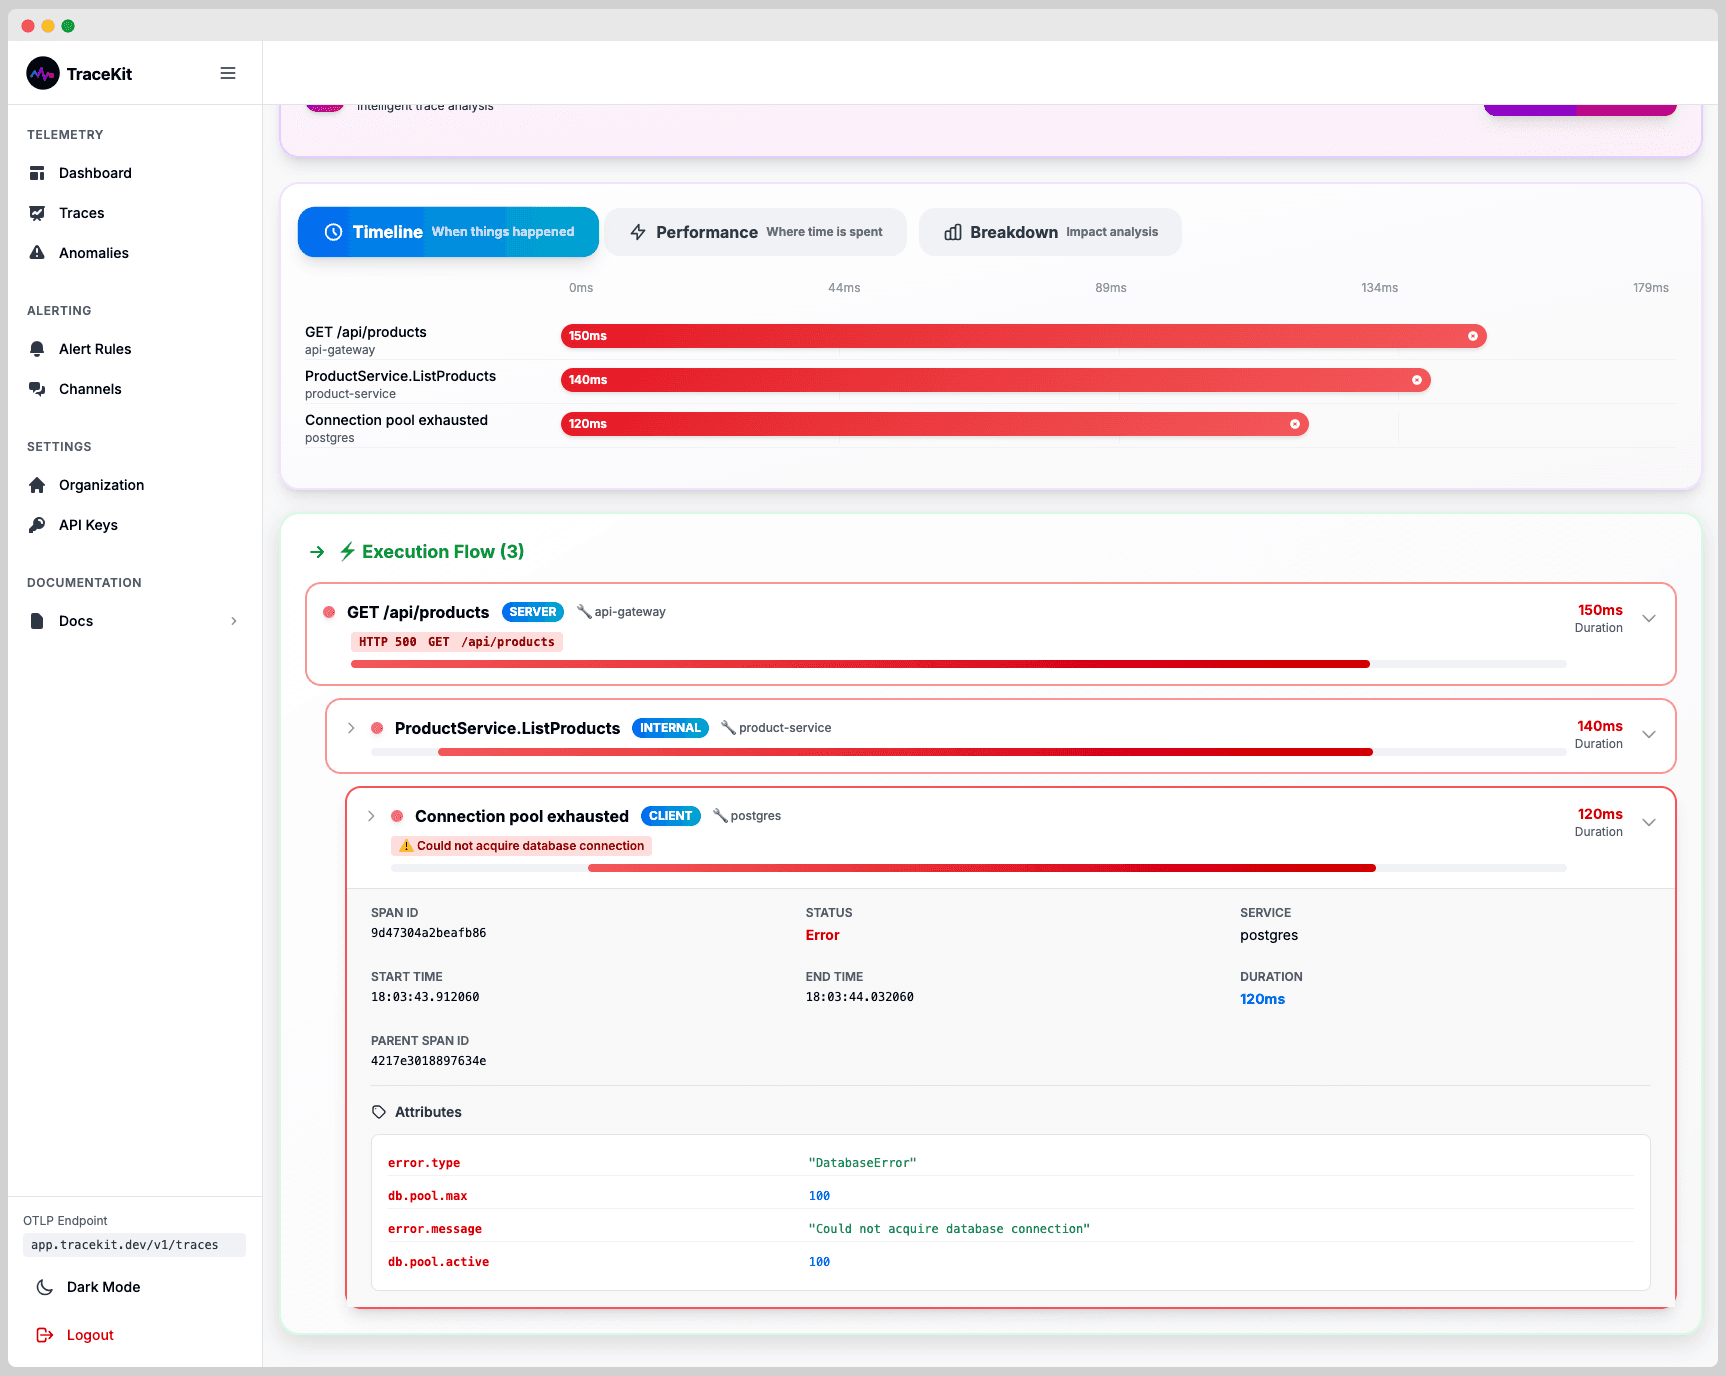
Your API threw a 500 at 3 AM. A systematic approach to diagnose, trace, and fix production API errors without the panic and guesswork.
Get production visibility without the Datadog bill. Free-tier APM setup with OpenTelemetry for freelancers and small teams who need traces, not invoices.

Debug Express.js in production: error middleware, async handling, structured logging with Pino, OpenTelemetry tracing, and dynamic logs.

Monitor Python apps in real time with OpenTelemetry and TraceKit. Track latency, error rates, and resource usage with auto-instrumentation and tracing.

Set up real-time metrics for microservices: key metrics to track, tools like Prometheus and OpenTelemetry, alerting best practices, and scaling tips.

Practical observability for startups: logs, metrics, traces with OpenTelemetry, cost-saving sampling, AI-driven detection, and CI/CD integration.
Complete OpenTelemetry setup guide. Install the SDK, configure exporters, and ship your first traces in under 5 minutes. Covers Node.js, Python, Go, and Java.
What is observability? Complete guide covering the three pillars (metrics, logs, traces), implementation strategies, and tools for modern software systems.