
4 min
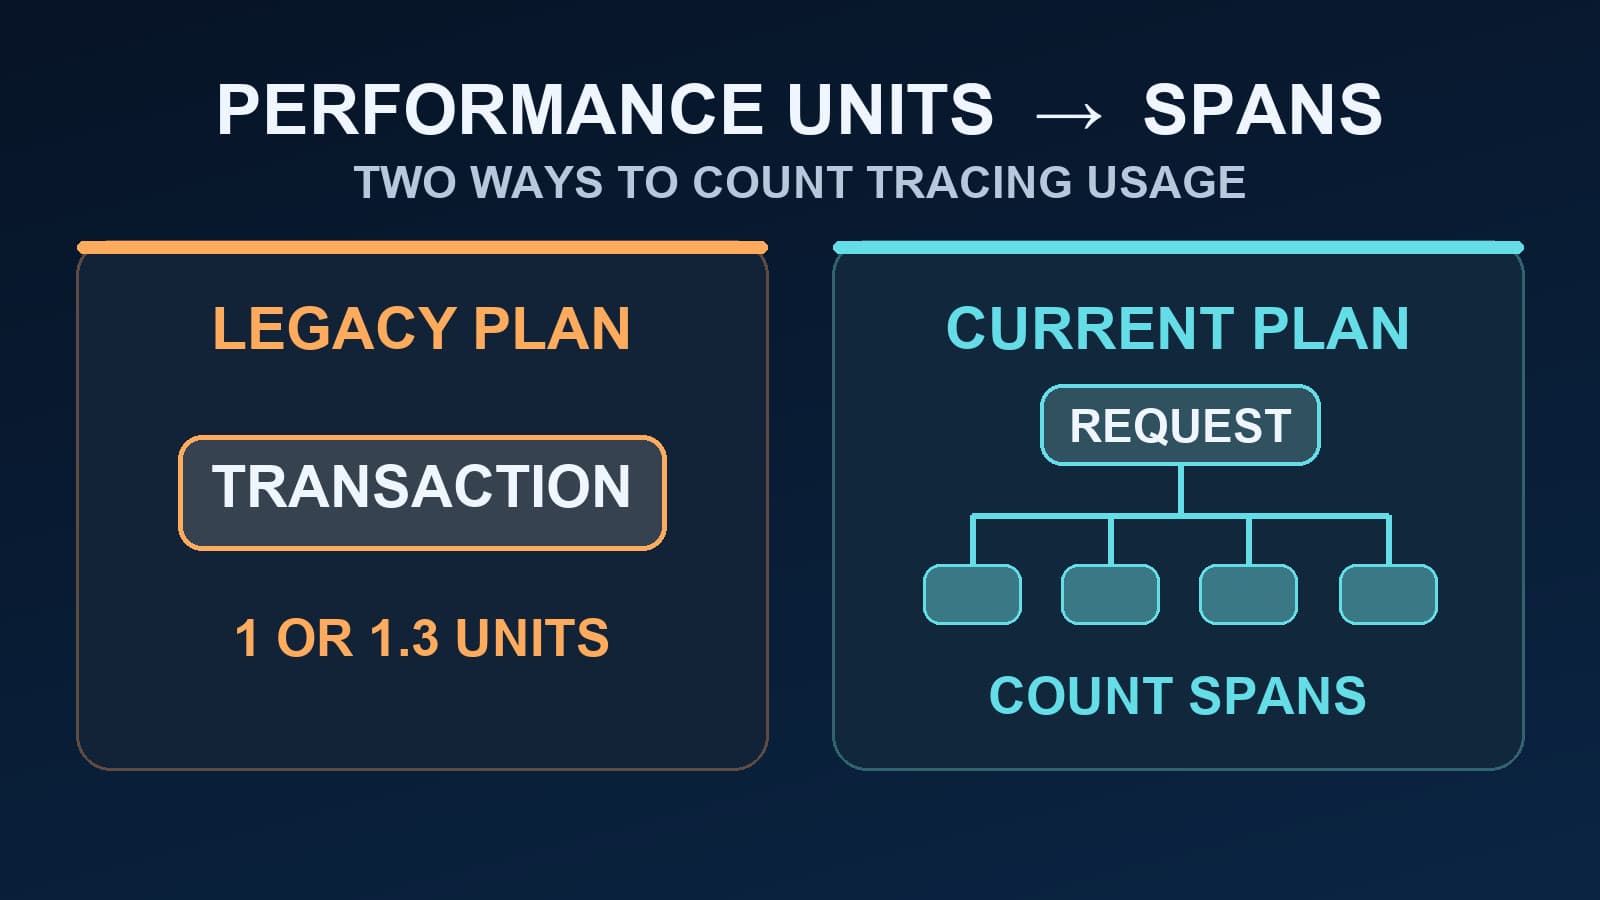
Sentry Performance Units vs Spans: What Changed?
Learn when Sentry performance units still apply, how legacy transactions were counted, and why current span quotas need a different estimate.
sentrydistributed-tracing
Learn when Sentry performance units still apply, how legacy transactions were counted, and why current span quotas need a different estimate.
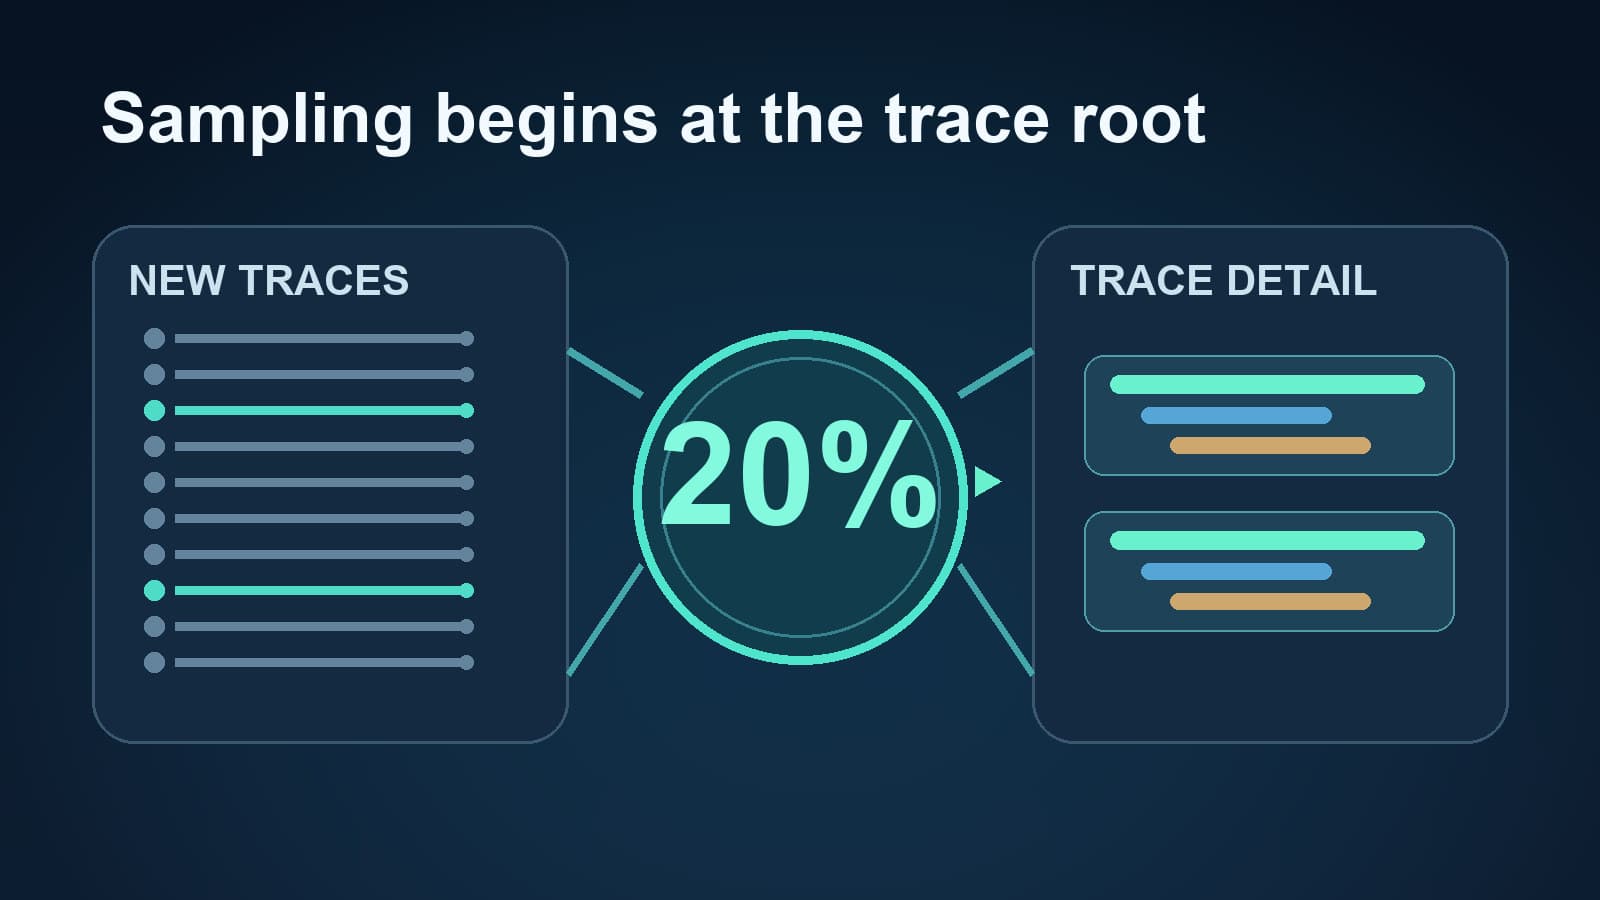
Set ELASTIC_APM_TRANSACTION_SAMPLE_RATE, check why it seems ignored, and map the setting to OpenTelemetry sampling during a migration.
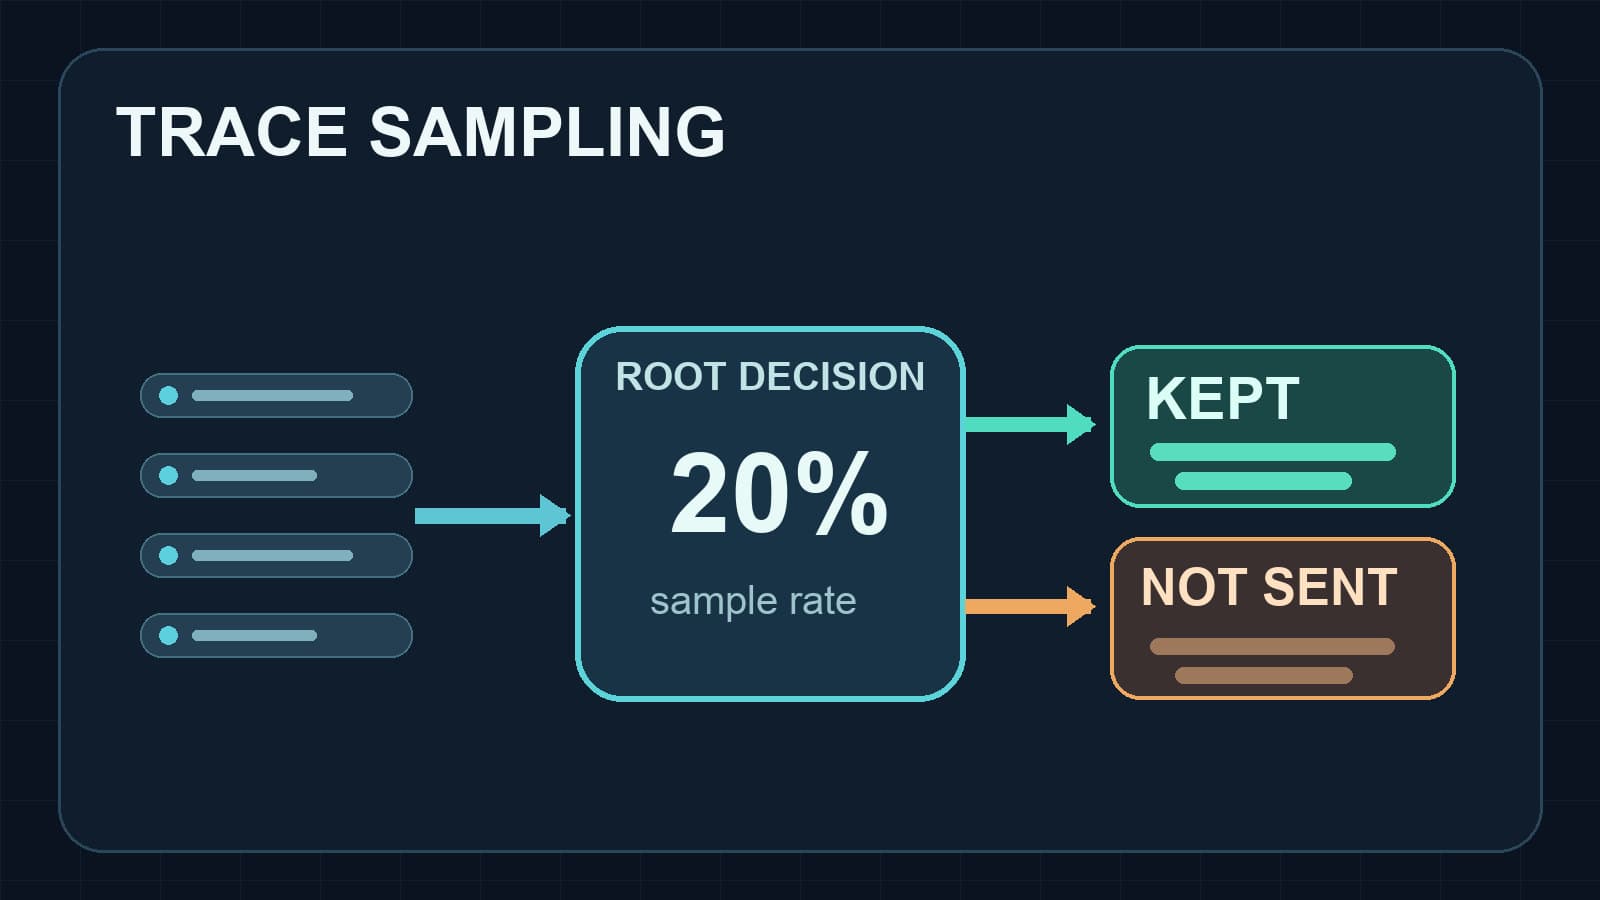
Set DD_TRACE_SAMPLE_RATE in Node.js, understand rate limits and sampling rules, and verify which distributed traces reach Datadog.
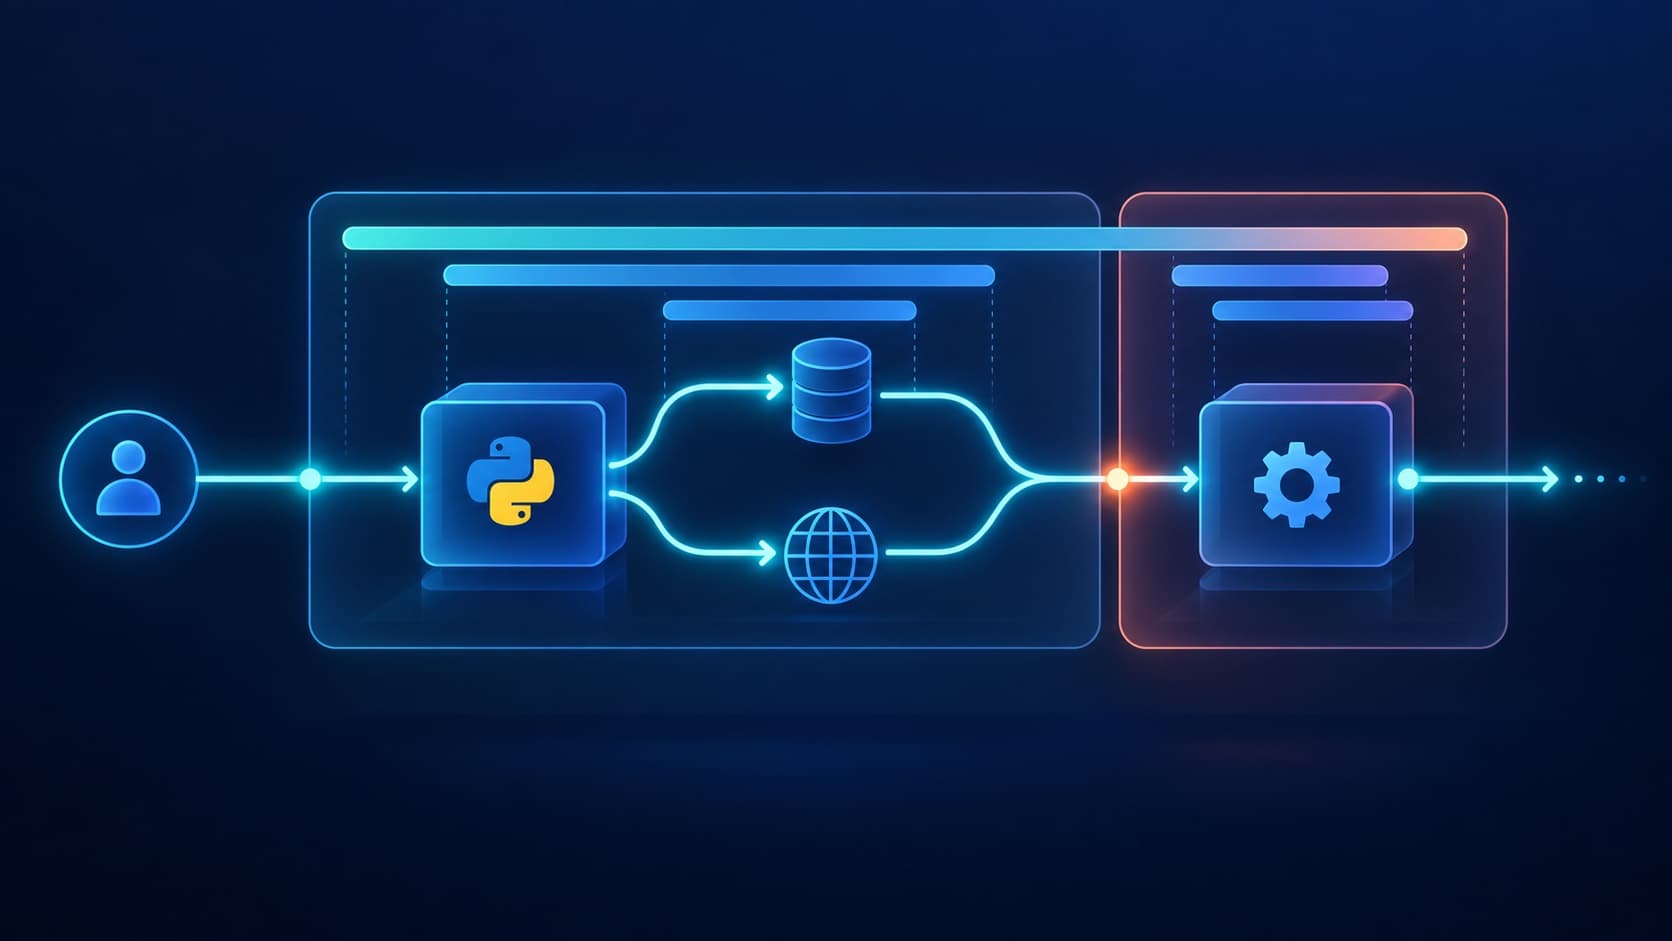
Set up FastAPI tracing with OpenTelemetry. Connect request, SQLAlchemy, and HTTPX spans, then verify trace context across services.
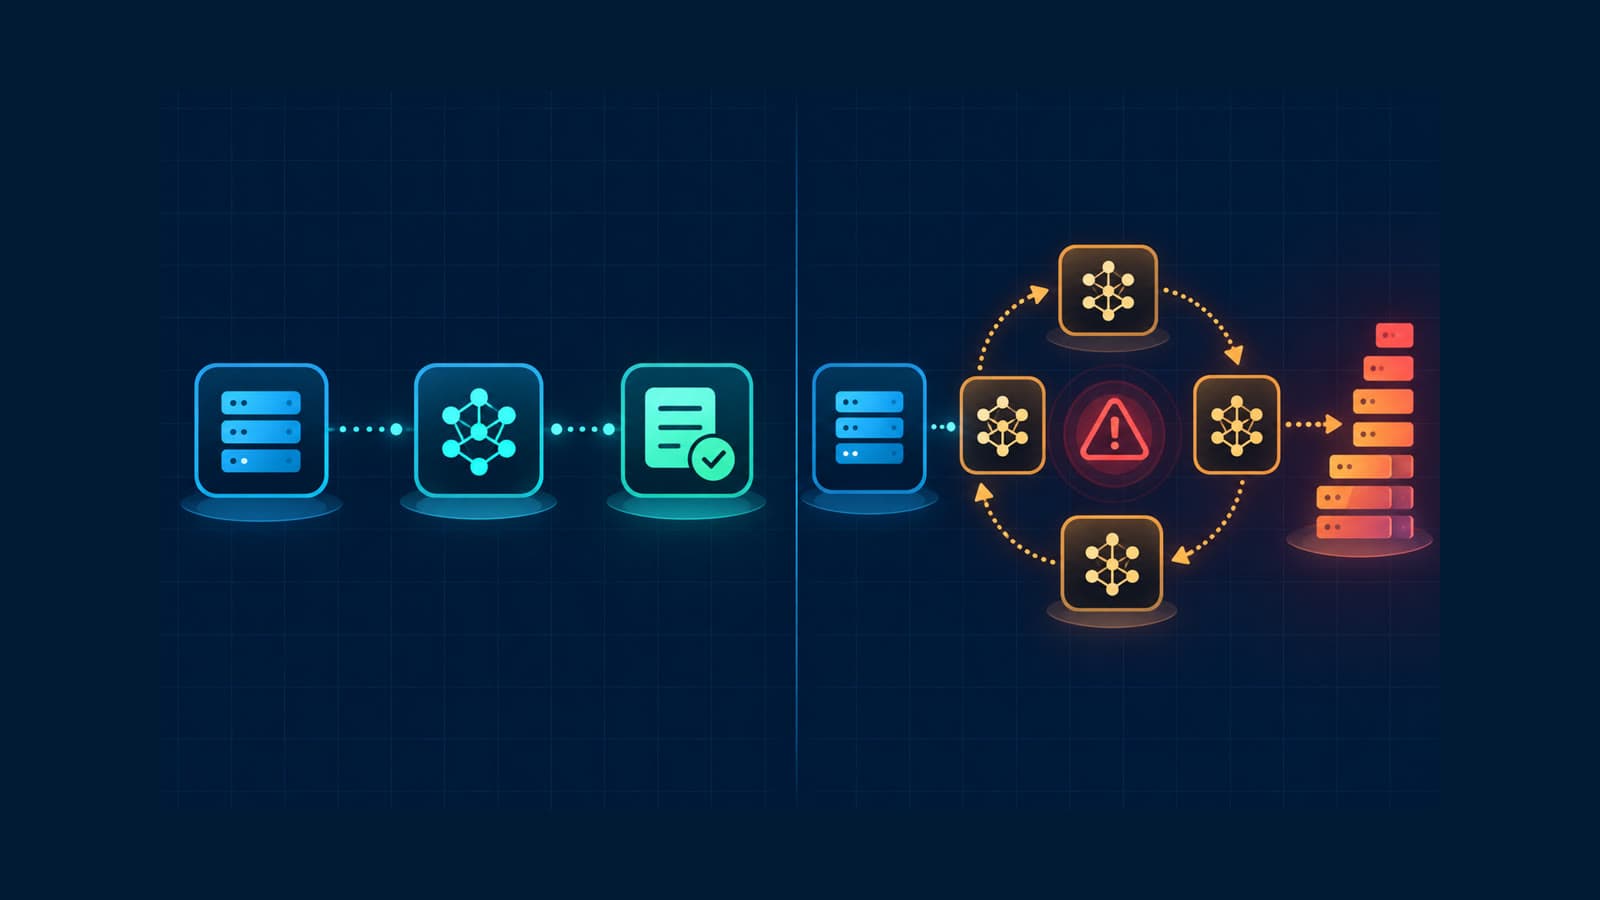
Track rogue LLM calls with traces, call counts, token usage, costs, models, and retry evidence before a loop becomes an incident.
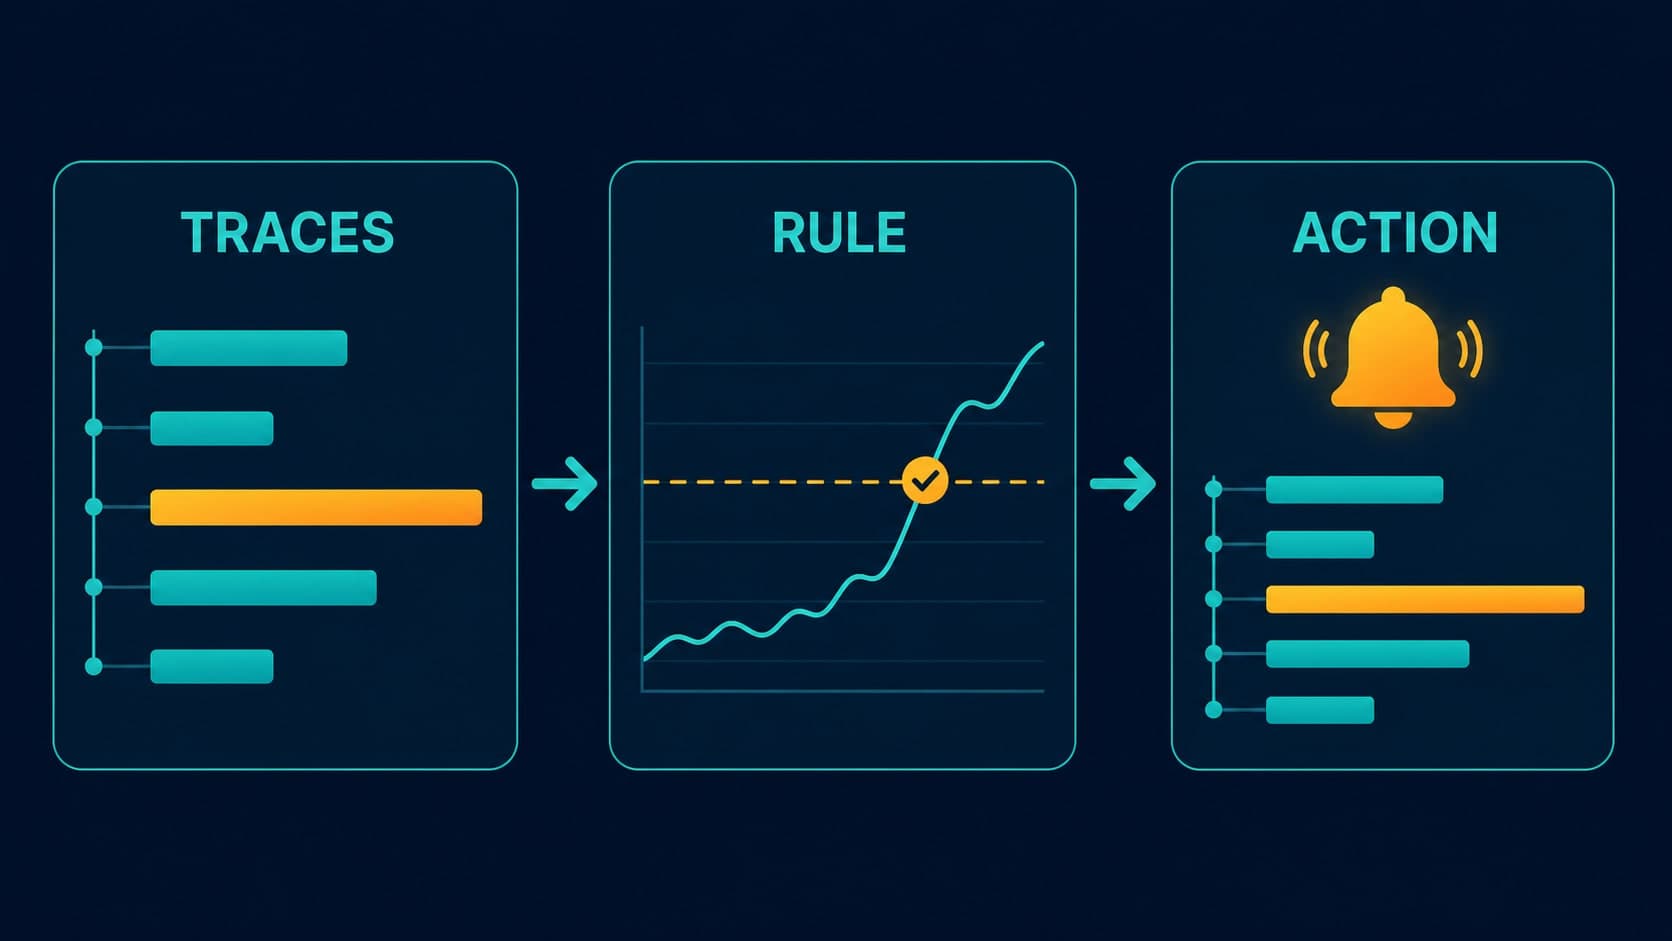
Set up trace based alerts for errors and latency. Check sampling, request counts, time windows, and notification context before paging.
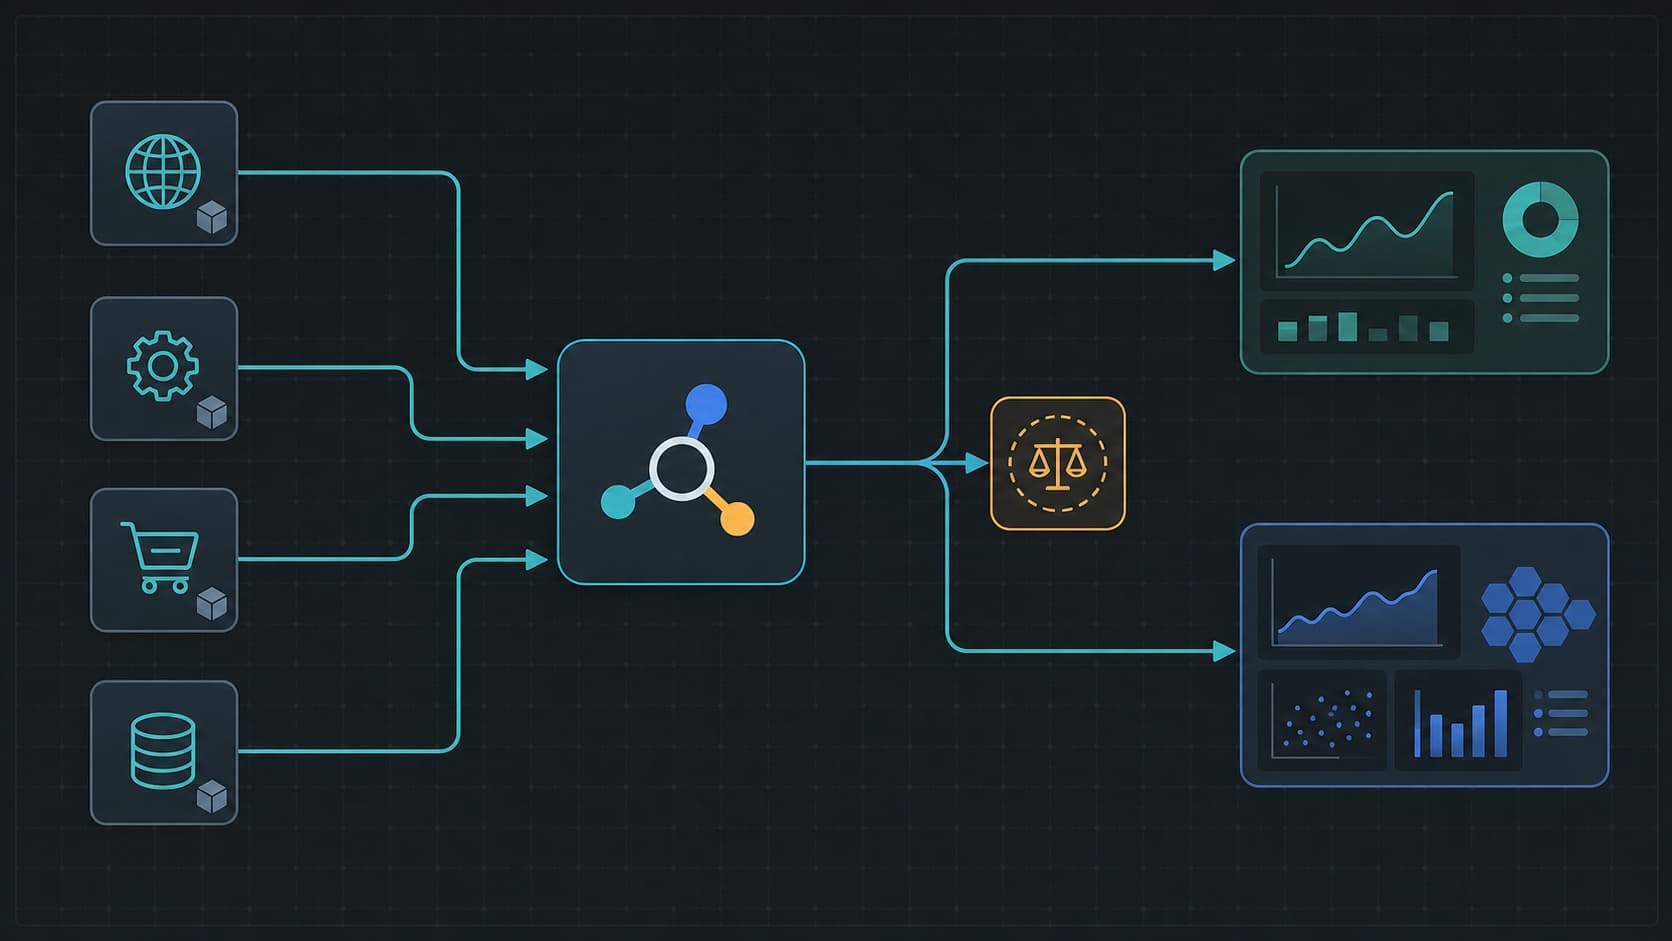
Migrate to OpenTelemetry without downtime with a parallel Collector path, trace parity checks, and a safe service-by-service cutover.
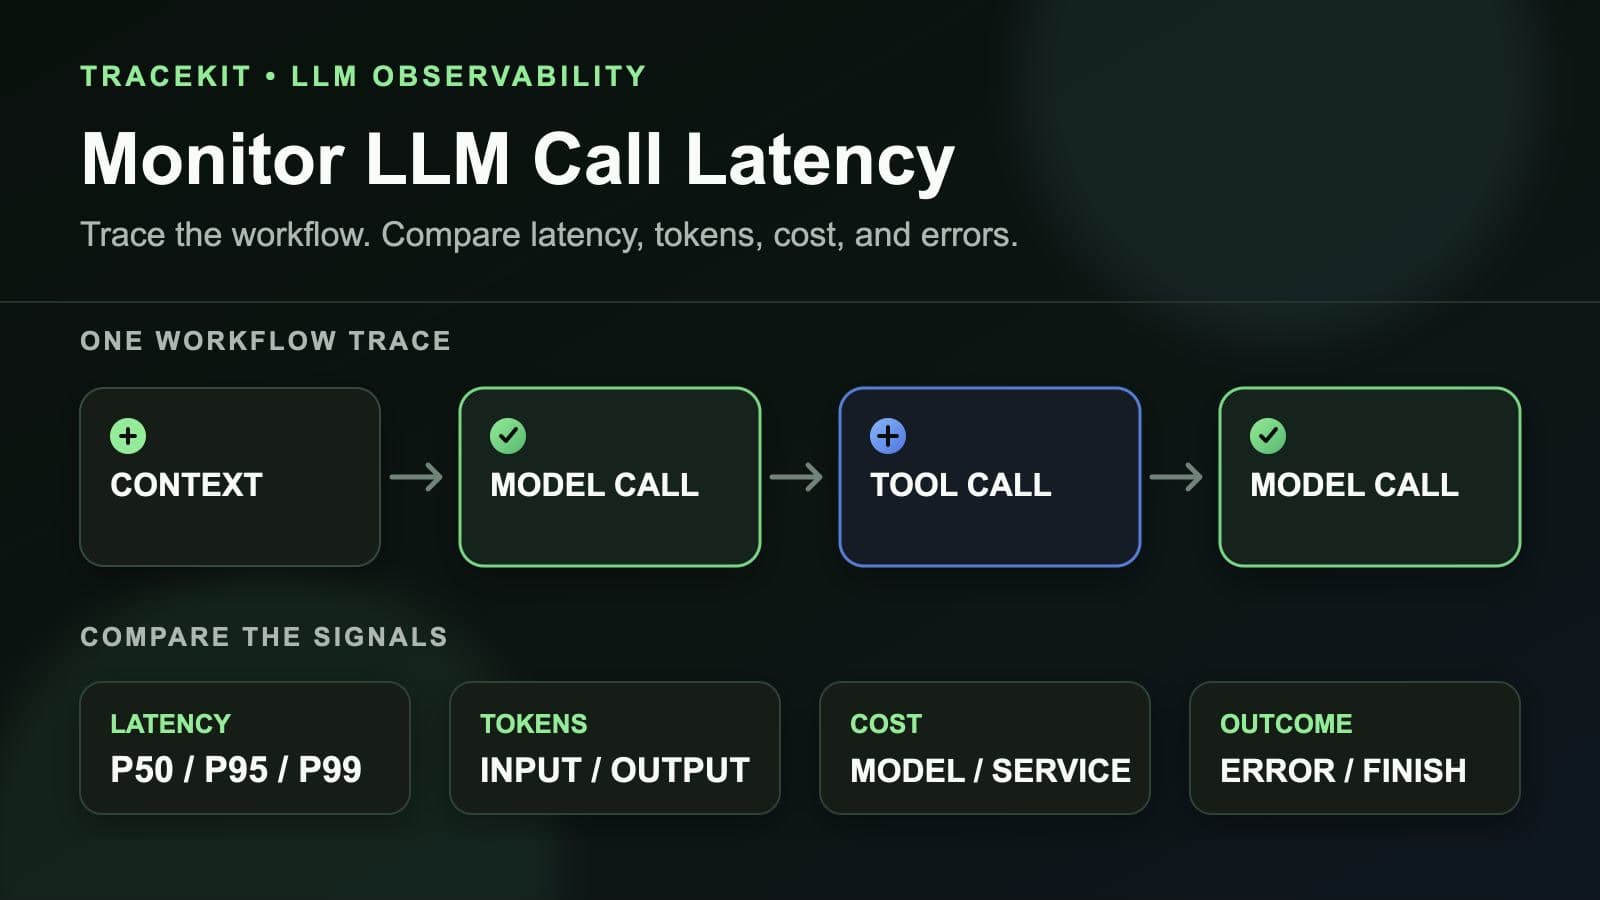
Monitor LLM call latency in production workflows with traces, model percentiles, token usage, costs, errors, and workflow context.
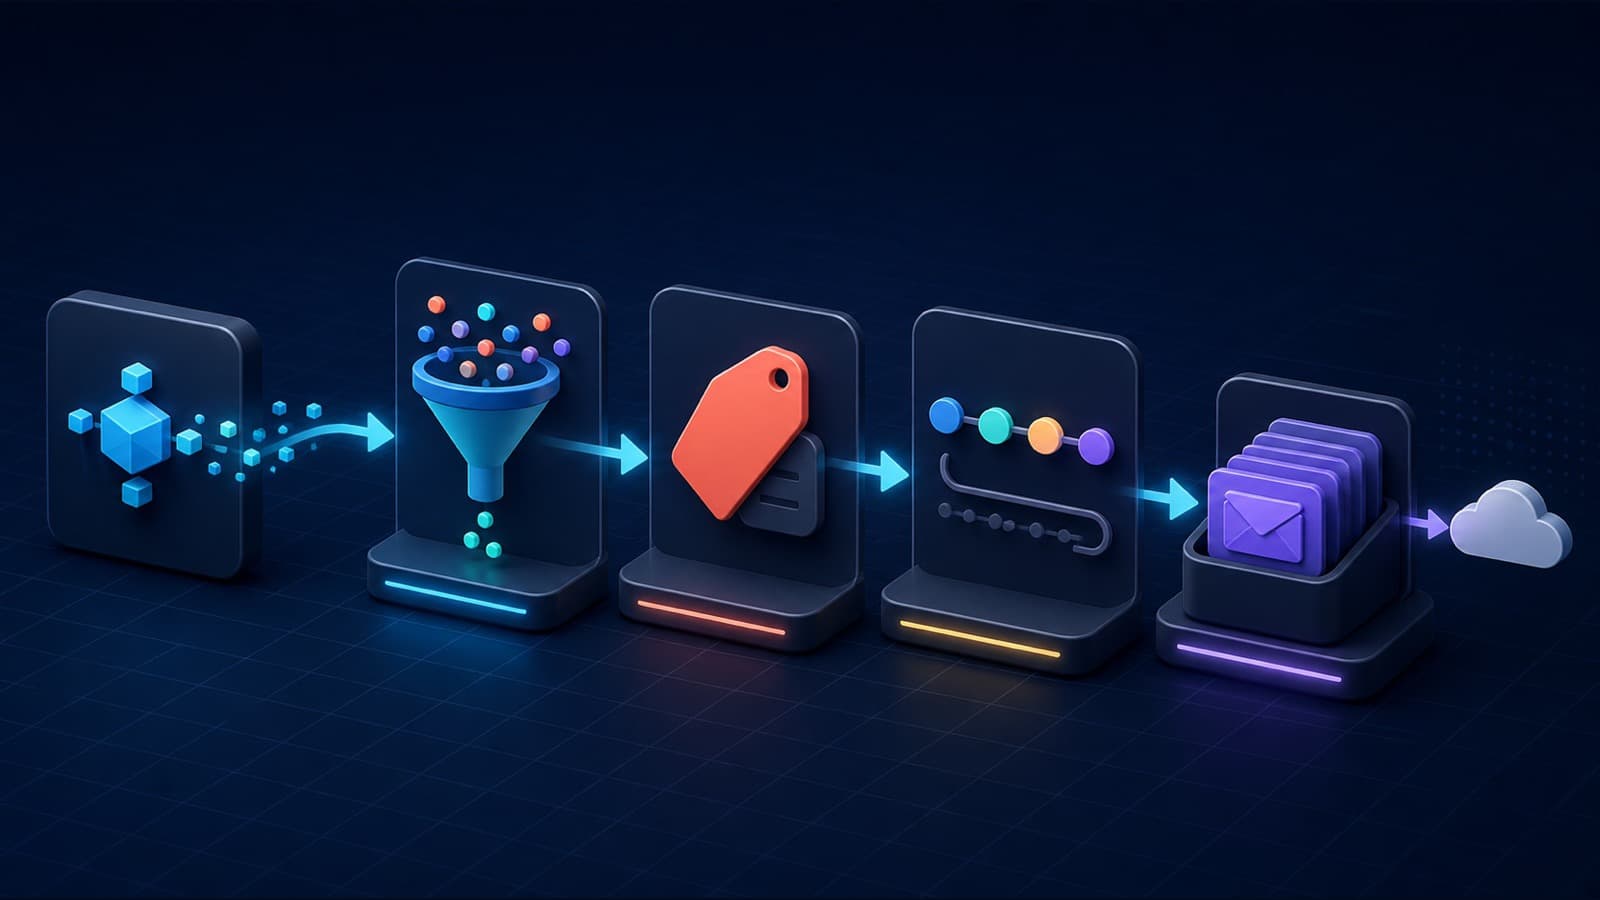
Configure the Sentry Go SDK for trace sampling, releases, environments, breadcrumbs, event filtering, request scope, and reliable delivery.
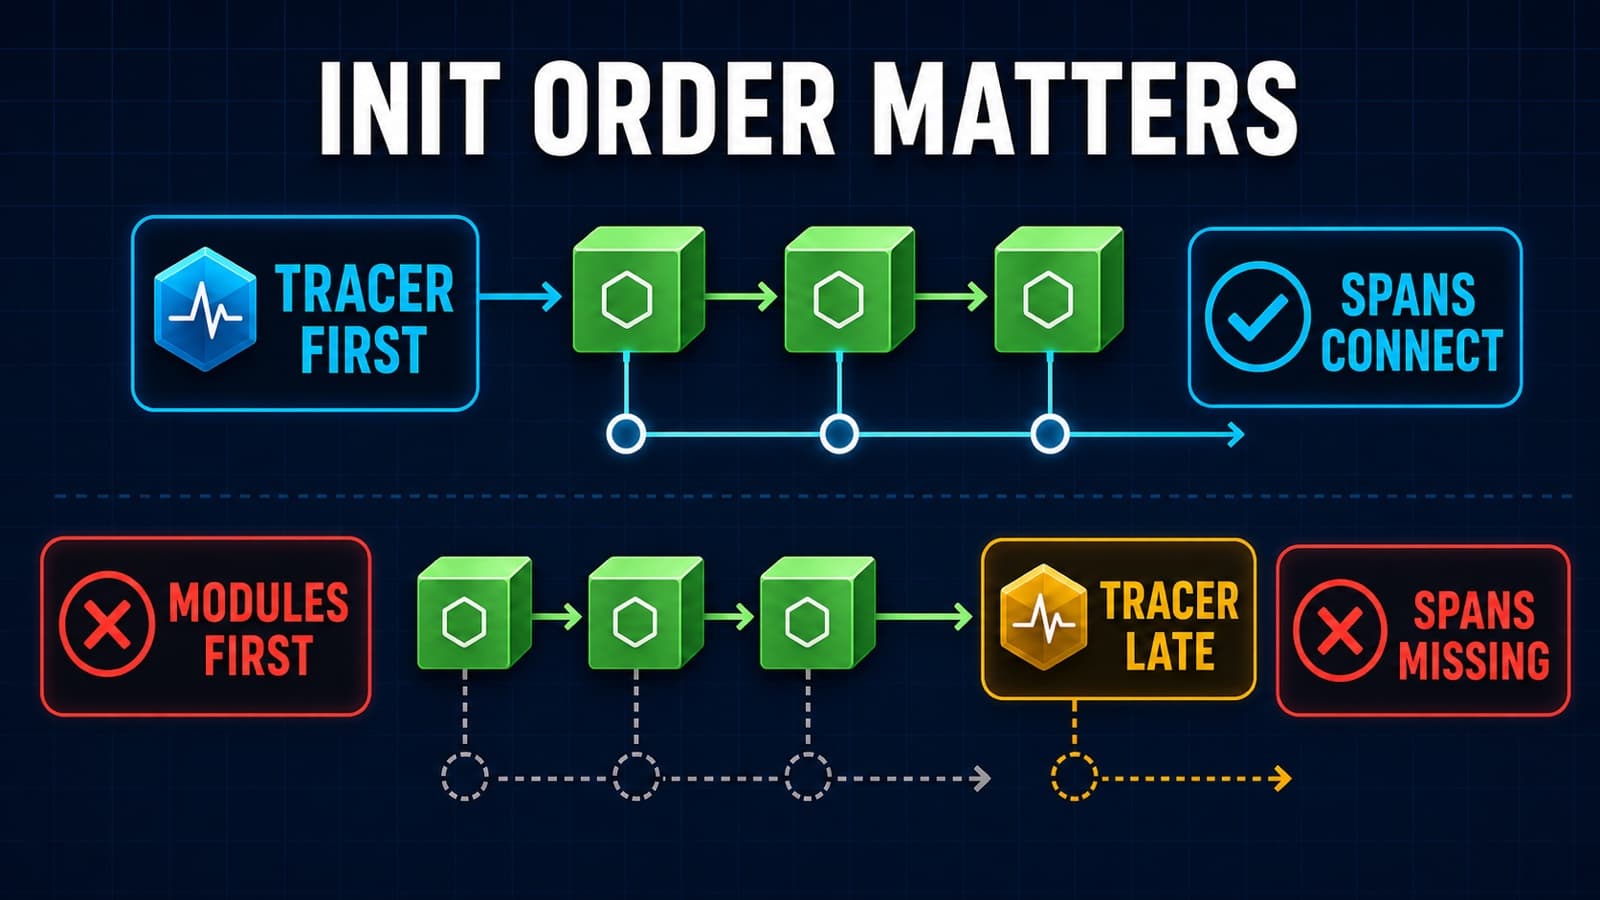
Fix dd-trace init order in Node.js with correct CommonJS, ESM, TypeScript, and bundler startup patterns when spans or routes disappear.
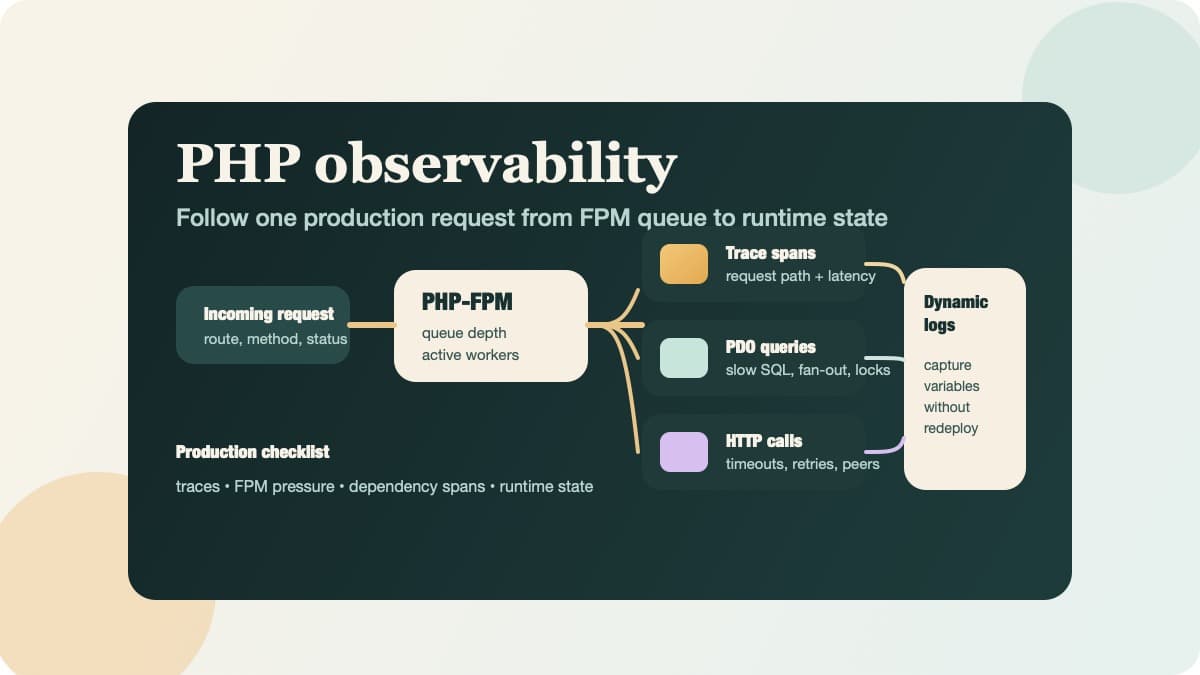
Use this PHP observability checklist to trace requests, surface PDO and HTTP bottlenecks, and inspect runtime state without redeploying.
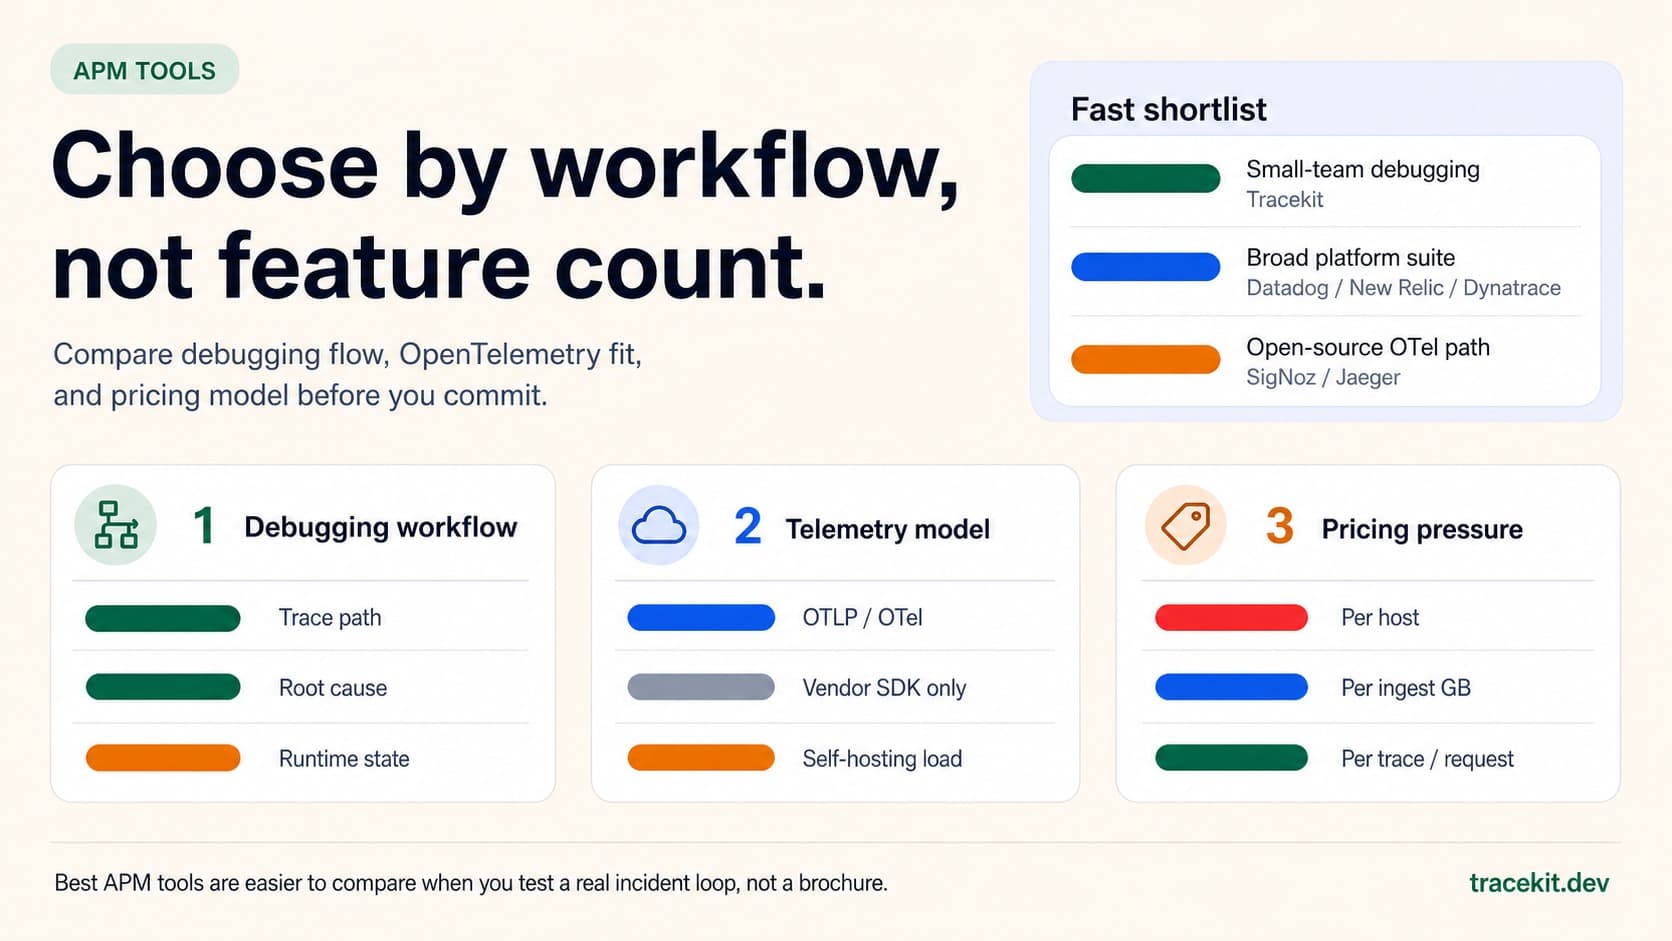
Compare the best APM tools for 2026 by debugging workflow, OpenTelemetry fit, pricing model, and runtime-state visibility.