
PHP Observability Checklist for Production Apps
Use this PHP observability checklist to trace requests, surface PDO and HTTP bottlenecks, and inspect runtime state without redeploying.
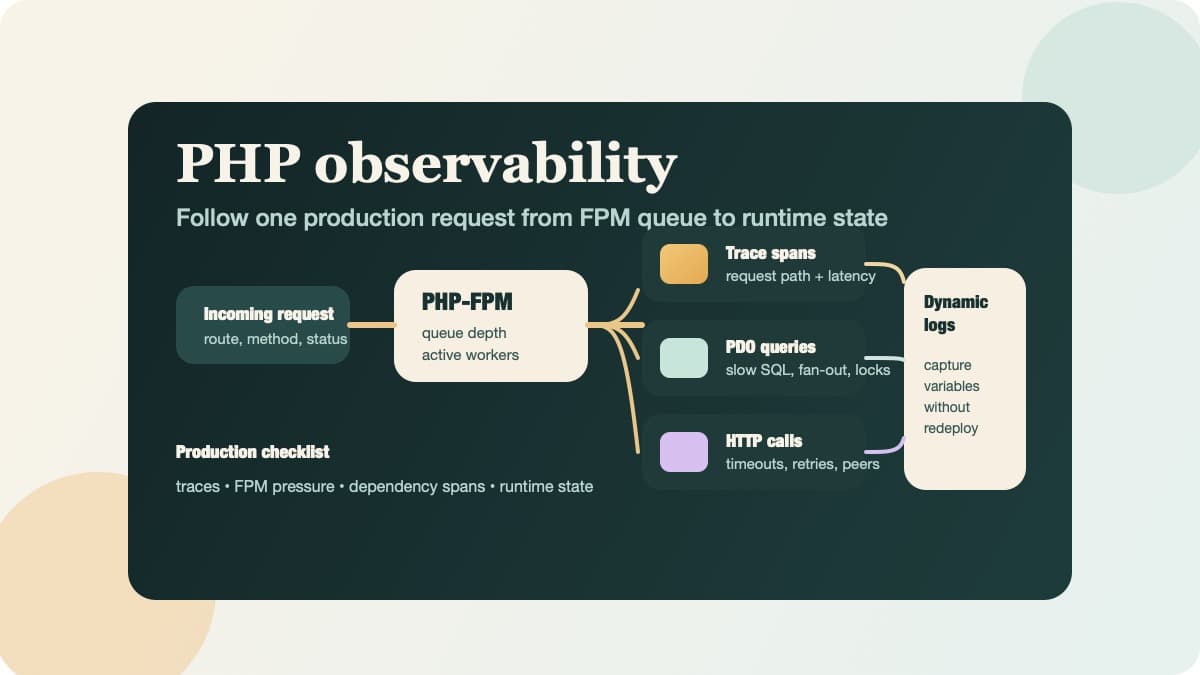
PHP observability should help you answer four production questions quickly: which request failed, which database query or downstream call burned the latency budget, whether PHP-FPM was saturated, and what runtime state explains the bad branch or payload. If your current setup can only tell you "the endpoint was slow" or "PHP-FPM had a backlog," you still have a gap between detection and debugging.
This guide targets the search intent behind php observability: a practical production checklist for traces, dependency visibility, PHP-FPM health, alerts, and runtime-state capture. It is grounded in Tracekit's current PHP SDK docs, dynamic logs docs, alerts docs, distributed tracing feature page, and the current tracekit/php-apm code. For the underlying platform behavior, it also lines up with the official docs for OpenTelemetry PHP, OpenTelemetry traces, and the PHP manual's FPM status page.
PHP Observability Checklist at a Glance
| Area | What to verify | Why it matters |
|---|---|---|
| Request traces | Every important request emits a span with route, method, status, duration, and trace context | You can isolate the failing path before touching code |
| Dependency spans | PDO work and outbound HTTP calls are visible beneath the request span | Slowdowns become diagnosable instead of speculative |
| PHP-FPM health | Queue depth, active workers, slow requests, and max-children pressure are visible | You can tell app latency from pool saturation |
| Runtime state | Dynamic logs can capture variables on suspicious paths without redeploying | You can explain the bad branch, not just the timing |
| Alerts | Error rate, latency, and low-traffic conditions reflect user impact | The on-call path starts with a useful clue |
| Lifecycle safety | Spans are flushed at request shutdown and long-running workers are treated separately | Prevents lost traces in PHP's share-nothing model |
1. Start with Request Traces and Shutdown Safety
The first job of PHP observability is simple: show the exact request, handler, or CLI job that went wrong. Tracekit's current PHP SDK supports that baseline with tracekit/php-apm, startTrace(), exception recording, and explicit flushing before the request exits.
<?php

require 'vendor/autoload.php';

use TraceKit\PHP\TracekitClient;

$tracekit = new TracekitClient([
    'api_key' => getenv('TRACEKIT_API_KEY'),
    'service_name' => getenv('TRACEKIT_SERVICE_NAME') ?: 'checkout-web',
    'endpoint' => 'https://app.tracekit.dev/v1/traces',
    'code_monitoring_enabled' => true,
]);

register_shutdown_function([$tracekit, 'flush']);

$request = $tracekit->startTrace('http-request', [
    'http.method' => $_SERVER['REQUEST_METHOD'] ?? 'GET',
    'http.route' => '/checkout',
    'http.url' => $_SERVER['REQUEST_URI'] ?? '/',
]);
That explicit flush() matters more in PHP than in many other runtimes. PHP-FPM and classic web PHP are share-nothing request lifecycles: once the request ends, unflushed spans are simply gone. Good PHP observability treats shutdown flushing as mandatory, not optional.
If you are still wiring up exporters or environment variables, the OTel config generator and the PHP SDK guide are the fastest starting points.
2. Separate Application Traces from PHP-FPM Pool Health
Tracing tells you what one request did. It does not replace the pool-level signals that explain why many requests started queuing at once.
The official PHP manual documents the FPM status page, including:
- accepted connections
- listen queue and max listen queue
- active and idle processes
- max children reached
- slow requests
- per-process request duration in full mode
That is a useful complement to traces because it helps you answer a different question:
- Are users waiting because one code path is slow?
- Or are users waiting because the FPM pool is saturated?
A practical PHP observability workflow usually combines both:
- request traces to identify the slow route or dependency
- FPM status to confirm whether the pool is backing up
- route or service metrics to see whether the problem is localized or broad
One important operational note from the PHP manual: keep the FPM status page restricted to internal traffic or known client IPs, because it exposes request and process details. Treat it as operational infrastructure, not a public endpoint.
3. Make PDO Queries and Outbound HTTP Calls Visible
Most PHP incidents are not "PHP is slow." They are one of these:
- one endpoint triggered too many database queries
- one PDO statement started scanning too much data
- one downstream API call timed out
- one payment, auth, or webhook dependency added seconds to the request
Tracekit's current PHP docs explicitly describe visibility for:
- incoming HTTP request spans
- database spans via the PDO wrapper
- outbound client spans via the HTTP client wrapper
- exception capture on active spans
That is the minimum useful dependency coverage for PHP observability. Your checklist should confirm that the spans underneath the request tell a coherent story:
- which query or query pattern dominated the request
- whether the latency lives in your code or in a downstream service
- whether the failure came from the DB layer, external HTTP, or the handler itself
If you use Laravel on top of PHP, continue with the Laravel observability guide and Laravel framework docs. If you are staying closer to vanilla PHP, Symfony, or Slim, the core rule is the same: visible child spans matter more than another high-level dashboard.
4. Treat PHP's Share-Nothing Lifecycle as an Observability Constraint
The official OpenTelemetry traces docs describe spans and context propagation as the building blocks of a trace. PHP makes this especially important because request work, CLI work, and worker-style processes often run in separate lifecycles.
Your PHP observability checklist should ask:
- Does each incoming request start with stable service and route metadata?
- Do outbound calls preserve trace context where instrumented?
- Do CLI jobs and long-running workers show up as their own execution units?
- Are you differentiating short-lived web requests from persistent worker processes?
This is where many PHP teams lose clarity. The web request trace looks normal, but the actual bottleneck lived in:
- a queue worker
- a scheduled CLI process
- a long-running daemon
- an HTTP dependency that was not instrumented
Tracekit's current PHP docs are explicit about the runtime boundary for dynamic-log control updates:
- CLI and worker-style processes can receive real-time updates through SSE
- web requests use polling fallback because the process-per-request model does not support a persistent connection
That distinction is not a minor implementation detail. It affects how quickly you can push new capture behavior into the code path you are debugging.
5. Use Dynamic Logs for Runtime State, Not Permanent Log Growth
Traces answer timing and path questions well. They do not always answer state questions like:
- What payload reached this branch?
- Which tenant setting changed the behavior?
- Which query parameters or headers made this request fail?
- Why did one checkout path choose the wrong rule?
This is where Tracekit dynamic logs fit. The current PHP SDK supports captureSnapshot() and pollBreakpoints() when code monitoring is enabled.
<?php

$tracekit->captureSnapshot('checkout-validation', [
    'user_id' => $userId,
    'cart_items' => count($cart['items'] ?? []),
    'total_amount' => $cart['total'] ?? 0,
    'coupon_code' => $cart['coupon_code'] ?? null,
]);

// Poll on a small percentage of requests or via cron for web PHP.
if (rand(1, 100) <= 5) {
    $tracekit->pollBreakpoints();
}
That is the right mental model for PHP observability:
- Keep your normal application logs in Monolog or your existing logger.
- Use traces to find the suspicious path.
- Use dynamic logs to capture the missing runtime state on that path.
This is also where Tracekit is intentionally different from generic log-ingestion positioning. Dynamic logs are bounded capture points, not "store every variable forever."
For the broader workflow, use the dynamic logs docs together with distributed tracing: trace first, then capture the state that explains the trace.
6. Add Metrics Where One Trace Is Not Enough
One trace explains one request. Production decisions usually need trend data too.
Tracekit's current PHP SDK and example app expose custom counters and gauges, which is useful for signals that are not obvious from request traces alone:
- request volume
- active requests
- error counts
- cache-hit counters
- queue backlog or worker progress
Use custom metrics for trends and saturation. Use traces for causality. Use dynamic logs when you still need the code-level state. That layering is what makes PHP observability useful instead of noisy.
7. Alert on User Impact
PHP observability is incomplete if it can show a beautiful trace after an incident but cannot wake the right person up with a useful threshold.
Start with alerts around:
- 5xx rate by route or service
- p95 or p99 latency regressions
- sustained FPM queue growth or max-children pressure
- sudden drop to zero traffic where traffic is expected
- release-linked regressions after deployment
The bar for a useful alert is simple: it should give the responder a productive first hop. Ideally that is the affected route, the suspicious dependency, the overloaded FPM pool, or the release that changed behavior. If the alert only says "PHP is slow," the observability setup still needs work.
PHP Observability Release Checklist
Before you call your setup production-ready, confirm:
- Important routes emit traces with stable route, method, and status metadata.
- PDO-heavy paths surface child spans or clearly instrumented DB work.
- Outbound HTTP calls are visible under the parent request.
- PHP-FPM queue, worker, and slow-request pressure are visible through the status page or equivalent metrics.
-
flush()runs reliably before request shutdown. - Dynamic logs are enabled on the services that need runtime-state capture.
- Web requests poll for capture-point updates, and long-running workers are treated separately where needed.
- Error-rate and latency alerts reflect user impact, not vanity averages.
If you cannot check those boxes, the next production incident will probably force you to fill the gaps under pressure.
Where Tracekit Fits
| Need | Recommended starting point |
|---|---|
| PHP setup and SDK usage | PHP SDK docs |
| Request and dependency traces | Distributed tracing |
| Runtime state without redeploying | Dynamic logs docs |
| Framework-specific PHP setup | Laravel docs |
| Exporter/bootstrap help | OTel config generator |
| Alert workflows | Alerts docs |
The goal of PHP observability is not just to collect traces, metrics, or PHP-FPM counters. The goal is to answer a production question with evidence: which request failed, which dependency or pool bottleneck caused it, and what runtime state proves why the code behaved that way.
Related Posts
Zero-Cost Production Visibility: APM Without the Datadog Bill
Get production visibility without the Datadog bill. Free-tier APM setup with OpenTelemetry for freelancers and small teams who need traces, not invoices.
Migrate to OpenTelemetry Without Downtime
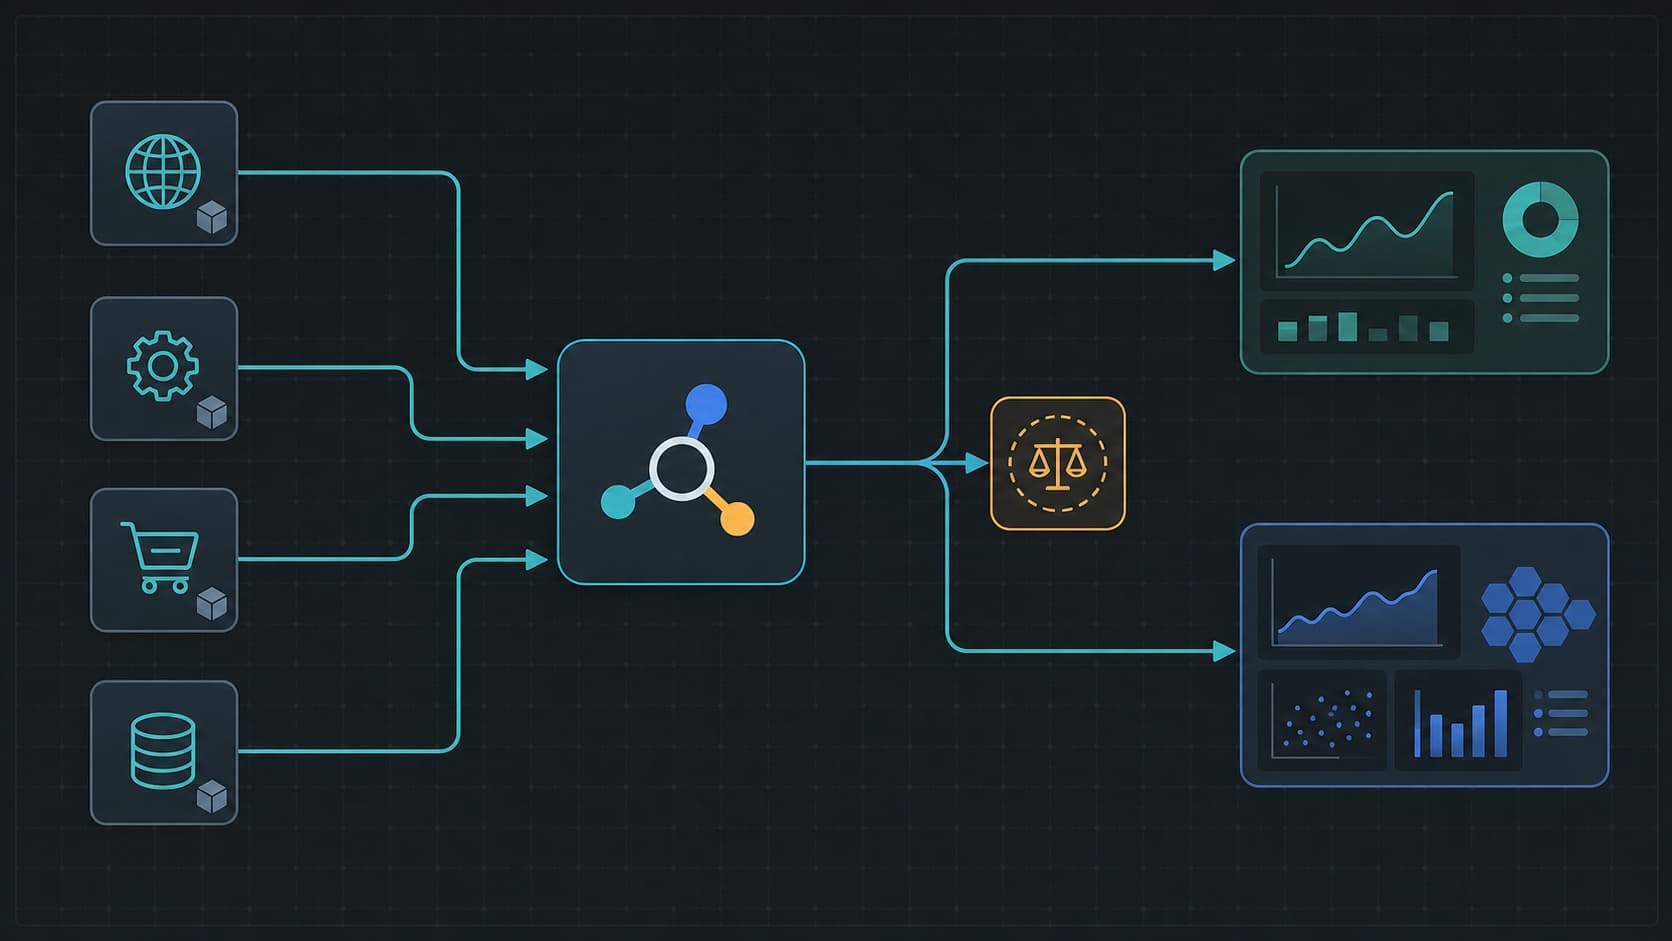
Migrate to OpenTelemetry without downtime with a parallel Collector path, trace parity checks, and a safe service-by-service cutover.
Best APM Tools for 2026: What to Compare Before You Commit
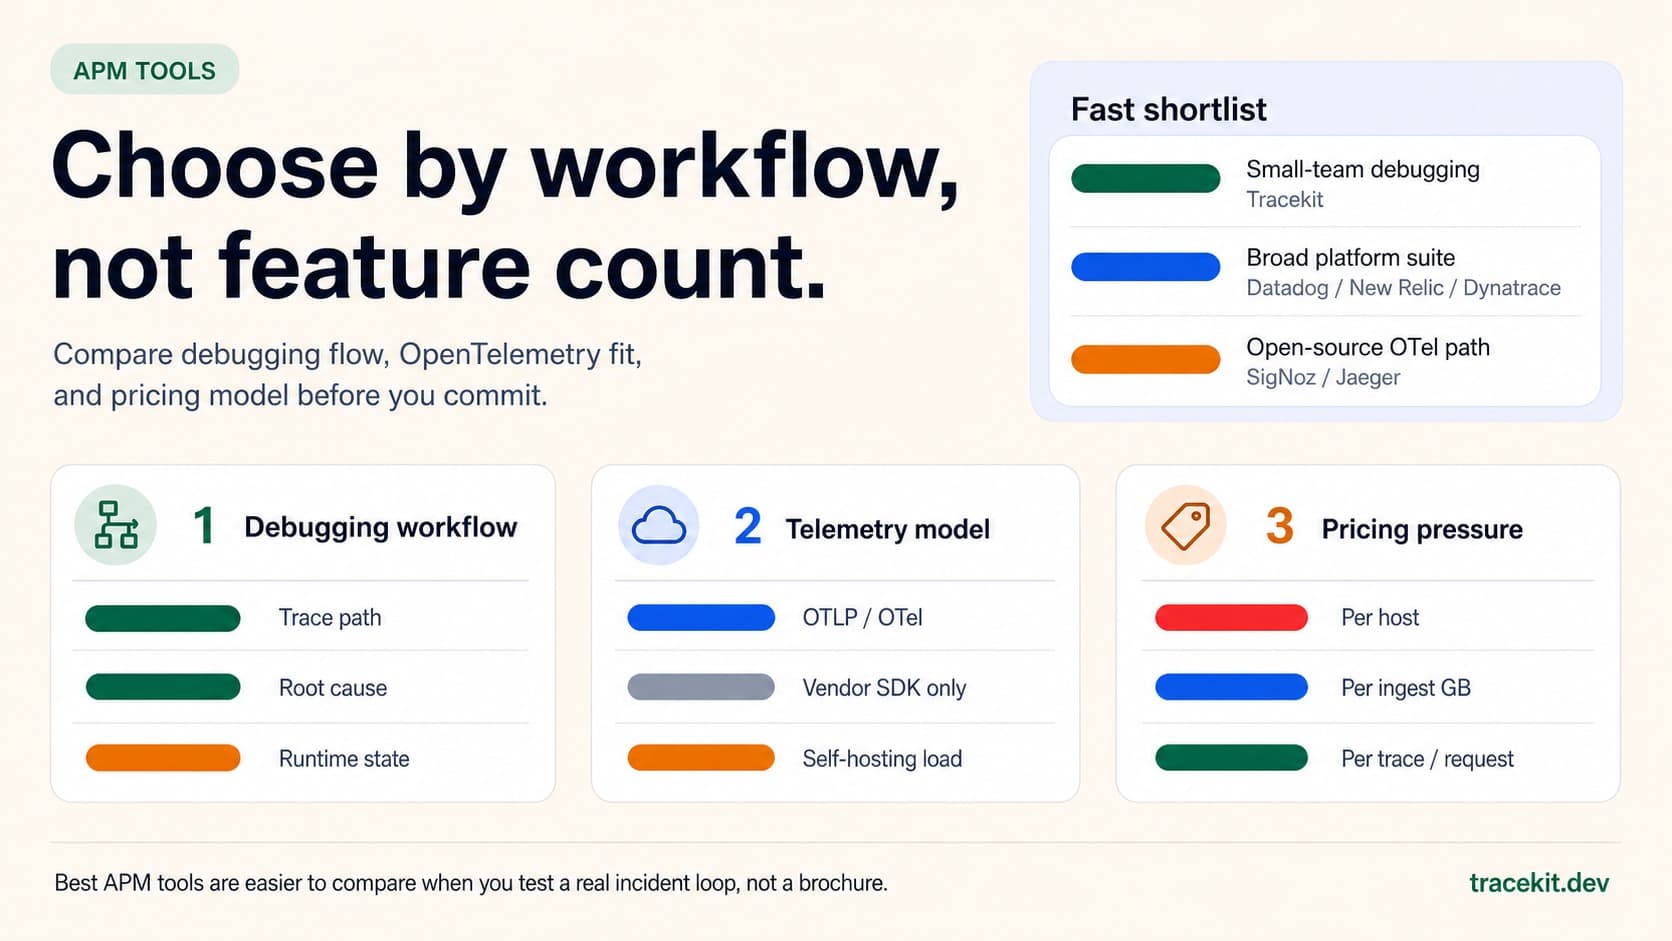
Compare the best APM tools for 2026 by debugging workflow, OpenTelemetry fit, pricing model, and runtime-state visibility.