
OpenTelemetry PHP Auto-Instrumentation for Laravel
Set up OpenTelemetry PHP auto-instrumentation for Laravel, configure OTLP before autoload, and verify request, SQL, and queue trace boundaries.
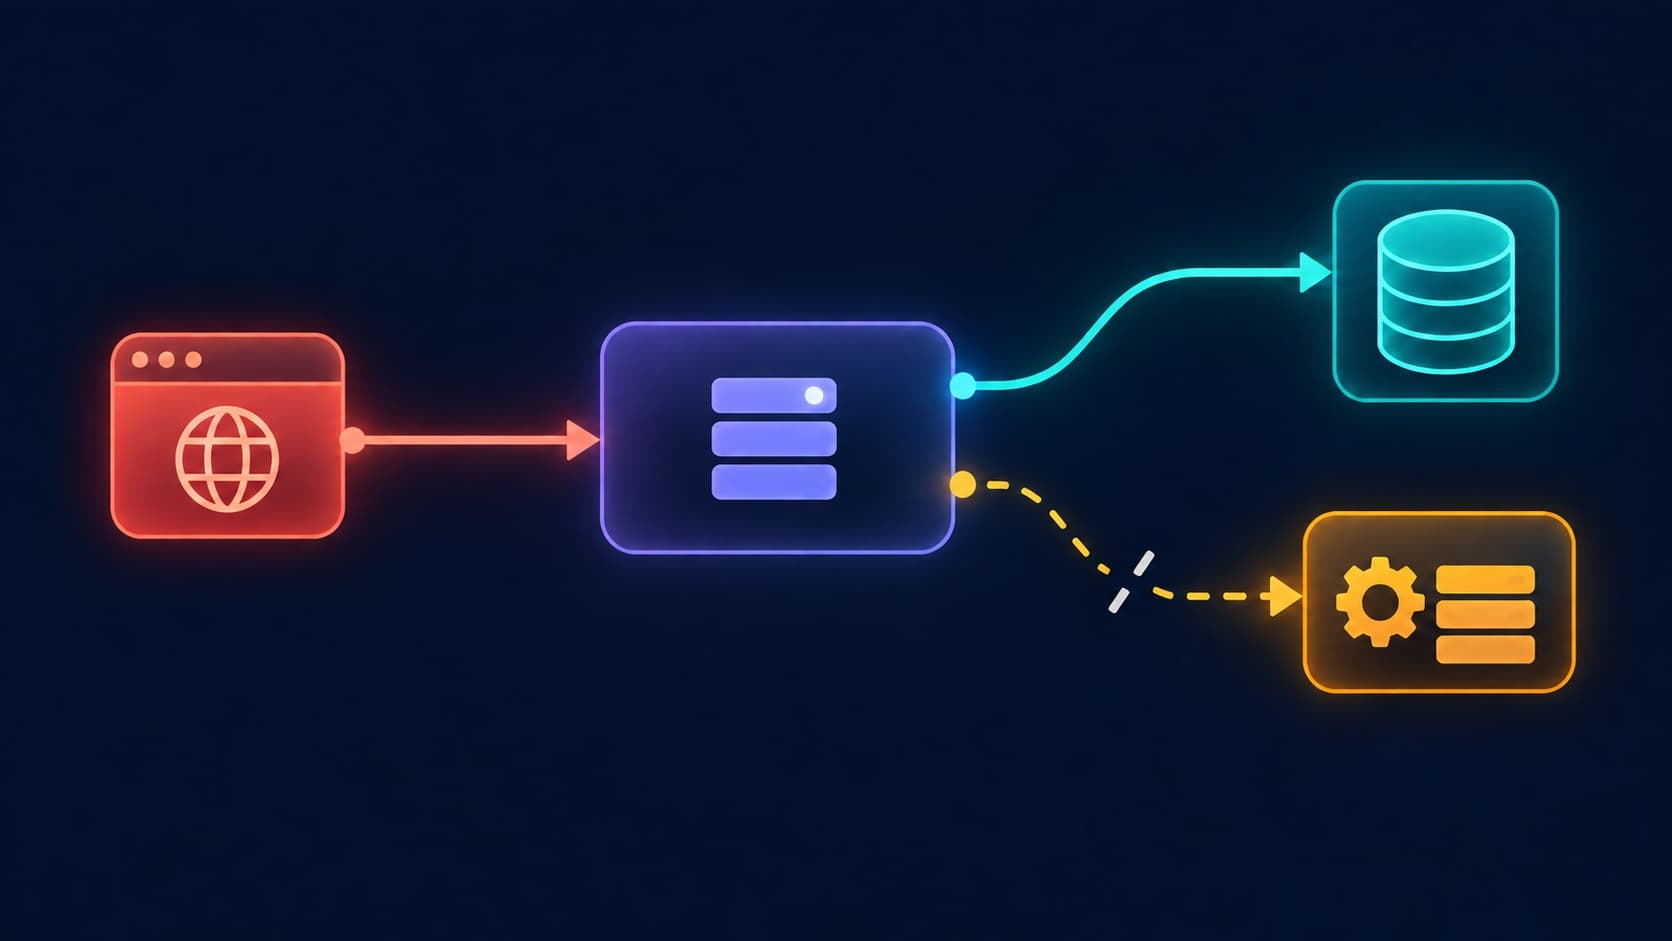
To add OpenTelemetry PHP auto-instrumentation to Laravel, load the PHP extension, install the SDK and Laravel instrumentation, then configure an OTLP exporter before Composer autoload runs. Verify a real request and its database work. Queue jobs need a separate check: seeing a worker span does not prove that its trace continues the request that dispatched it.
This guide covers the vendor-neutral OpenTelemetry PHP path. If you prefer the Tracekit Laravel package, use the separate Laravel package setup guide. Do not enable both paths for the same request without testing for duplicate spans.
Know what each component does
| Component | Purpose | Check before release |
|---|---|---|
| PHP extension | Provides hooks for installed instrumentation | Loaded in the web and worker PHP runtimes |
| SDK and Laravel library | Creates and processes spans | Composer autoload and actual request spans |
| OTLP exporter | Sends spans to a Collector or compatible backend | Endpoint, protocol, and transport |
The OpenTelemetry PHP auto-instrumentation guide says the PHP extension alone does not generate traces. You also need the SDK, an instrumentation library, and an exporter. The Laravel instrumentation package is one available library.
Install OpenTelemetry PHP for Laravel
Check that PHP loads the OpenTelemetry extension in the same runtime that serves HTTP requests and runs queue workers:
php --ri opentelemetry
Install the SDK, Laravel instrumentation, OTLP exporter, and an HTTP client implementation in your Laravel application:
composer require open-telemetry/sdk open-telemetry/opentelemetry-auto-laravel \
  open-telemetry/exporter-otlp php-http/guzzle7-adapter
Set these variables in the PHP process environment before Composer autoload runs. A Laravel .env file may load too late for PHP auto-instrumentation, so verify the values in PHP-FPM and worker processes.
OTEL_PHP_AUTOLOAD_ENABLED=true
OTEL_SERVICE_NAME=checkout-web
OTEL_TRACES_EXPORTER=otlp
OTEL_EXPORTER_OTLP_PROTOCOL=http/protobuf
OTEL_EXPORTER_OTLP_ENDPOINT=http://collector:4318
OTEL_PROPAGATORS=tracecontext,baggage
Replace http://collector:4318 with your actual Collector address. That address is an example, not a Tracekit cloud endpoint. For OTLP/HTTP, a base endpoint appends the signal path, such as /v1/traces. A signal-specific endpoint uses its explicit path. The OpenTelemetry exporter configuration explains the difference.
Restart web and queue processes after the configuration change. Send one test request and inspect the Collector or backend. If you see no span, check extension loading, the process environment, exporter connectivity, and sampling before changing application code.
Do not assume that Laravel instrumentation covers every database driver, HTTP client, or queue boundary. Install the matching libraries where needed. Check each span in the trace instead of relying on a package name. The OpenTelemetry PHP exporter guide covers the OTLP package and transport.
If you use Tracekit instead
The Tracekit Laravel package guide describes a separate path with its own middleware, SQL listener, and queue listener. If you choose it, follow the package-specific production checklist instead of adding a second provider to this setup. The package's job listener starts a new trace for a job. It does not, by itself, prove parent-context propagation from the dispatching request.
Tracekit can display incoming OTLP traces in its traces view. Confirm the Collector's export path and authentication using your deployment configuration. This article does not assume that a local Collector address is the Tracekit cloud endpoint.
Keep dynamic logs distinct from regular application logs. Dynamic logs use bounded capture points to inspect runtime state. They are not a general log-ingestion pipeline.
Verify the whole request path
Use a real endpoint that reads data and calls one downstream service. Record a safe test marker, then inspect the resulting trace:
- Find the server span for the request. Check route, status, duration, and service name.
- Confirm that its SQL span appears below the request. A lone request span cannot explain database delay.
- Confirm that instrumented outbound work has a child span and forwards trace context to the next service.
- Dispatch a test queue job. Find its worker span, then check whether it shares the request trace ID. Do not assume this from timestamps.
- Confirm that exception information and release metadata appear only when your instrumentation sends them.
If the worker starts a new trace, pass context through the message boundary with supported instrumentation or explicit propagation. The OpenTelemetry context guide explains why context must cross process boundaries. Laravel exposes queue events and job middleware, which give you places to add and verify that propagation. Avoid putting raw credentials or personal data in span attributes.
For a second view of the problem, use the Laravel production debugging guide. For slow database paths, use the N+1 query investigation guide. You can also compare a complete request in the Tracekit trace viewer guide.
Troubleshooting checklist
| Symptom | First check |
|---|---|
| No spans | PHP extension, SDK, process environment, and exporter connectivity |
| Request span without SQL work | Database instrumentation or query listener; actual query executed in the test request |
| Duplicate request spans | Two instrumentation paths or duplicate middleware registration |
| Separate worker trace | Missing context injection at dispatch or extraction in the worker |
| Traces vanish under load | Sampling, exporter errors, Collector reachability, and worker restarts |
Start with one path and one known request. Once its spans are correct, add the next dependency and verify the trace again.
Related Posts
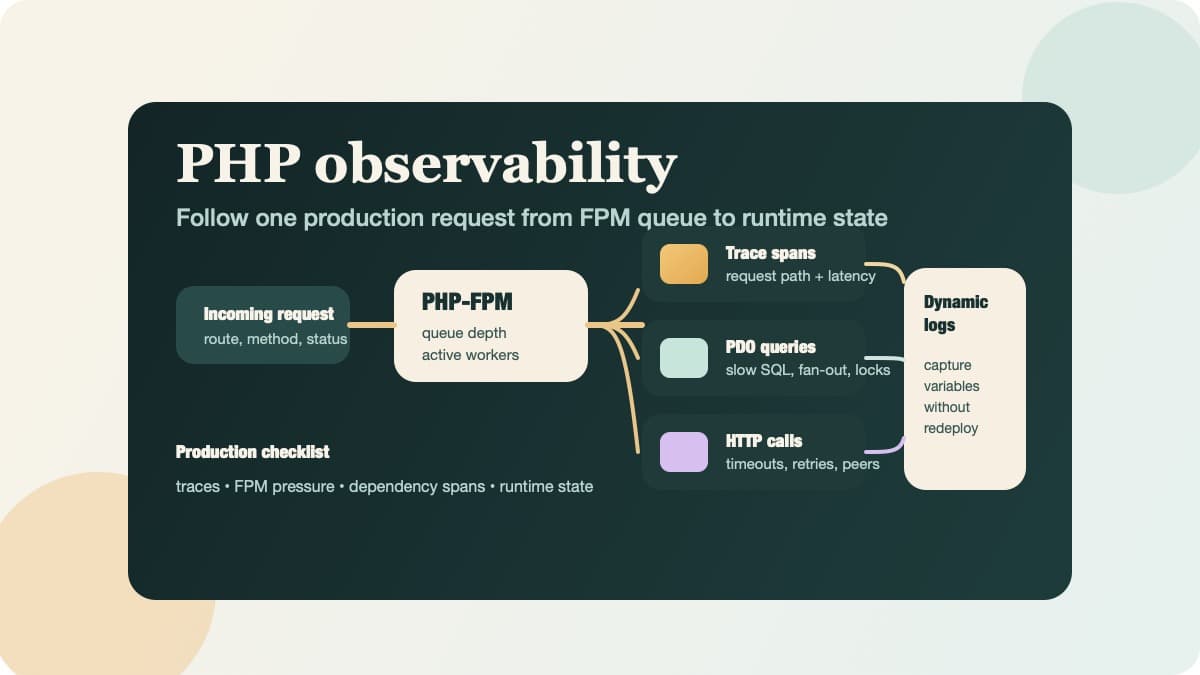
PHP Observability Checklist for Production Apps
Use this PHP observability checklist to trace requests, surface PDO and HTTP bottlenecks, and inspect runtime state without redeploying.
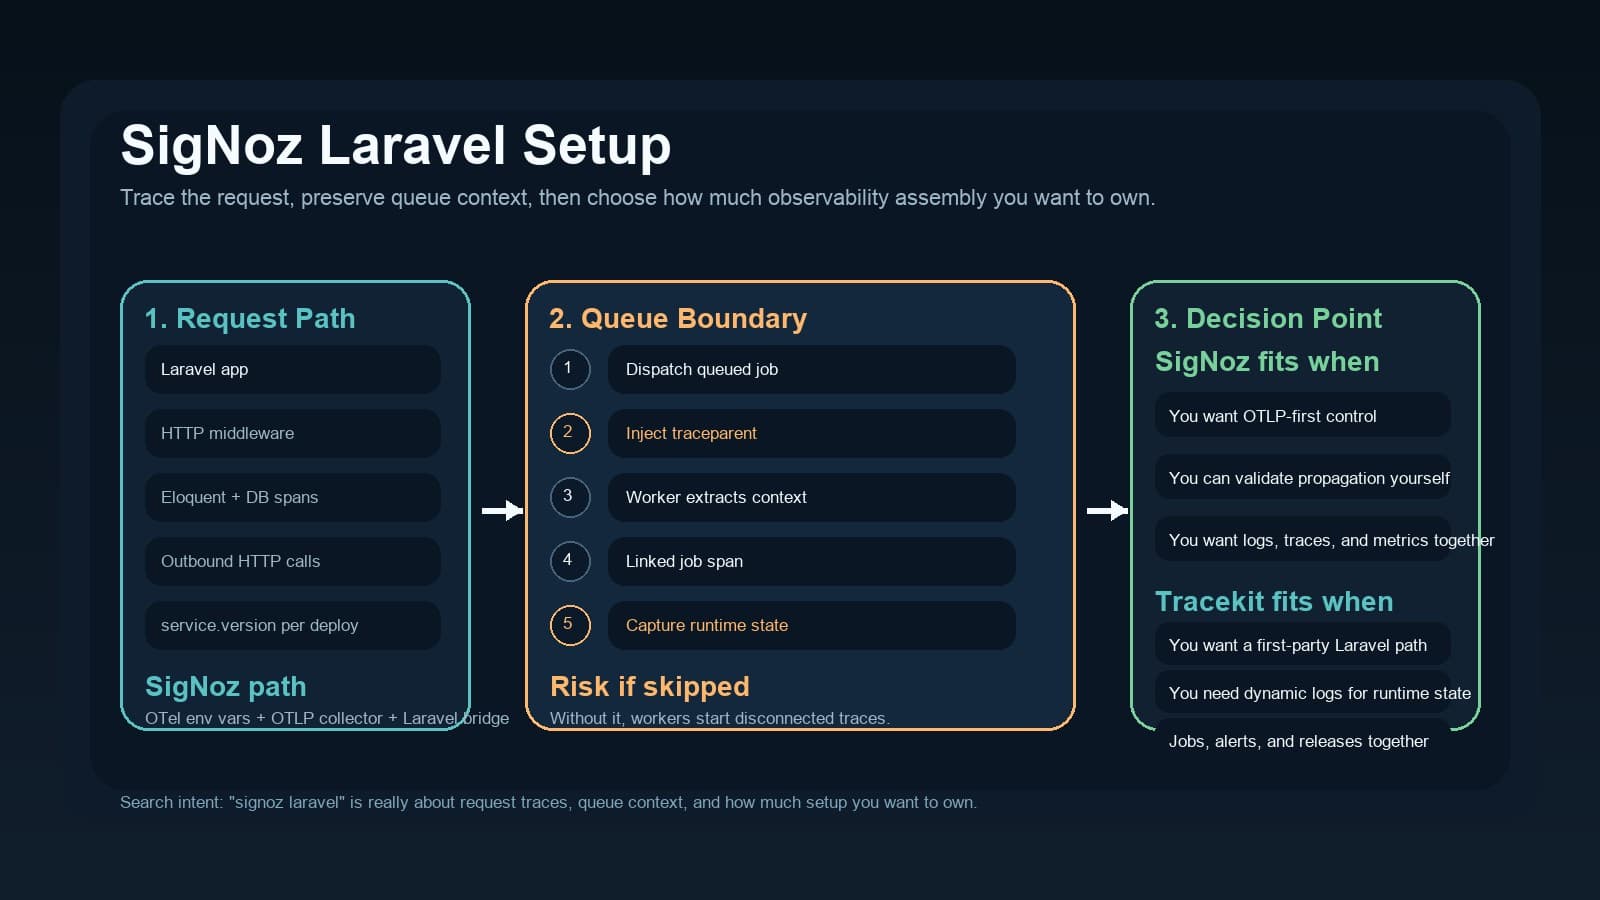
SigNoz Laravel Setup: OpenTelemetry, Queue Context, and a Managed APM Alternative
Use this SigNoz Laravel guide to wire OpenTelemetry, keep queue context intact, and compare that setup with a managed Laravel APM path.
Zero-Cost Production Visibility: APM Without the Datadog Bill
Get production visibility without the Datadog bill. Free-tier APM setup with OpenTelemetry for freelancers and small teams who need traces, not invoices.