
8 min
Debugging Gin Apps: Tracing and Performance Tips
Debug Gin framework apps in production with OpenTelemetry tracing, pprof profiling, GORM query optimization, and structured logging for Go services.
golanggin
Engineering insights on observability, distributed tracing, and production debugging.
Debug Gin framework apps in production with OpenTelemetry tracing, pprof profiling, GORM query optimization, and structured logging for Go services.

Monitor Python apps in real time with OpenTelemetry and TraceKit. Track latency, error rates, and resource usage with auto-instrumentation and tracing.
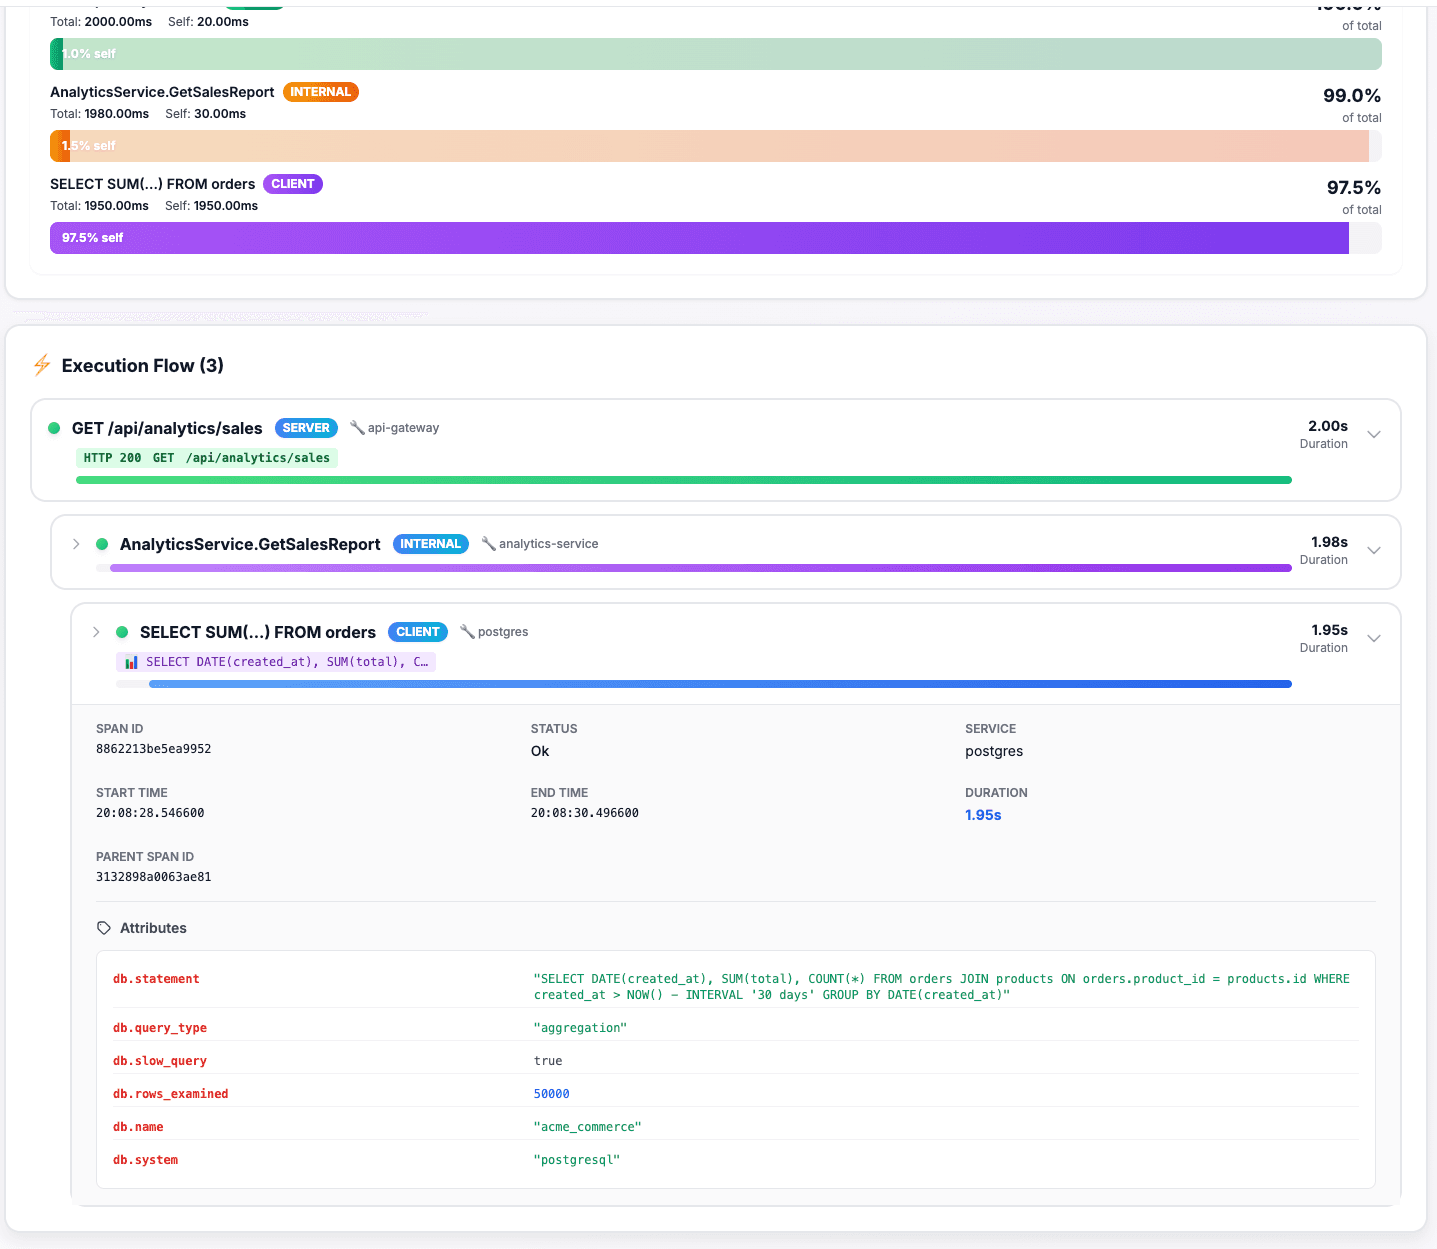
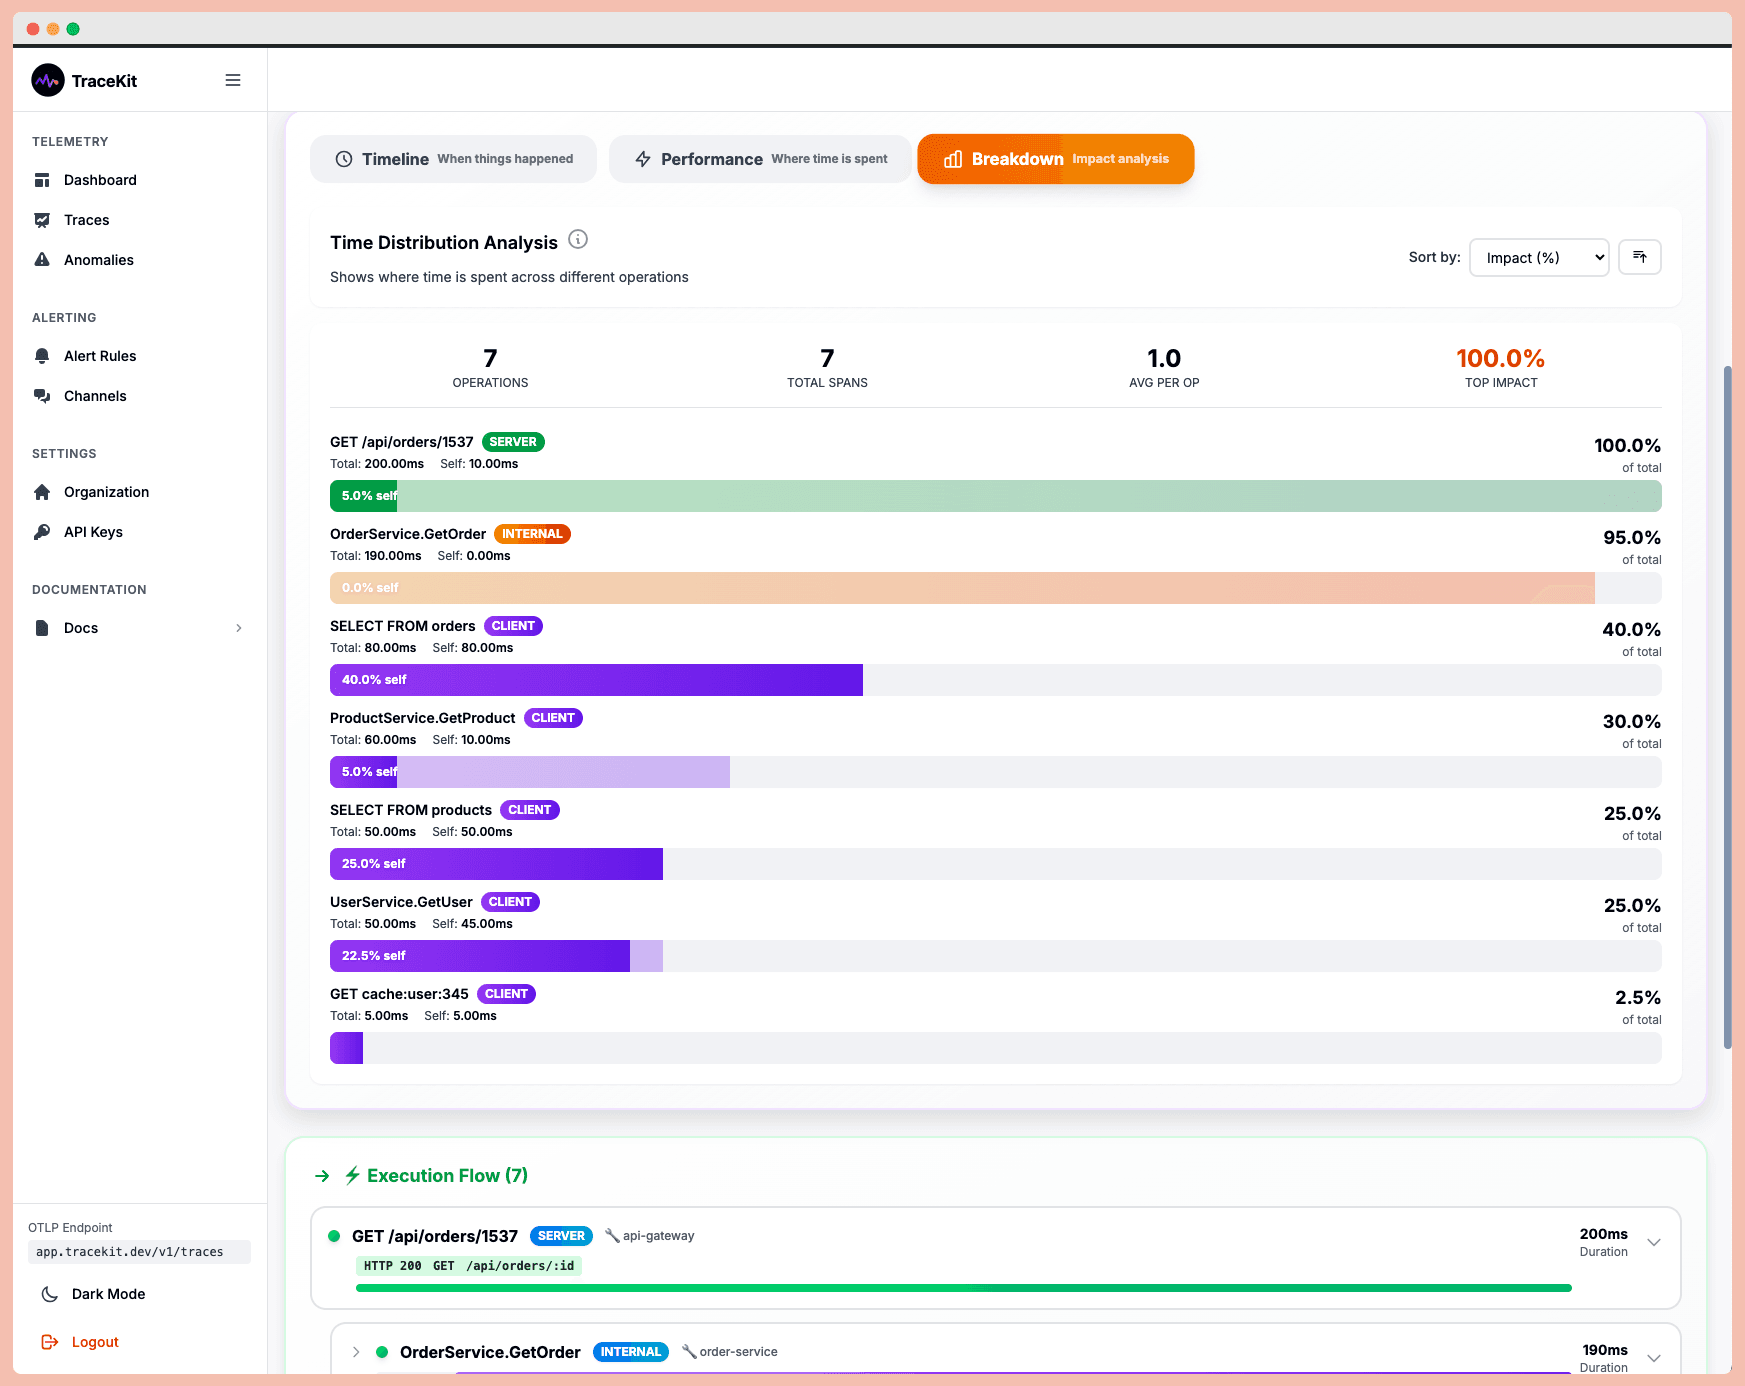
Detect and fix N+1 query problems in Laravel, Django, Rails, and Node.js. Auto-find the database queries slowing your app and cut query count by 90%.
Read flame graphs to find performance bottlenecks in 30 seconds. Visual guide with real examples covering CPU profiling, N+1 queries, and optimization.