
Sentry Go SDK Advanced Configuration Guide
Configure the Sentry Go SDK for trace sampling, releases, environments, breadcrumbs, event filtering, request scope, and reliable delivery.
If you need Sentry Go SDK advanced configuration, a DSN is only the start. Production setup also needs deliberate trace sampling, release and environment metadata, request-safe context, useful breadcrumbs, event filtering, and a reliable shutdown path.
This guide uses the current getsentry/sentry-go API. It shows which options belong in sentry.Init, which data belongs on a request scope, and which checks prove that events leave the process.
A production baseline
Start with a small configuration that makes every important decision visible:
package monitoring

import (
    "os"
    "time"

    "github.com/getsentry/sentry-go"
)

func InitSentry() error {
    err := sentry.Init(sentry.ClientOptions{
        Dsn:              os.Getenv("SENTRY_DSN"),
        Release:          os.Getenv("SENTRY_RELEASE"),
        Environment:      os.Getenv("SENTRY_ENVIRONMENT"),
        EnableTracing:    true,
        TracesSampleRate: 0.20,
        MaxBreadcrumbs:   100,
        AttachStacktrace: true,
    })
    if err != nil {
        return err
    }

    return nil
}

func FlushSentry() bool {
    return sentry.Flush(2 * time.Second)
}
Set the environment variables in your deployment system:
SENTRY_DSN=https://public-key@your-sentry-host/project-id
[email protected]
SENTRY_ENVIRONMENT=production
Do not commit a real DSN to the repository. Keep the same release identifier across the build, deployment record, and running service.
The official Sentry Go options reference documents these fields. The SDK also reads SENTRY_DSN, SENTRY_RELEASE, and SENTRY_ENVIRONMENT when the matching options are empty.
Choose one trace sampling strategy
Tracing can create much more data than error capture. Set a policy before traffic grows.
Fixed sampling with TracesSampleRate
Use TracesSampleRate when every new root transaction can use one probability:
sentry.ClientOptions{
    EnableTracing:    true,
    TracesSampleRate: 0.20,
}
The value must stay between 0.0 and 1.0. A rate of 0.20 samples about one fifth of eligible root transactions over time. It does not guarantee one sampled transaction in each group of five.
Route-aware sampling with TracesSampler
Use TracesSampler when health checks, checkout routes, and normal traffic need different treatment:
sentry.ClientOptions{
    EnableTracing: true,
    TracesSampler: sentry.TracesSampler(func(ctx sentry.SamplingContext) float64 {
        switch ctx.Span.Name {
        case "GET /health", "GET /ready":
            return 0.0
        case "POST /checkout":
            return 1.0
        default:
            return 0.20
        }
    }),
}
Sentry's official sampling guide covers both options. The SDK evaluates TracesSampler before TracesSampleRate, so configure one strategy instead of setting both.
Use the fixed rate when you need a simple cost control. Use the sampler when route value or traffic volume differs. In either case, confirm that upstream sampling decisions propagate through your services.
Set release and environment on every process
Release metadata answers a specific question: did this error start after a deploy?
Use one stable value for all replicas of the same build:
sentry.ClientOptions{
    Release:     os.Getenv("SENTRY_RELEASE"),
    Environment: os.Getenv("SENTRY_ENVIRONMENT"),
}
Good release values are immutable. A Git commit SHA, image digest, or version plus build number works better than latest.
Keep environment values low-cardinality and consistent. Prefer production, staging, and development. Do not put a pod name or request identifier in Environment.
Sentry's release configuration guide explains release naming and environment association. Release data becomes unreliable when different services reuse vague version names.
Keep request context isolated
Go servers handle requests concurrently. Request tags must stay on the request's hub and scope.
When you use Sentry's HTTP middleware, retrieve the hub from r.Context():
func captureOrderError(r *http.Request, err error, orderID, customerTier string) {
    hub := sentry.GetHubFromContext(r.Context())
    if hub == nil {
        return
    }

    hub.WithScope(func(scope *sentry.Scope) {
        scope.SetTag("customer.tier", customerTier)
        scope.SetContext("order", sentry.Context{
            "id": orderID,
        })
        hub.CaptureException(err)
    })
}
WithScope makes the extra data temporary. The tags and context leave with this capture instead of leaking into later requests.
Avoid calling the global sentry.ConfigureScope inside a busy request handler. A process-wide scope can mix request data when concurrent work mutates it.
For background jobs, clone a hub or pass an isolated hub with the job context. Also propagate trace context when the job continues work from an HTTP request.
Add breadcrumbs that explain decisions
Breadcrumbs work best when they record meaningful application decisions. They should not copy every normal log line.
hub.AddBreadcrumb(&sentry.Breadcrumb{
    Category: "checkout.validation",
    Message:  "Order failed the inventory check",
    Level:    sentry.LevelInfo,
    Data: map[string]interface{}{
        "order_id": orderID,
        "warehouse": warehouse,
    },
}, nil)
Useful breadcrumb categories include:
- authentication decisions;
- retry and fallback paths;
- payment state changes;
- queue publication results;
- feature-flag decisions;
- calls to important dependencies.
Avoid secrets, authorization headers, session tokens, full payment details, and unbounded payloads. The official breadcrumbs guide shows the Go API.
MaxBreadcrumbs sets the per-event limit. The current SDK default is 100, but an explicit value makes your policy easy to review.
Filter and scrub before delivery
Use BeforeSend as a final control for error events:
sentry.ClientOptions{
    BeforeSend: func(event *sentry.Event, hint *sentry.EventHint) *sentry.Event {
        delete(event.Extra, "access_token")
        delete(event.Extra, "authorization")

        if event.Level == sentry.LevelDebug {
            return nil
        }

        return event
    },
}
Returning nil drops the event. Keep the callback fast and deterministic because it runs in the capture path.
BeforeSend handles error events. Use BeforeSendTransaction when you must modify or reject transactions. Do not assume one callback filters every event type.
Application filtering is a second safety layer. It does not replace data minimization at the source. Capture only fields that help an investigation.
Flush before short-lived processes exit
The default HTTP transport sends events from a background worker. A command, migration, or queue worker can exit before that worker finishes.
Use defer in a process with a normal return path:
func main() {
    if err := monitoring.InitSentry(); err != nil {
        panic(err)
    }
    defer sentry.Flush(2 * time.Second)

    runServer()
}
Call Flush explicitly before os.Exit. Go's os.Exit does not run deferred functions. log.Fatal also exits the process, so a deferred flush will not run after it.
Check the Boolean result in batch jobs:
if ok := sentry.Flush(2 * time.Second); !ok {
    log.Print("Sentry flush reached its timeout")
}
Do not flush after every event in a long-running server. That removes the benefit of asynchronous delivery.
Validate the configuration with a smoke test
A successful sentry.Init call proves configuration parsing. It does not prove event delivery.
Run this test in a non-production environment:
eventID := sentry.CaptureMessage("sentry-go configuration smoke test")
if eventID == nil {
    log.Print("Sentry did not create an event ID")
}

if ok := sentry.Flush(2 * time.Second); !ok {
    log.Print("Sentry did not flush before the timeout")
}
Then confirm these facts in Sentry:
- The event has the expected release and environment.
- The event belongs to the correct service or project.
- Request tags appear only on the intended event.
- Breadcrumbs appear in the correct order.
- A traced request contains expected child spans.
- A short-lived process delivers its final event.
Enable Debug: true only while troubleshooting SDK delivery. Turn it off after you collect the needed diagnostics.
Common Sentry Go configuration mistakes
| Symptom | Likely cause | First check |
|---|---|---|
| Errors arrive without deploy context | Release is empty or changes between replicas | Print the release value during startup |
| Production and staging mix together | Environment is missing or inconsistent | Check deployment environment variables |
| Trace volume is unexpectedly high | Sampling stayed at a development value | Review TracesSampleRate or TracesSampler |
| Important routes disappear | The sampler drops them or inherits an upstream decision | Inspect route names and parent sampling |
| User data appears on another event | A global scope changed inside a request | Use the hub from r.Context() |
| CLI events disappear on exit | The async transport did not flush | Flush before the process exits |
Transactions ignore BeforeSend | The wrong callback handles them | Use BeforeSendTransaction |
| Breadcrumbs add noise | Categories are too broad | Keep only investigation-relevant decisions |
When error context still does not explain the bug
Sentry configuration can improve error grouping, trace sampling, release context, and event details. Some production failures still do not throw an exception. A request can return 200 while business state becomes wrong.
This is where Tracekit uses a different debugging path. Its current Go integration sends OpenTelemetry traces with service.version and environment resource data. Its dynamic logs use bounded capture points to collect runtime state from selected code paths.
The current Tracekit Go SDK exposes these verified configuration fields:
sdk, err := tracekit.NewSDK(&tracekit.Config{
    APIKey:               os.Getenv("TRACEKIT_API_KEY"),
    ServiceName:          "checkout-api",
    ServiceVersion:       os.Getenv("APP_VERSION"),
    Environment:          os.Getenv("APP_ENV"),
    SamplingRate:         0.20,
    EnableCodeMonitoring: true,
})
if err != nil {
    return err
}
defer sdk.Shutdown(context.Background())
After code monitoring is installed, a checkpoint can capture selected runtime state with trace context:
sdk.CheckAndCaptureWithContext(ctx, "checkout-validation", map[string]interface{}{
    "orderID": orderID,
    "inventoryState": inventoryState,
    "paymentState": paymentState,
})
Keep normal application logs in your logger. Use dynamic logs for bounded runtime state during an investigation.
Read the Go observability guide for wider tracing setup. Use the Sentry and Tracekit comparison when you need to compare error tracking with runtime-state debugging.
Final checklist
- Read the DSN from deployment configuration.
- Set one immutable release identifier.
- Use consistent environment names.
- Choose
TracesSampleRateorTracesSampler. - Keep request data on the request hub.
- Add bounded, useful breadcrumbs.
- Scrub sensitive fields before delivery.
- Use the correct callback for errors and transactions.
- Flush before short-lived processes exit.
- Verify one real event and one real traced request.
Advanced Sentry Go configuration works when each setting answers one operational question. Keep the policy explicit, test event delivery, and verify the metadata in the actual event.
Related Posts
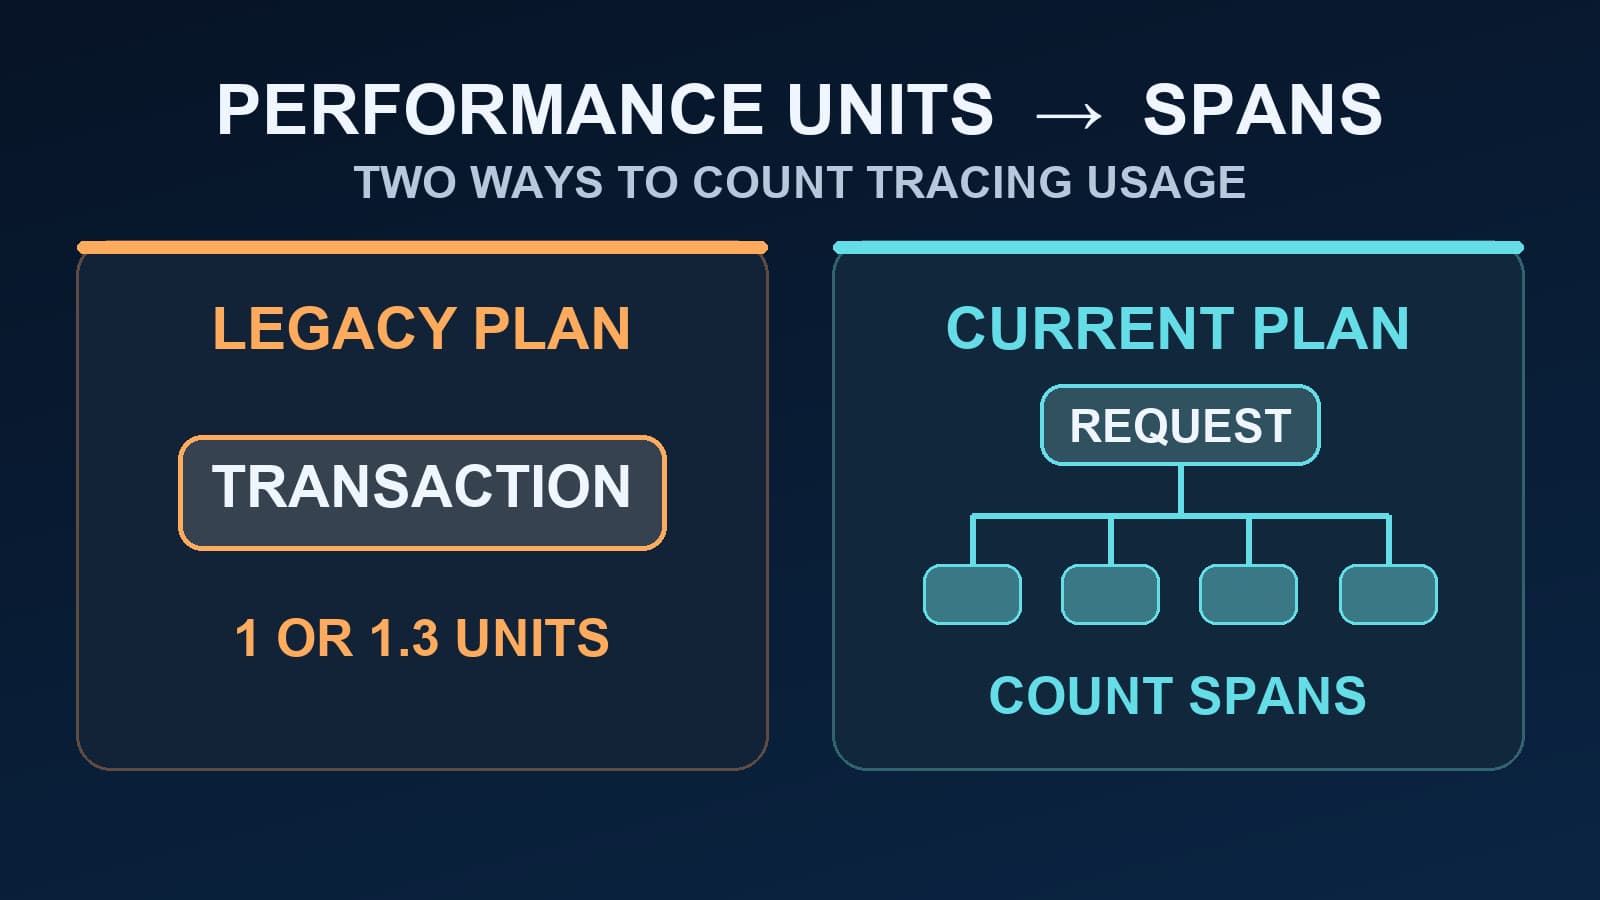
Sentry Performance Units vs Spans: What Changed?
Learn when Sentry performance units still apply, how legacy transactions were counted, and why current span quotas need a different estimate.

Sentry vs TraceKit: Error Tracking vs Full Debugging
Sentry vs TraceKit compared: error tracking vs full production debugging. Feature-by-feature comparison with pricing, setup time, and use case guidance.
Go Observability: Complete Guide for Production Applications
Go observability for production: OpenTelemetry setup for Gin, Echo, gRPC, and GORM. Distributed tracing, metrics, and monitoring for Go services.