
How to Track Rogue LLM Calls in Production
Track rogue LLM calls with traces, call counts, token usage, costs, models, and retry evidence before a loop becomes an incident.
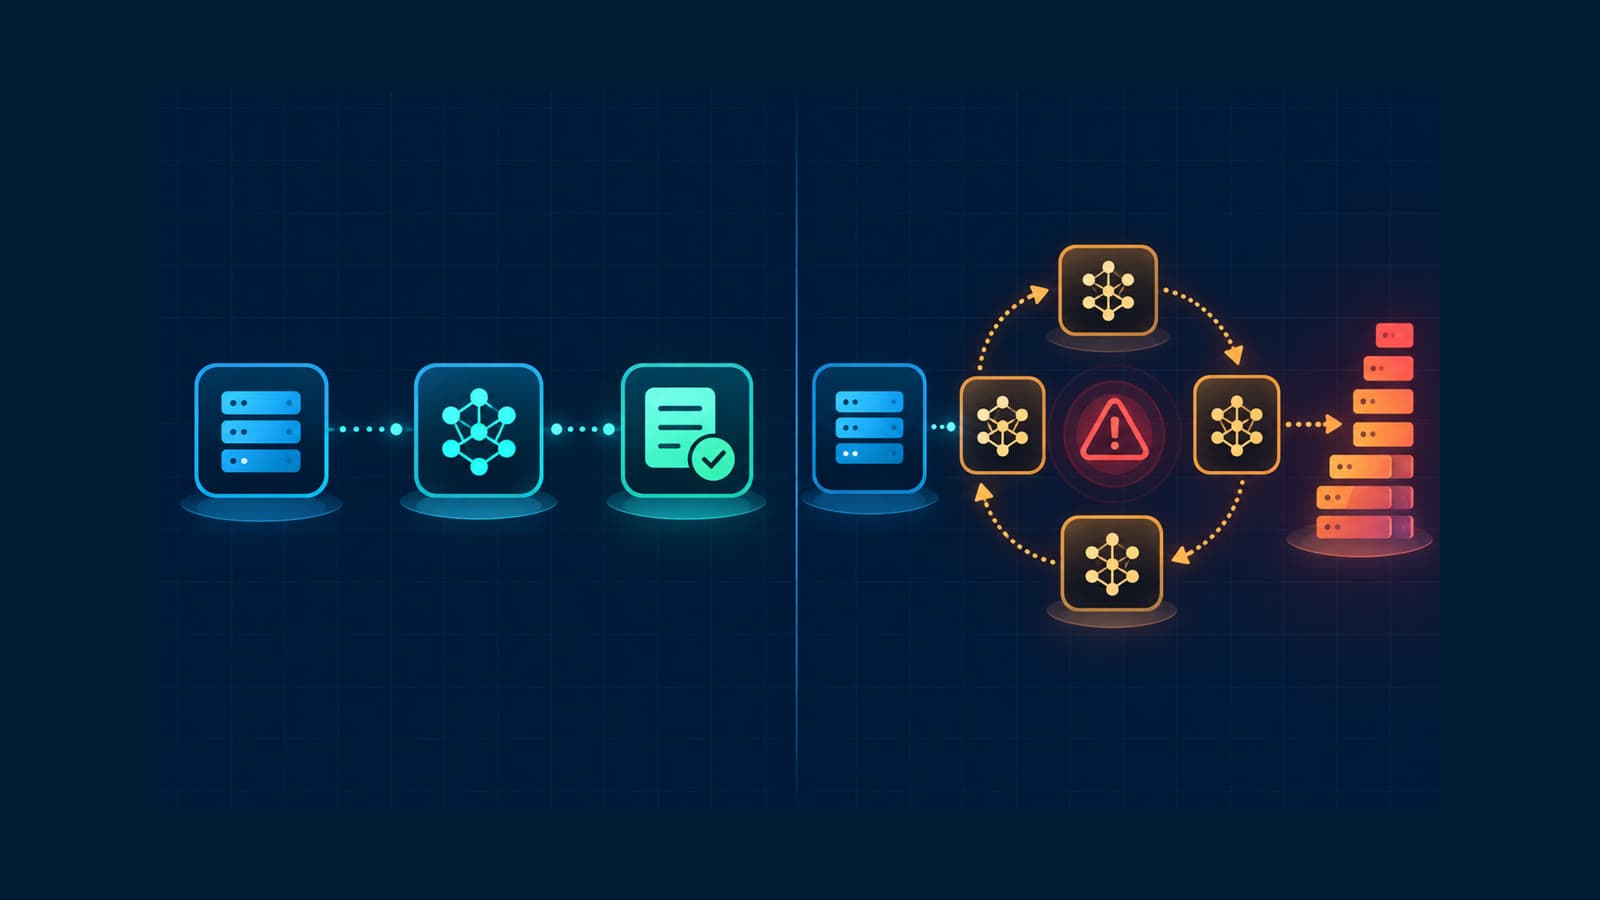
Tracking rogue LLM calls starts with one rule: every model request must belong to an expected service, workflow, and parent trace. A call becomes rogue when your application makes it outside that expected path. Common causes include retry storms, agent loops, duplicate queue delivery, and an unexpected model or provider.
This guide focuses on calls made by your production application. It does not cover employee browser traffic or network-wide shadow AI. You need network and identity controls for that wider problem.
What is a rogue LLM call?
"Rogue" is an operational label, not a protocol value. It describes model calls that your system made but your workflow did not need.
Use this practical definition:
A rogue LLM call has no valid place in the expected workflow, or it exceeds the workflow's approved call, token, time, or cost budget.
That definition covers several failure modes:
| Pattern | Evidence to look for | Likely cause |
|---|---|---|
| Repeated calls in one trace | Many similar model spans under one parent trace | Agent loop or retry loop |
| Call count rises while request traffic stays flat | More LLM spans per application request | Duplicate execution or new hidden call path |
| One service starts using a new model | New service and model combination | Configuration drift or a bad release |
| Tokens rise without more completed work | Larger input or output token totals | Repeated context, missing stop condition, or prompt growth |
| Provider cost rises beyond traced cost | Provider usage exceeds application telemetry | Missing instrumentation, another key, or another workload |
| Calls continue after a user request ends | Detached spans or late background work | Lost cancellation or uncontrolled queue work |
OWASP includes uncontrolled model resource use in its LLM application security guidance. Its examples include excessive operations and unsustainable pay-per-use costs. The controls below help with application failures before they become that type of incident.
Record the minimum evidence for every call
Do not begin with prompt content. Begin with operational fields that answer who, what, where, and how much.
Record these fields for each model call:
- parent trace ID;
- service name and environment;
- provider and requested model;
- response model when the provider returns one;
- input and output token counts;
- total call duration;
- finish reason and error state;
- release or service version where available.
The OpenTelemetry GenAI semantic conventions define common attributes for model operations. Important fields include gen_ai.operation.name, gen_ai.provider.name, gen_ai.request.model, and token usage.
Stable attribute names let you compare services and providers without a separate schema for each client library.
Instrument LLM calls before you set alerts
Tracekit's current Node.js SDK instruments detected OpenAI and Anthropic client calls. It records model, provider, token, finish-reason, error, duration, and trace data.
Use the current Node.js LLM instrumentation guide for the supported setup:
import { init } from '@tracekit/node-apm'

init({
  apiKey: process.env.TRACEKIT_API_KEY!,
  serviceName: 'support-workflow',
  endpoint: 'https://app.tracekit.dev/v1/traces',
  instrumentLLM: {
    enabled: true,
    openai: true,
    anthropic: true,
    captureContent: false,
  },
})
Initialize Tracekit before you create or import the supported model client. This order gives the SDK a chance to instrument client calls.
Keep each LLM span inside the active application trace. A detached model span can show tokens and latency. It cannot show which request, queue job, or workflow caused the call.
Use distributed tracing to connect the model span to the application path. Add explicit context propagation when work crosses a queue, worker, scheduler, or process boundary.
Build an expected-call baseline
A total call count is useful, but it does not define normal behavior. A batch job can make many valid calls. A user request might need only one.
Define the expected shape for each workflow:
| Baseline field | Example question |
|---|---|
| Calls per trace | Should one request create one model call or five? |
| Model and provider | Which model combinations are approved for this service? |
| Input and output tokens | What range is normal for successful work? |
| Duration | What is the normal P50, P95, and P99? |
| Cost per completed workflow | Does spend grow with completed work? |
| Error and retry count | How many retries can one operation make? |
| Finish reason | Which finish reasons are expected for this task? |
Use a healthy time window that contains normal traffic. Split the data by stable fields such as service, environment, model, and provider.
Do not use prompt text, trace IDs, or user IDs as metric labels. Those values create high cardinality and can expose sensitive data.
The LLM latency monitoring guide explains how to separate model time from tools, queues, and application work.
Find a rogue call in Tracekit
Tracekit stores each detected GenAI span as an LLM call record. The current record includes its trace ID, service, provider, model, tokens, estimated cost, finish reason, latency, and time.
The LLM observability dashboard shows total calls, total tokens, estimated cost, average latency, cost over time, model breakdowns, and recent calls. Use its service, model, provider, and time filters to reduce the search area.
Use this investigation order:
- Mark the first abnormal time window.
- Compare total calls, tokens, and estimated cost with the previous healthy window.
- Filter by service, then model, then provider.
- Open representative calls from the abnormal segment.
- Follow each trace ID to the parent application trace.
- Count repeated model spans inside one workflow.
- Compare the first bad trace with the current release.
The parent trace provides the strongest evidence. It shows whether a retry, queue consumer, scheduled job, or tool step caused the extra call.
Do not infer the cause from a cost chart alone. Use the chart to find the segment. Use traces and code to confirm the cause.
Recognize the common failure patterns
Retry storms
A retry storm produces several similar model spans after timeouts, rate limits, or transient errors. The call count grows faster than completed workflows.
Check whether your retry policy has:
- a fixed maximum attempt count;
- exponential backoff and jitter;
- a total elapsed-time budget;
- clear rules for retryable errors;
- cancellation when the parent request ends.
Provider rate limits are not retry instructions by themselves. For example, Anthropic documents request and token limits plus a retry-after response for exceeded limits. Your application still needs a bounded retry policy.
Agent loops
An agent loop often shows alternating model and tool spans with no successful terminal step. Token and call totals grow inside one parent trace.
Set application-side limits for:
- maximum model calls per workflow;
- maximum tool calls;
- maximum input and output tokens;
- maximum elapsed time;
- maximum estimated cost;
- allowed terminal states.
Treat these limits as product controls. Monitoring tells you that a loop exists. Limits stop the loop.
Duplicate queue delivery
A queue can deliver the same logical job more than once. Both workers can make valid-looking model calls.
Use an idempotency key for the logical operation. Store the completed result or active execution state. Reject or reuse duplicate work before the model call starts.
Keep queue context inside the trace. The producer and consumer spans help distinguish a retry from a second delivery.
Configuration drift
A release can change a model name, provider, or feature flag. Calls remain successful, but cost or behavior changes.
Compare the first new service-model combination with release data. Verify the deployed environment values and routing code. Do not assume the provider changed the model without application evidence.
Reconcile application traces with provider usage
Application telemetry can miss a workload. Provider totals can show that gap.
The OpenAI Usage API reports model request counts and token usage. It can group results by fields such as model, project, user, or API key when those fields are available.
Compare provider data with your traced application totals for the same time window:
provider request count
- traced application LLM calls
= unexplained request gap
A gap does not prove malicious activity. It can come from missing instrumentation, batch work, test environments, manual tools, or another application.
Use separate provider projects or keys for separate workloads. This separation makes reconciliation easier. It also reduces the impact of one leaked or misused key.
Alert on ratios and budgets
Do not copy one universal call-count threshold. Traffic changes throughout the day, and workflows have different shapes.
Useful alert inputs include:
- LLM calls per completed workflow;
- token growth without request growth;
- estimated cost per successful workflow;
- a new model or provider for one service;
- repeated errors followed by more calls;
- calls after a workflow timeout;
- provider usage that exceeds traced usage.
Start with warning alerts while you measure false positives. Add minimum traffic requirements to prevent noise during low-volume periods.
Tracekit supports alert rules and latency metrics. Use the anomaly detection guide for baseline-based alert design. Keep automated actions separate until you trust the signal.
Keep prompt content off by default
You can detect most rogue-call patterns without storing prompts or responses.
Tracekit keeps captureContent off by default in its Node.js and Python integrations. The SDK can scrub common sensitive key names when content capture is enabled. That scrubber cannot guarantee that normal text contains no private data.
Begin with model, provider, tokens, duration, cost, errors, trace IDs, and stable workflow context. Enable content capture only after you review access, retention, and data rules.
What Tracekit can and cannot prove
Tracekit can show:
- which instrumented service made a model call;
- the model, provider, tokens, duration, finish reason, and estimated cost;
- the parent trace when trace context exists;
- repeated calls and related application work inside one trace;
- the time window and release context available in the trace.
Tracekit cannot prove:
- that every provider call came through an instrumented application;
- that employee browser traffic used an unapproved AI service;
- that estimated cost exactly matches a provider invoice;
- why a call occurred when its parent trace context is missing.
Use provider usage reports, identity controls, network controls, and application traces together when the scope extends beyond one service.
Production checklist
- Instrument every supported model client in the workflow.
- Keep each model call inside its parent trace.
- Define the normal calls-per-trace range for each workflow.
- Record provider, request model, response model, tokens, duration, and finish reason.
- Set maximum calls, tokens, elapsed time, and estimated cost.
- Bound retries and honor cancellation.
- Add idempotency before model calls in queue workers.
- Compare call growth with completed workflow growth.
- Reconcile traced totals with provider usage.
- Keep prompt and completion capture off unless you approve the data risk.
- Connect the first bad trace to the relevant release and code path.
What to do next
Choose one production LLM workflow. Measure its calls per trace, tokens, latency, and estimated cost for a healthy week. Then test one failed request, one provider timeout, and one duplicate job.
Use the LLM monitoring playbook for cost, fallback, and rate-limit planning. Use Tracekit's LLM observability dashboard to find abnormal calls and follow them into their parent traces.
Related Posts
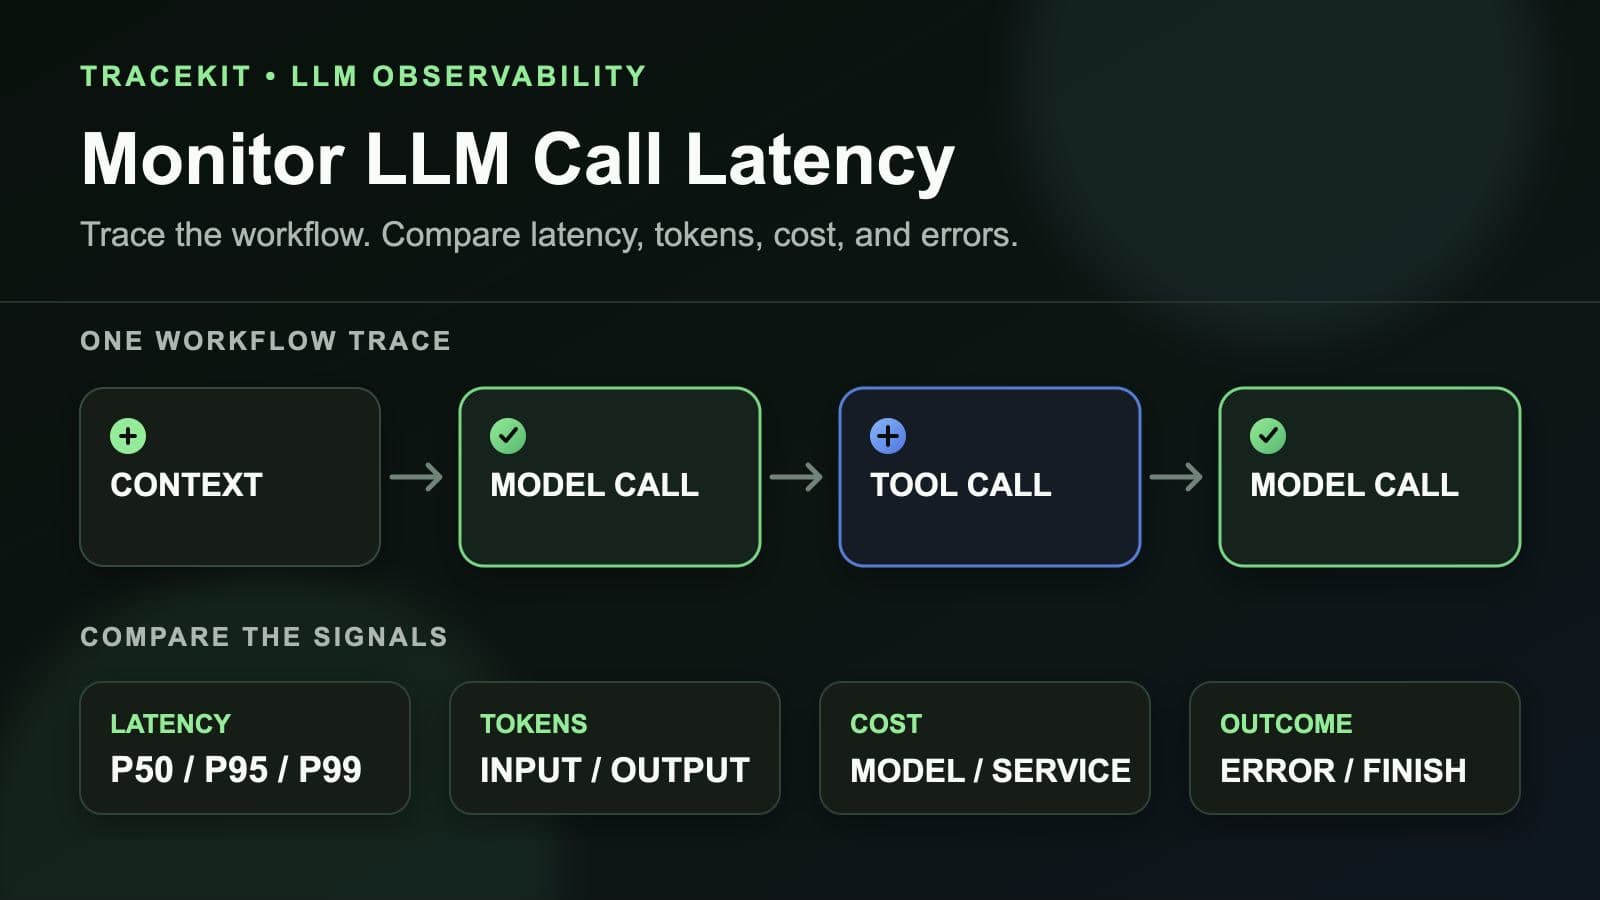
How to Monitor LLM Call Latency in Production Workflows
Monitor LLM call latency in production workflows with traces, model percentiles, token usage, costs, errors, and workflow context.
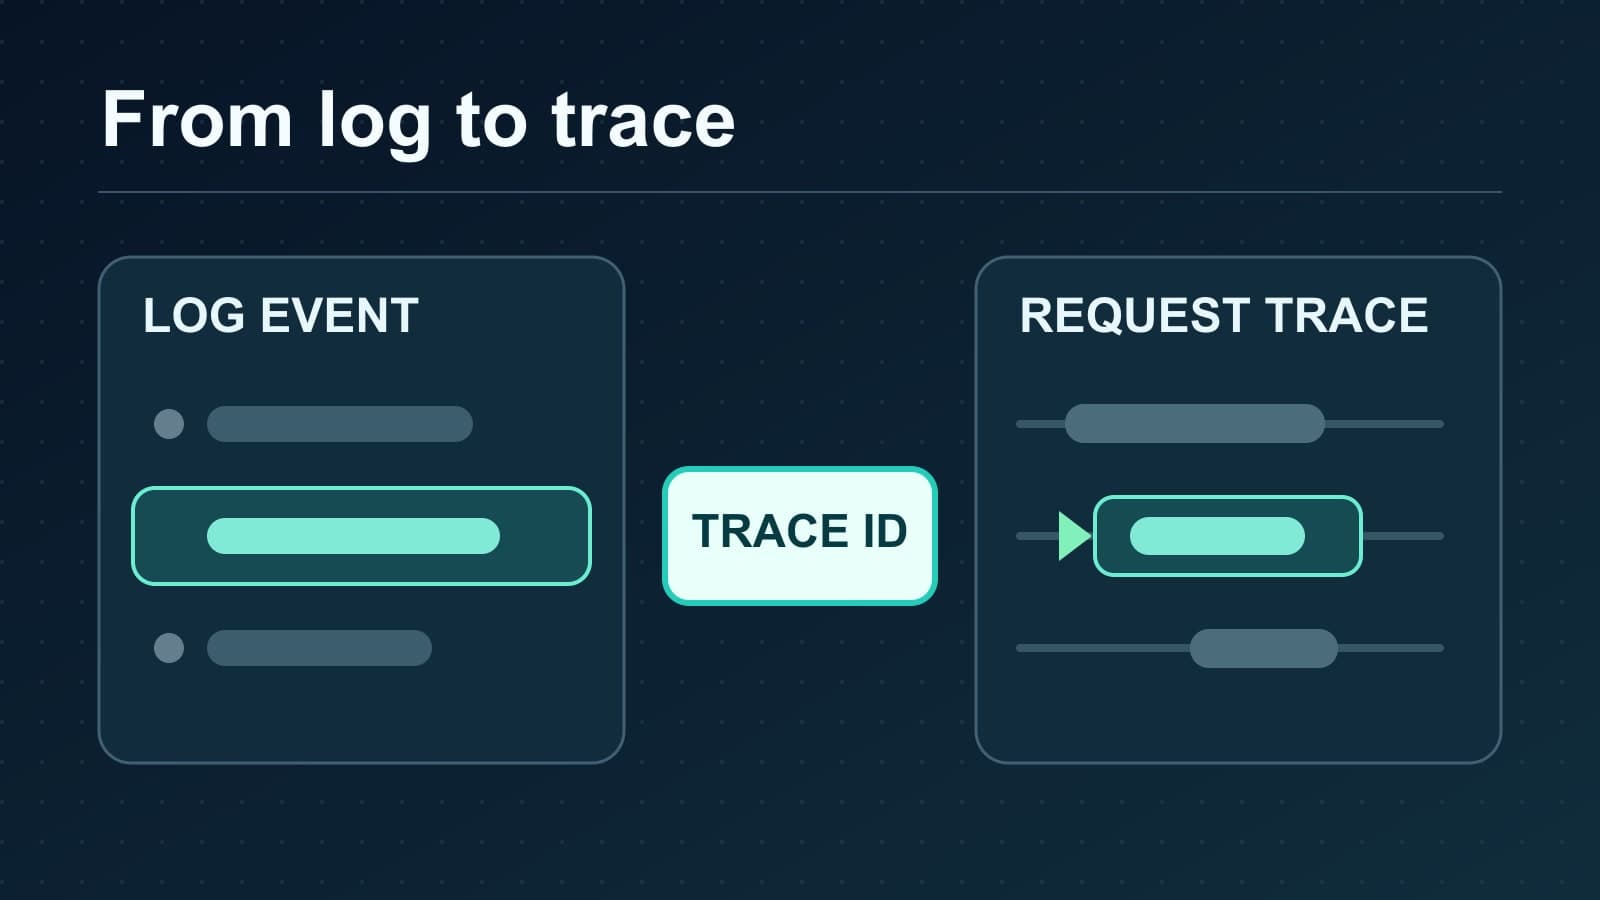
How to Correlate Logs with Traces When Debugging
Correlate logs with traces using trace IDs, span IDs, and a request test. Find missing context across services without relying on timestamps alone.
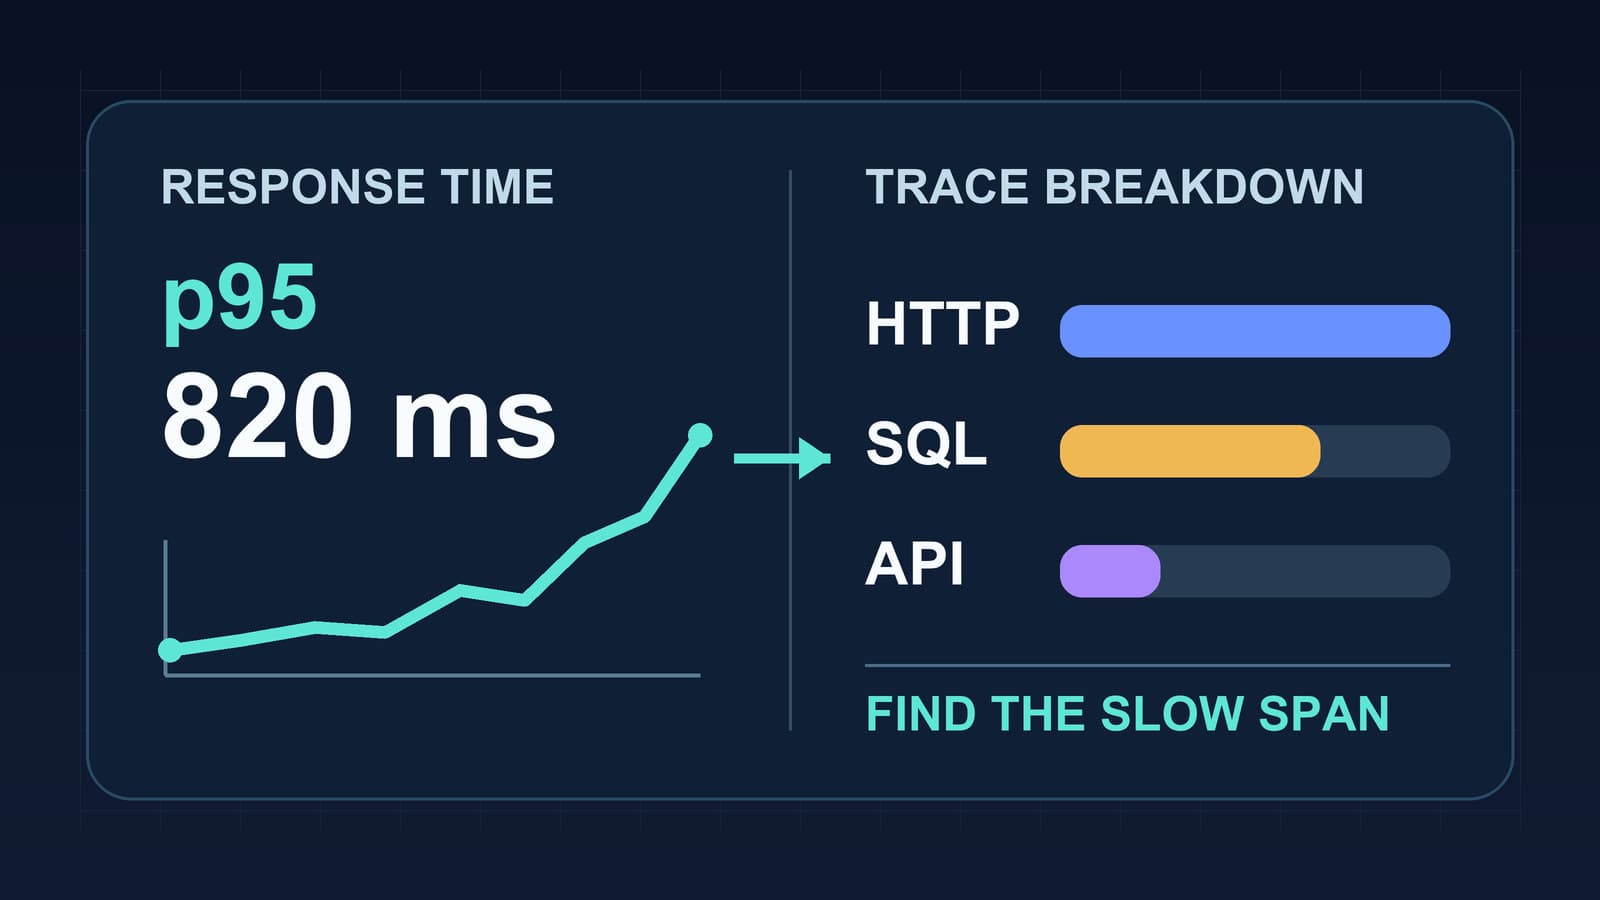
Node.js Response Time Monitoring by Route
Measure Node.js response time by route, read p95 latency with traces, and separate event loop delays from database and API waits.