
Elastic APM Transaction Sample Rate: Setup and Checks
Set ELASTIC_APM_TRANSACTION_SAMPLE_RATE, check why it seems ignored, and map the setting to OpenTelemetry sampling during a migration.
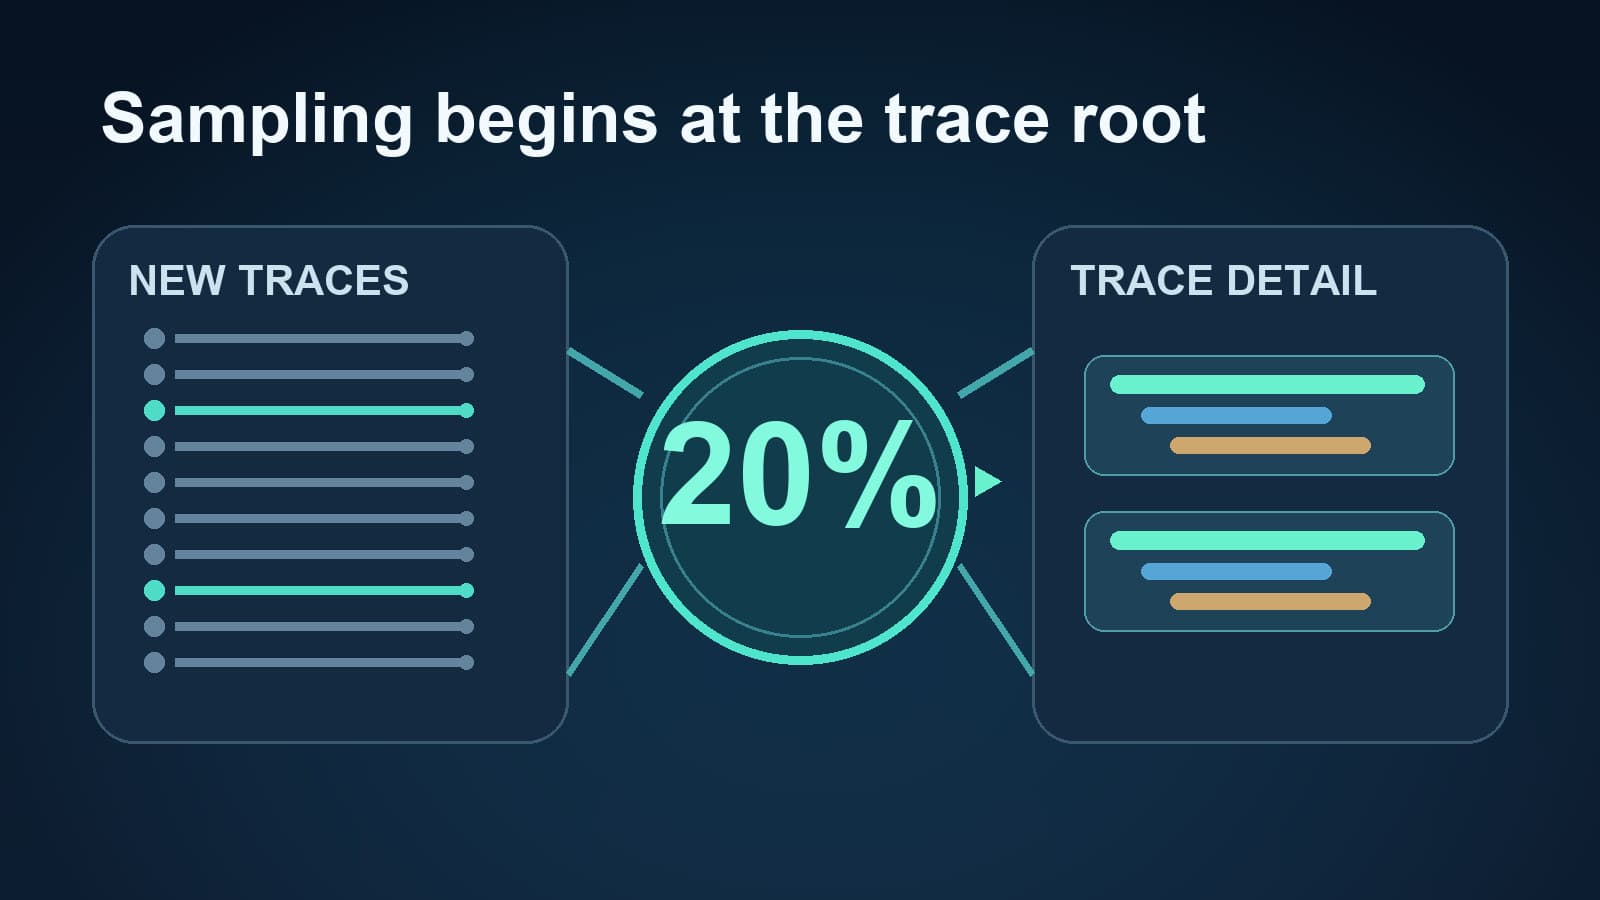
ELASTIC_APM_TRANSACTION_SAMPLE_RATE sets the fraction of new transactions that an Elastic APM agent samples. Set 0.2 to sample about 20% of eligible new traces, or 1.0 to sample all of them. The value must be between 0.0 and 1.0. An incoming distributed trace can carry an earlier sampling decision, so changing this setting may not change every request you see.
This guide covers the setting, the common reasons it appears to do nothing, and the OpenTelemetry setting to use during migration. It uses current Elastic Node.js configuration, Elastic Node.js performance guidance, and OpenTelemetry SDK configuration.
Set the Elastic APM transaction sample rate
Set the environment variable in the process that starts your application:
export ELASTIC_APM_TRANSACTION_SAMPLE_RATE=0.2
node server.js
For the Elastic Node.js agent, the equivalent code option is transactionSampleRate:
require('elastic-apm-node').start({
  serviceName: 'checkout-api',
  transactionSampleRate: 0.2,
})
Start the agent before loading modules that it must instrument. Use one configuration method for a first test. Then confirm which setting wins when you add other sources.
| Value | Meaning for a new sampling decision |
|---|---|
1.0 | Sample every eligible new trace. |
0.2 | Sample about one in five eligible new traces over enough traffic. |
0.01 | Sample about one in 100 eligible new traces over enough traffic. |
0.0 | Do not sample new trace details at this decision point. |
These are probabilities, not fixed intervals. A batch of 20 requests need not contain exactly four sampled traces. Elastic's Node.js documentation gives 1.0 as the default for this agent. The Python and Go agent references also document this environment variable and their defaults. Check your agent's own version and configuration page before applying a rule across languages.
What the setting changes
Elastic's transaction sample rate is a head-based decision. The agent chooses whether to keep trace detail when a new trace starts. A lower rate can reduce tracing overhead and stored detail, but it also makes rare failures less likely to appear with a complete trace. Elastic's Node.js performance guide describes that tradeoff.
The setting does not mean “keep every error and slow request.” At the start of a request, the agent does not yet know its final duration or outcome. If you need a different retention policy, evaluate your full tracing pipeline and its sampling options. Do not treat a simple probability setting as an error-retention promise.
Also separate trace detail from other telemetry. Agent versions and APM Server versions differ in what they report for unsampled transactions. Do not infer metric or error coverage from a trace-detail count alone. Check the documentation for your installed agent and server versions.
Why the sample rate seems ignored
An upstream service already chose the rate
A request can arrive with a W3C traceparent header. Its sampled flag may carry the decision from the service that started the distributed trace. Elastic's Node.js performance guide says transactionSampleRate does not apply when the incoming trace already has that decision.
Test both cases:
- Send a request that starts a new trace at this service.
- Send a request with an upstream
traceparentheader. - Compare the sampled flags and trace IDs across the service boundary.
If only the second case differs, inspect the upstream sampler. Raising this service's local rate will not repair a decision made earlier.
A higher-priority setting overrides the environment variable
For the Elastic Node.js agent, central configuration has higher precedence than environment variables. Environment variables take precedence over the apm.start() object and the agent configuration file.
Check the effective setting in this order:
- APM agent central configuration for the service and environment.
- The environment of the running application process.
- The object passed to
apm.start(). - The agent configuration file.
Do not assume an environment variable in your shell reached a container, process manager, or serverless runtime. Read the deployed process configuration through your normal operations tooling. Keep credentials out of diagnostic output.
The test has too few requests
A probability needs enough independent new traces to show its pattern. Ten requests at 0.2 can produce a count far from two without a configuration fault. Use a larger test set, one route, and a stable deployment window. Count root traces, not child spans.
A useful check records the configured value, application instance, root trace count, sampled trace count, and upstream traceparent state. Then compare the same fields after the change. This method does not require a made-up target percentage for a small sample.
Map the setting to OpenTelemetry during migration
ELASTIC_APM_TRANSACTION_SAMPLE_RATE belongs to an Elastic agent. It does not configure an OpenTelemetry SDK. For a head-based ratio in an OpenTelemetry SDK that supports these environment variables, set both values:
export OTEL_TRACES_SAMPLER=parentbased_traceidratio
export OTEL_TRACES_SAMPLER_ARG=0.2
The OpenTelemetry SDK configuration reference defines parentbased_traceidratio as a parent-based sampler with a trace-ID ratio decision at a new root. It also says environment-variable support varies by language. Verify your SDK's support and effective sampler before a cutover.
| Question | Elastic APM agent | OpenTelemetry SDK |
|---|---|---|
| Which setting controls a new trace ratio? | ELASTIC_APM_TRANSACTION_SAMPLE_RATE | OTEL_TRACES_SAMPLER with OTEL_TRACES_SAMPLER_ARG |
| What represents 20%? | 0.2 | parentbased_traceidratio and 0.2 |
| What about a sampled parent? | Agent follows distributed context where supported. | Parent-based sampler follows the parent decision. |
| Is the result identical? | No guaranteed one-to-one trace set. | Verify behavior in your own pipeline. |
Equal ratios do not guarantee identical retained traces. The agents can differ in instrumentation coverage, parent handling, and effective configuration. Compare root and child spans for the same service, route, and traffic class. The parallel OpenTelemetry migration guide explains how to compare both paths before removing the old agent.
Where Tracekit fits after sampling
Tracekit accepts OTLP traces from an OpenTelemetry exporter. It can show the traces that your instrumentation and sampling pipeline send. It cannot restore a trace that the SDK or an earlier service never recorded.
For a migration, first verify one complete trace at a high sampling rate in a controlled environment. Check the service name, root span, downstream spans, and parent links. Then tune the rate against your traffic and investigation needs. Use the distributed tracing guide for the trace view and the sampling optimizer for a planning estimate. A calculator is a planning aid; production trace coverage is the final check.
Final verification checklist
- The value is between
0.0and1.0. - The deployed process received the setting.
- Central configuration does not override it.
- The test starts new traces as well as continuing upstream traces.
- The count uses root traces, not spans.
- The chosen rate retains enough evidence for the failures you investigate.
- The OpenTelemetry sampler is verified separately during migration.
If the rate still appears wrong, start with the effective agent configuration and incoming traceparent. Those two checks usually narrow the problem before you change the sampling number again.
Related Posts

FastAPI Tracing with OpenTelemetry: A Practical Setup
Set up FastAPI tracing with OpenTelemetry. Connect request, SQLAlchemy, and HTTPX spans, then verify trace context across services.
Migrate to OpenTelemetry Without Downtime
Migrate to OpenTelemetry without downtime with a parallel Collector path, trace parity checks, and a safe service-by-service cutover.
PHP Observability Checklist for Production Apps
Use this PHP observability checklist to trace requests, surface PDO and HTTP bottlenecks, and inspect runtime state without redeploying.