
FastAPI Tracing with OpenTelemetry: A Practical Setup
Set up FastAPI tracing with OpenTelemetry. Connect request, SQLAlchemy, and HTTPX spans, then verify trace context across services.
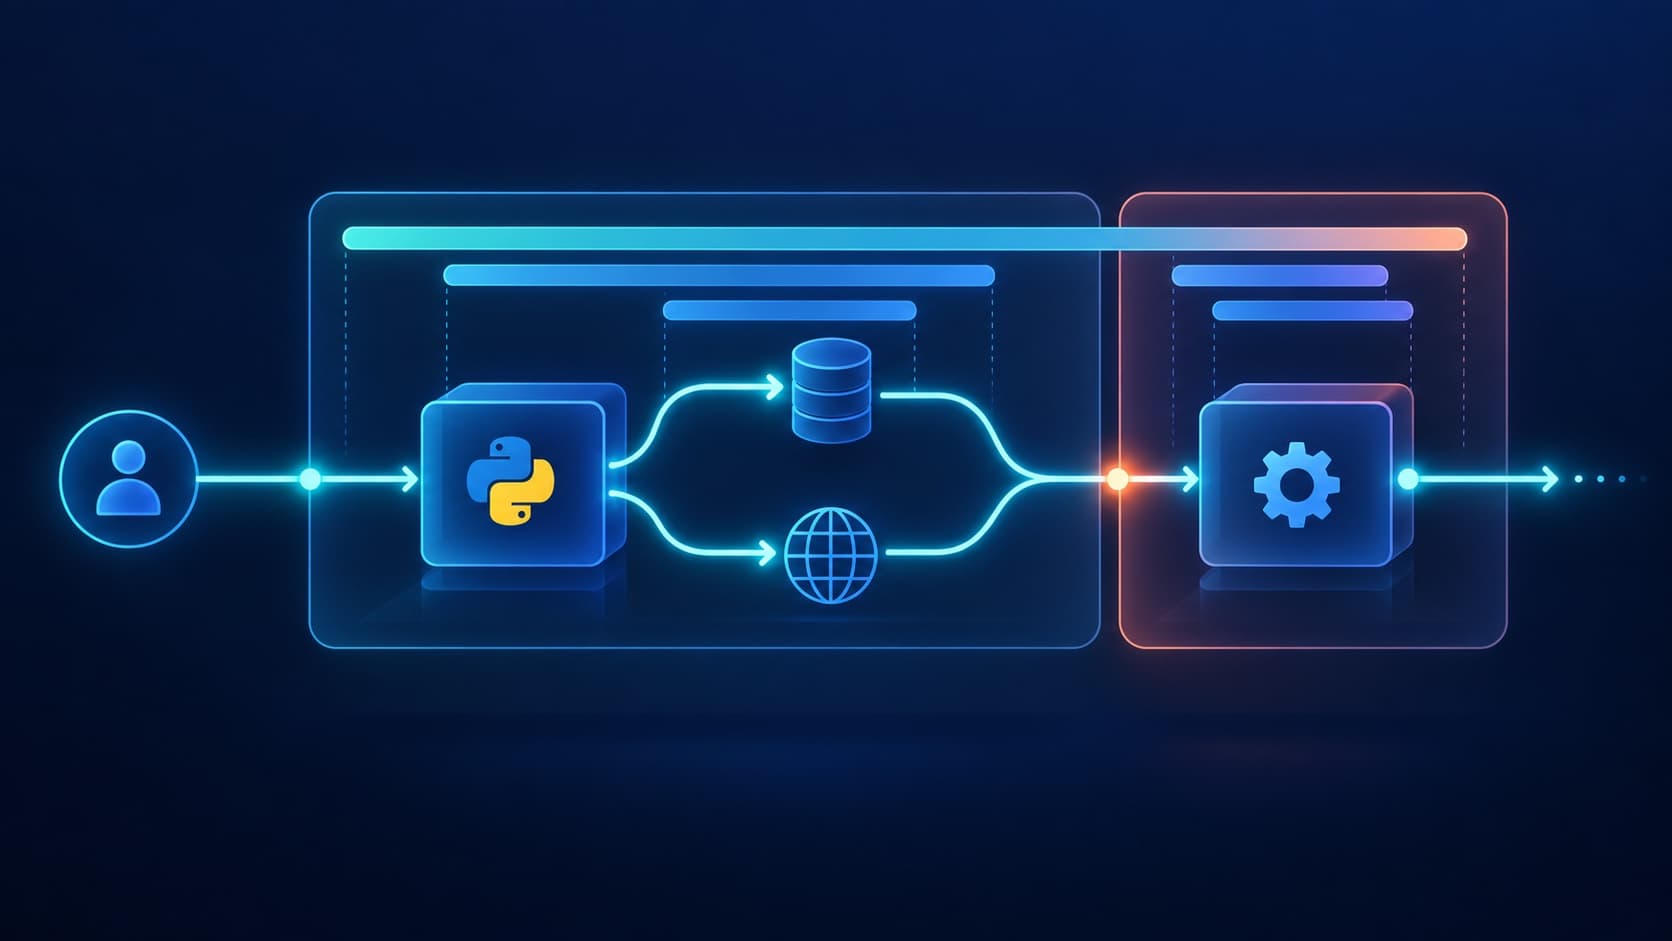
FastAPI tracing should show more than the time spent in one route. A useful trace connects the incoming request to database queries, outbound HTTP calls, and the next service. Without those child spans, a slow response still leaves you guessing.
This guide sets up that trace with OpenTelemetry and Tracekit. It shows what to instrument, how to check the result, and why a trace can break at a service boundary. The example uses the current Tracekit Python SDK and the official OpenTelemetry FastAPI instrumentation.
What a complete FastAPI trace contains
For an endpoint that reads an order and calls a payment service, expect a trace like this:
GET /orders/{order_id}                 SERVER span
├─ orders.load                         application span
│  └─ SELECT orders                     database span
└─ GET payment-service /payments/...   HTTP CLIENT span
   └─ GET /payments/{payment_id}        downstream SERVER span
The parent and child links matter more than the number of spans. A database span without the request parent cannot explain which user action caused the query. An outbound client span without the downstream server span cannot show where the other service spent time.
OpenTelemetry defines traces as connected spans. Each service must instrument its own work. The network boundary also needs context propagation.
1. Install the tracing packages
Install the Tracekit SDK, FastAPI instrumentation, and the client libraries your application uses:
pip install 'tracekit-apm[fastapi]' \
  opentelemetry-instrumentation-fastapi \
  opentelemetry-instrumentation-httpx \
  opentelemetry-instrumentation-sqlalchemy
The HTTPX and SQLAlchemy packages are optional. Keep only the instrumentations that match your code. The Tracekit SDK already configures its OpenTelemetry provider and OTLP exporter. The extra packages create spans for FastAPI, HTTPX, and SQLAlchemy operations.
Set TRACEKIT_API_KEY in your application environment. Use an API key from Tracekit, and keep it out of source control.
2. Instrument incoming FastAPI requests
Initialize Tracekit once when the process starts. Then instrument the FastAPI app with the same provider:
# main.py
import os

import tracekit
from fastapi import FastAPI
from opentelemetry import trace
from opentelemetry.instrumentation.fastapi import FastAPIInstrumentor

client = tracekit.init(
    api_key=os.environ["TRACEKIT_API_KEY"],
    service_name="orders-api",
)

app = FastAPI()
FastAPIInstrumentor.instrument_app(
    app,
    tracer_provider=client.provider,
)
tracer = trace.get_tracer("orders-api")


@app.get("/orders/{order_id}")
async def get_order(order_id: str) -> dict[str, str]:
    with tracer.start_as_current_span("orders.load") as span:
        span.set_attribute("order.id", order_id)
        return {"order_id": order_id}
This example uses the official FastAPI instrumentor for request spans. Tracekit also documents init_fastapi_app() as a separate middleware option. Choose one request instrumentation path for an app. Adding both can create duplicate request spans.
Use stable, safe span attributes. Do not put passwords, tokens, or full customer records in order.id or other attributes. If an identifier is sensitive in your system, use an approved surrogate.
Run the app and request /orders/123. In the Tracekit trace view, look for a server span and its orders.load child. If the child appears as a separate trace, check whether a current span was active where you created it.
3. Add database spans where queries run
FastAPI instrumentation does not create database spans by itself. Instrument the SQLAlchemy engine used by the route:
from sqlalchemy import create_engine
from opentelemetry.instrumentation.sqlalchemy import SQLAlchemyInstrumentor

engine = create_engine(os.environ["DATABASE_URL"])
SQLAlchemyInstrumentor().instrument(engine=engine)
For an asynchronous SQLAlchemy engine, instrument its underlying synchronous engine:
from sqlalchemy.ext.asyncio import create_async_engine
from opentelemetry.instrumentation.sqlalchemy import SQLAlchemyInstrumentor

async_engine = create_async_engine(os.environ["DATABASE_URL"])
SQLAlchemyInstrumentor().instrument(engine=async_engine.sync_engine)
The official SQLAlchemy instrumentation guide documents both forms. Register each engine once. Then run a route that uses that engine and confirm the query span sits below the request or application span.
If a query span is missing, first check the actual database client. A route that uses another driver needs the matching instrumentation. A missing database span does not prove that no query ran.
4. Trace outbound HTTPX calls
If the route calls another service through HTTPX, instrument HTTPX before those calls begin:
from opentelemetry.instrumentation.httpx import HTTPXClientInstrumentor

HTTPXClientInstrumentor().instrument(tracer_provider=client.provider)
This instrumentor supports both httpx.Client and httpx.AsyncClient. The official HTTPX instrumentation guide also shows how to instrument one client instead of all clients.
Use a request from the FastAPI route to the downstream service. Check for an HTTP client span under the FastAPI server span. Then check for a server span in the downstream service with the same trace ID.
The Tracekit SDK instruments requests, urllib, and urllib3 when its HTTP client option is enabled. The current SDK does not add HTTPX instrumentation automatically. Install and enable HTTPX instrumentation when your application uses HTTPX.
5. Keep one trace across services
A client span and a downstream server span join when trace context crosses the request boundary. OpenTelemetry uses W3C traceparent headers for this job. Supported instrumentation libraries usually inject and extract that context for you.
Check the path in order:
| Trace result | First check |
|---|---|
| No FastAPI server span | Provider setup, exporter response, and request sampling |
| Server span but no SQL span | SQLAlchemy engine instrumentation or a different database driver |
| Server span but no HTTP client span | HTTPX instrumentation and client creation order |
| Client span but a new downstream trace | traceparent forwarding and downstream server instrumentation |
| Spans link locally but stop at a queue | Context injection into message headers and extraction in the worker |
For a custom transport or queue, use OpenTelemetry's Python propagation guide to inject context into a carrier and extract it in the worker. Do not copy a trace ID alone. The parent context also carries the span relationship and sampling decision.
FastAPI BackgroundTasks run after the response. They need a separate lifecycle check. Use the FastAPI background tasks checklist for in-process tasks, failure signals, and queue boundaries.
6. Verify the trace before using it to debug
A working exporter is only the first check. Confirm that the trace answers a real question:
- Make a request that performs one known database query and one outbound HTTP call.
- Find its FastAPI server span in Tracekit.
- Confirm the SQLAlchemy and HTTPX spans are children of that request.
- Confirm the downstream server span has the same trace ID.
- Compare span durations to find the slow branch.
- Repeat with an error case and confirm the affected span records the failure.
Use representative traffic before you lower sampling. A sampled-out request will not appear as a complete trace. Also avoid collecting raw SQL values or sensitive headers unless your data policy allows them.
When traces identify the slow path but not the condition that triggered it, Tracekit dynamic logs can capture selected runtime state at a bounded capture point. Keep normal application logs in your logger. Dynamic logs are for a targeted question, not general log ingestion.
For a vendor-neutral path, the OpenTelemetry Python exporter guide explains how to send OTLP to a collector. Tracekit accepts standard OTLP traces. The Python integration guide covers the Tracekit SDK setup used here.
Related Posts
How to Monitor Python Web Apps with OpenTelemetry
Monitor Python web applications with OpenTelemetry using auto-instrumentation, OTLP export, dependency spans, validation, and production safeguards.
Migrate to OpenTelemetry Without Downtime
Migrate to OpenTelemetry without downtime with a parallel Collector path, trace parity checks, and a safe service-by-service cutover.
PHP Observability Checklist for Production Apps
Use this PHP observability checklist to trace requests, surface PDO and HTTP bottlenecks, and inspect runtime state without redeploying.