
ActiveRecord Performance Monitoring in Rails
Monitor ActiveRecord query count, SQL time, and object instantiation in Rails. Use request traces to confirm production bottlenecks.
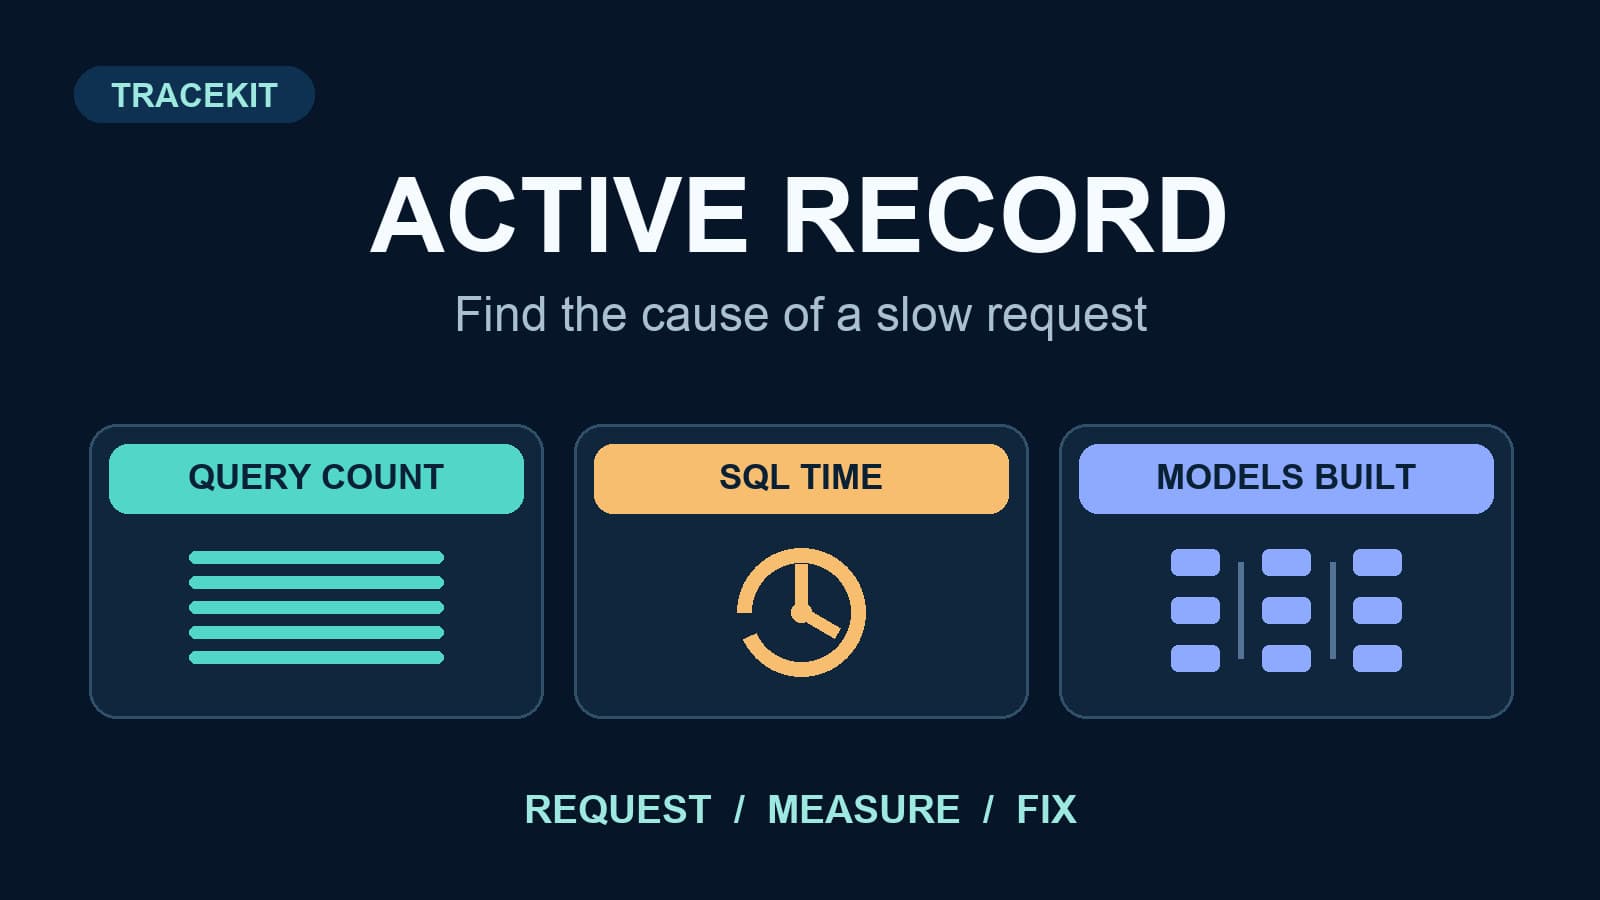
ActiveRecord performance monitoring starts with a slow Rails request, then asks which database cost caused it. Count queries, measure SQL time, and count instantiated records. These signals separate repeated queries from one slow query and from Ruby object work. A production request trace adds the route and timing context.
This guide gives you a small Rails measurement you can run around a real code path. It then shows how to check the same path in production. The Rails instrumentation guide defines the notification events used below.
Measure three different costs
| Signal | Rails source | What a high value can mean | Next check |
|---|---|---|---|
| Query count | sql.active_record | Repeated association loads or work inside a loop | Compare counts with small and large inputs |
| SQL time | sql.active_record event duration | One slow query or many modest queries | Inspect the slow relation and its query plan |
| Objects built | instantiation.active_record record count | Many Ruby objects created after SQL returns | Check selected columns, result size, and allocation work |
A fast SQL query can still build too many Ruby objects. A slow page can also spend most of its time outside the database. Measure request time as well. Do not label every slow request a database problem.
Rails also exposes database time on the process_action.action_controller notification. That gives a useful request-level check, but it does not identify the query shape by itself. The Rails notification reference documents its db_runtime field.
Run a bounded measurement around one path
Use a console, a test, or a staging task with representative data. This example measures one complete relation traversal. It does not install a permanent global subscriber.
stats = { queries: 0, sql_ms: 0.0, records: 0 }

subscriber = lambda do |event|
  case event.name
  when "sql.active_record"
    next if event.payload[:name] == "SCHEMA" || event.payload[:cached]

    stats[:queries] += 1
    stats[:sql_ms] += event.duration
  when "instantiation.active_record"
    stats[:records] += event.payload[:record_count].to_i
  end
end

ActiveSupport::Notifications.subscribed(
  subscriber,
  /\A(?:sql|instantiation)\.active_record\z/
) do
  Order.includes(:customer).limit(50).each do |order|
    order.customer.name
  end
end

puts stats
event.duration is in milliseconds. The example excludes cached SQL and schema events from the query count. It counts model instantiations reported by Rails, not all Ruby object allocations. Keep the same rules in each comparison.
Run the block with a smaller and a larger input. If query count grows with list size, inspect association access. If SQL time grows while query count stays stable, inspect the slow relation. If record count rises far beyond the rows the page needs, reduce loaded data or change the read path. The Rails Active Record query guide covers eager loading, batches, and explain.
Do not print event.payload[:sql] or bind values in routine production logs. Those fields can include sensitive data. Keep this measurement short and scoped to a path you control.
Diagnose the result in order
Many queries: find repeated association loads
Check whether the same association loads inside a view, serializer, or loop. Rails relations are lazy, so counting only relation construction can miss the actual queries. Compare the full rendered path with small and large inputs.
Use includes or preload for the association that causes the repeated work. Add strict_loading in a test when an unexpected lazy load should fail. The Rails N+1 detection guide gives a complete example and a regression check.
Few queries, high SQL time: inspect the plan
Use the relation's explain method in a safe environment. Check filters, joins, indexes, row estimates, and transferred rows. Rails may execute some work before it obtains an explanation for an eager-loaded relation. Use representative data and avoid running an expensive plan on a busy production path.
A high total SQL time can come from several different queries. Inspect the longest events or database spans before changing an index. Then compare the same route and input after the change.
Low SQL time, many records: reduce Ruby work
instantiation.active_record reports the model class and record count. A wide relation can build many models even when its SQL finishes quickly. Check whether the page needs every row and column. Pagination, batching, and a narrower selection can reduce the amount of Ruby work.
Do not treat the instantiation count as memory usage. Measure allocations and process memory separately before you claim a memory fix. The Rails event tells you how many Active Record models were built.
Check the production request in Tracekit
Local measurements find one known path. In production, start with a slow route and open its request trace. Compare its database spans with the full request duration. Repeated child spans suggest query fan-out. One long span suggests a slow operation. Check a second representative trace before you generalize.
Tracekit's Ruby integration guide documents request tracing and ActiveRecord instrumentation. The Ruby SDK enables OpenTelemetry ActiveRecord instrumentation when that library is available. Confirm that database spans appear in your service before you rely on them. A missing span can mean missing instrumentation or sampling; it does not prove that no query ran.
For a conditional branch that remains unclear, a bounded dynamic log capture point can inspect runtime state. Do not send SQL binds, credentials, or personal data to a capture point. Dynamic logs are for targeted inspection, not general log ingestion.
Use a small production checklist
- Pick one slow route and one representative input size.
- Record request time, query count, SQL time, and model instantiations.
- Confirm that database spans appear in a sampled request trace.
- Classify the result as repeated queries, one slow query, excess model creation, or non-database work.
- Change one cause, then rerun the same path and compare results.
- Keep a regression test for the query shape you fixed.
If the route hands work to Sidekiq, measure the worker separately. A fast web request does not prove that its job is fast. The Rails APM comparison explains how to test request, database, and job coverage when you choose a monitoring path.
Related Posts
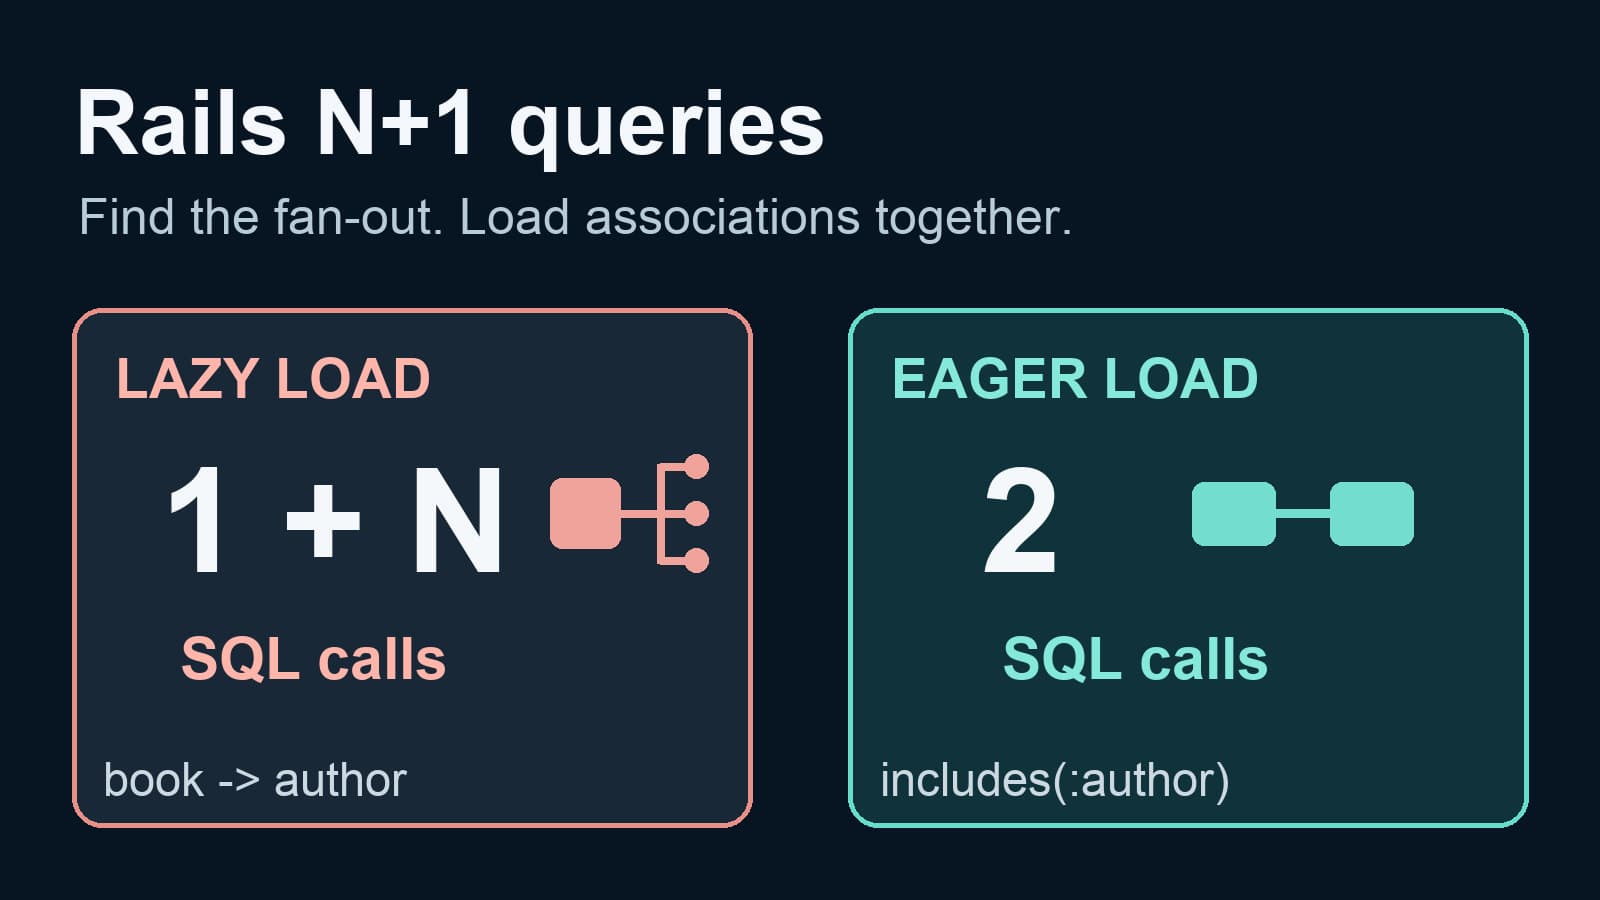
Rails N+1 Query Detection: Find and Fix Lazy Loads
Detect Rails N+1 queries with SQL notifications and strict loading. Fix lazy associations with includes, then verify the request trace.
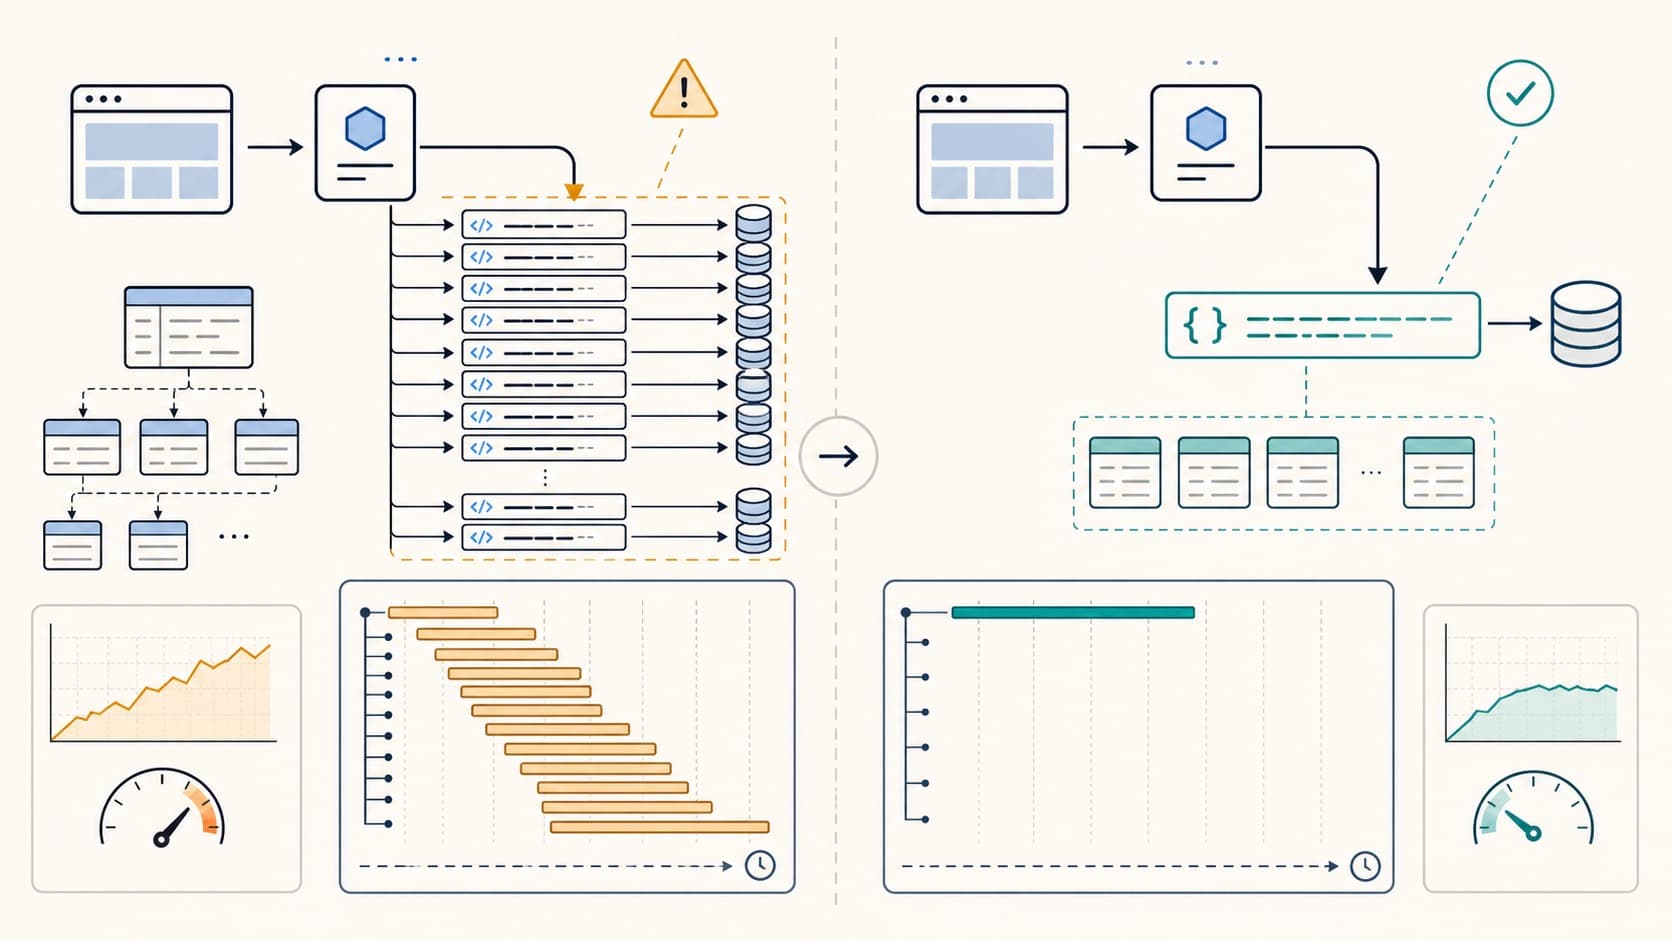
N+1 Query Detection: Find and Fix Regressions
Detect N+1 queries with query counts and traces. Find repeated database calls, fix ORM loading, and verify the result in production.
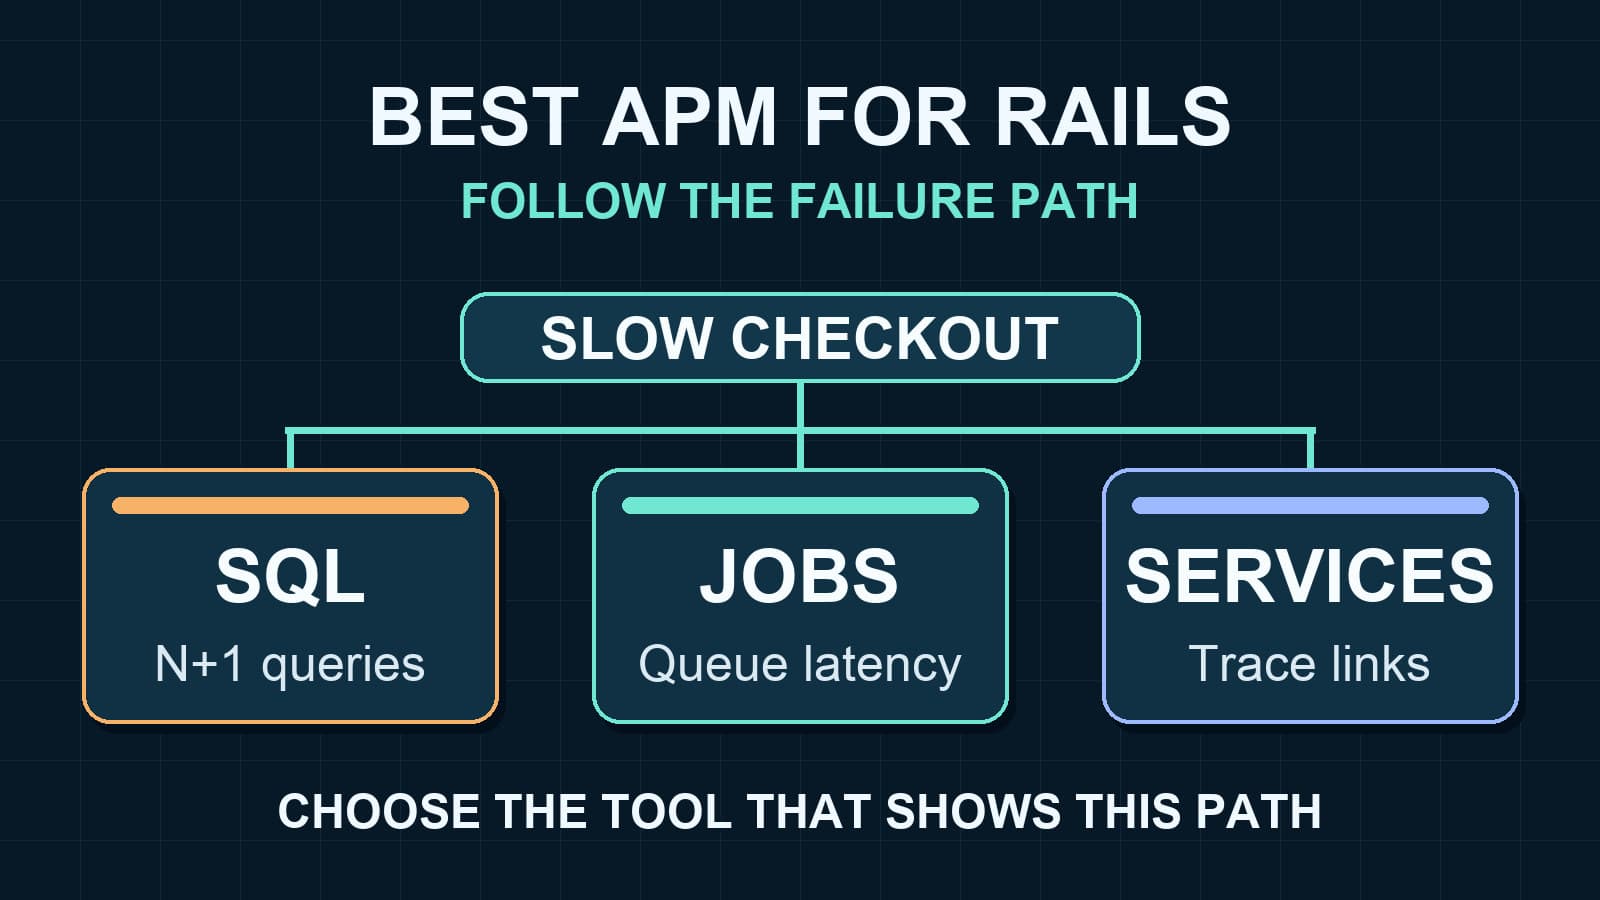
Best APM for Rails: Choose by Failure Path
Compare Rails APM tools for slow SQL, jobs, requests, and cross-service traces. Use a short trial to choose the evidence your team needs.