
Trace Based Alerts: Setup and Sampling Pitfalls
Set up trace based alerts for errors and latency. Check sampling, request counts, time windows, and notification context before paging.
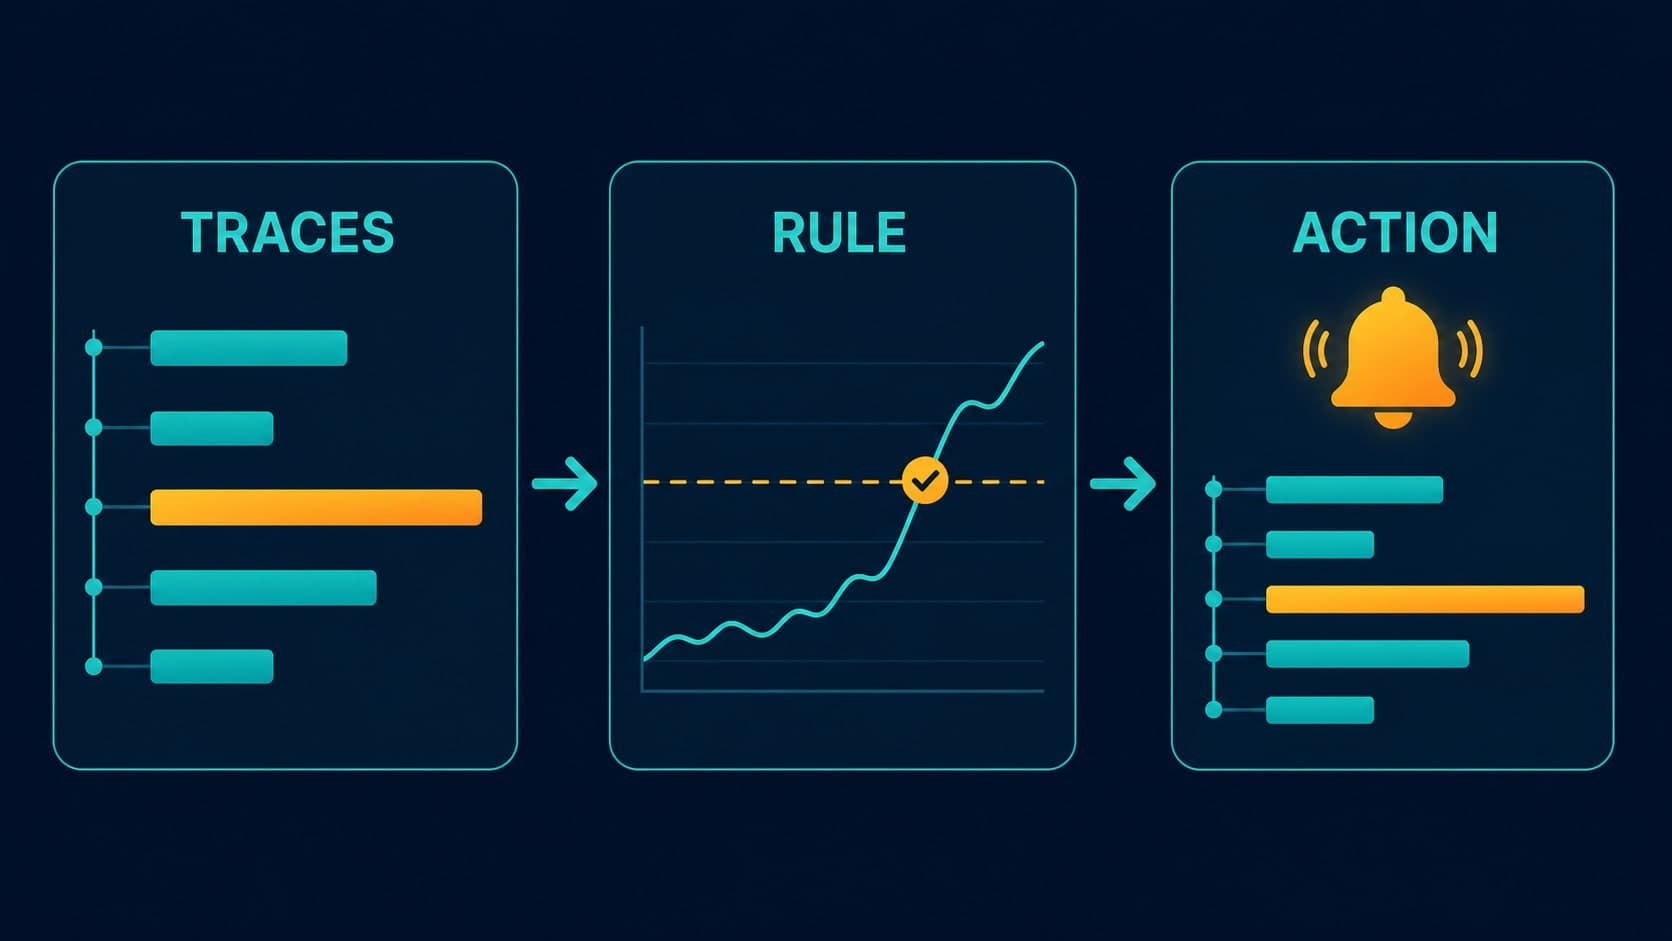
An alert says checkout is slow. You still need the affected service, the time window, and a request that explains the delay.
Trace based alerts evaluate trace data, or metrics derived from spans, against an alert condition. They can detect latency changes, error rates, or unusual operation counts.
Useful alerts connect that condition to investigation evidence. Reliable alerts also explain which requests their calculation includes.
This guide shows how to define one rule, check its data, and investigate the result. It includes a Tracekit setup example and a sampling calculation you can verify yourself.
Choose how the alert uses traces
A trace records a request path. Its spans record individual operations, such as database queries or calls between services.
Three common designs connect alerts with traces:
| Design | What the rule evaluates | Main check |
|---|---|---|
| Direct trace query | Stored traces or spans that match filters | Sampling, query limits, and span scope |
| Metrics from spans | Counts, errors, or duration histograms produced from spans | Where aggregation occurs relative to sampling |
| Metric alert with trace evidence | A separate application metric, followed by trace investigation | Matching service, operation, and time window |
The third design does not calculate the alert from traces. It still uses traces to explain the event.
Grafana's trace alert guide describes span metrics and direct TraceQL queries. Check its current release guidance before choosing the direct query path.
SigNoz's trace alert guide covers filters, span scope, aggregation, minimum data, and notification settings.
Choose the design that gives you a trustworthy measurement and enough evidence to act.
1. Define the request population
Before choosing a threshold, write down exactly what you count.
For an illustrative checkout rule, the population might be:
Environment: production
Service: checkout-api
Operation: POST /checkout
Unit: one inbound server request
Measurement: failed requests / total requests
Window: the previous five minutes
This is a rule specification, not an importable configuration file.
Keep the numerator and denominator aligned. Both must use the same service, operation, environment, time window, and request unit.
Do not divide failed spans by total traces. One request can contain many spans, including retries and parallel calls.
Also define what failure means. A handled dependency error can appear inside a request that ultimately succeeds. Your customer failure rate and your internal error rate answer different questions.
Choose stable operation names. Use POST /checkout, rather than a different name for every order ID.
2. Check sampling before trusting the percentage
OpenTelemetry distinguishes head sampling from tail sampling. Head sampling decides early. Tail sampling can use information such as errors or latency.
That distinction matters when you calculate a rate from retained traces.
Consider this invented example:
| Population | Successful requests | Failed requests | Error rate |
|---|---|---|---|
| All requests | 950 | 50 | 5% |
| Retained traces | 50 | 50 | 50% |
The retention policy kept every failure and only some successful requests. The application did not suddenly become ten times less reliable.
The denominator changed:
Actual error rate   = 50 / (950 + 50) = 5%
Retained error rate = 50 / ( 50 + 50) = 50%
Use this distinction when you design the rule:
- Use complete request counters when you need the total request error rate.
- If you derive metrics from spans, identify every sampling step before that calculation.
- Check whether the backend applies supported sampling weights before treating estimates as totals.
- Treat uncorrected, selectively retained traces as investigation evidence.
Generating metrics before tail sampling does not recover requests that head sampling already removed.
Grafana Tempo's span metrics documentation describes counters and duration histograms derived from spans. These measurements describe the spans the generator receives.
Also check query limits, late arrivals, and incomplete traces. A calculation over the latest subset can differ from the whole window.
3. Separate the window, duration, and cooldown
These controls have different jobs:
| Control | Meaning | Question to answer |
|---|---|---|
| Lookback window | Data included in each calculation | Which requests contribute? |
| Evaluation interval | Time between rule checks | How often does the rule run? |
| Pending duration | Required persistence before firing, when supported | Must the condition remain true? |
| Cooldown or repeat interval | Delay between notifications | When can another notification arrive? |
A five-minute lookback does not necessarily require five minutes of continuous failure. A single evaluation can find a high aggregate.
For example, Prometheus uses for to require persistence. The alert must remain active across evaluations for that duration.
Do not assume every product's time-window setting has that meaning.
Choose thresholds from your service requirements and normal traffic. A useful checkout threshold can be unsuitable for a slow background export.
For sparse traffic, check the request count alongside the rate. One failure from two requests gives 50%, but does not establish a stable trend.
Treat missing data as a separate condition. Zero errors can mean healthy traffic, no traffic, or a broken telemetry pipeline.
4. Configure a service alert in Tracekit
Tracekit accepts OTLP traces over HTTP. If you already use OpenTelemetry, configure the documented exporter endpoint and authentication header.
Confirm that recent traces appear under the expected service before you create the rule.
Then open Alert Rules and create a latency rule for one service. The following values form an illustrative starting configuration, not universal thresholds:
| Setting | Example value |
|---|---|
| Name | Checkout service latency |
| Alert Type | Latency |
| Scope | Service |
| Service | checkout-api |
| Metric | P95 |
| Operator | Greater than |
| Threshold | 1000 ms |
| Time Window | 5 minutes |
| Cooldown | 15 minutes |
| Severity | Warning |
Select a configured notification channel. Adjust the threshold and severity after you compare the rule with normal service traffic.
The current Tracekit evaluator calculates service latency from stored trace durations. It supports average, P50, P95, and P99 latency, plus error-rate and throughput rules.
For this rule, the time window selects recent traces. The cooldown controls repeat triggering; it does not establish a continuous breach requirement.
Two implementation details matter when you interpret the result:
- The current evaluator fetches at most 10,000 traces for an evaluation.
- Percentile calculations require at least 10 traces; below that count, the evaluator returns zero for the percentile.
Ten traces is an implementation guard, not a guarantee of a reliable tail estimate. A zero result does not prove low latency.
At high volume, the fetch limit can restrict the evaluated population. With sampling, the result describes retained trace data.
Use independent request metrics when you need complete traffic counts or a formal service-level measurement.
This example uses service scope. Its result describes service traces, rather than an isolated route within that service.
5. Make the notification useful
An alert should tell the responder what changed and where to start.
Record these details in the rule description, notification, or linked investigation notes, as your tool supports:
- Affected service and operation
- Current value, threshold, and units
- Evaluation window and request count
- Sampling or population limits
- Responsible team
- Investigation steps and relevant trace links
Here is an illustrative investigation note:
Symptom: checkout-api P95 exceeds 1000 ms
Window: previous five minutes
Population: stored checkout-api traces
First check: compare slow and normal checkout requests
Next check: inspect payment calls and database spans
Owner: checkout team
Do not imply that every notification automatically includes every field. Verify the actual message before relying on it.
Google's SRE monitoring guidance recommends alerts that justify human action. Route nonurgent investigations to a review queue when your workflow supports one.
6. Investigate the alert with matching traces
Open traces from the same service and time window as the alert. Select several slow requests and a normal request for comparison.
Then follow this sequence:
- Confirm the operation and trace duration.
- Find the longest relevant dependency or application stage.
- Check retries, repeated database calls, and parallel work.
- Compare the pattern across several affected requests.
- Inspect release metadata when available.
- Verify the suspected cause with additional evidence.
Do not add overlapping span durations as though all operations ran sequentially.
Use the code latency investigation guide for a detailed trace workflow. Use the N+1 query guide when repeated database spans dominate.
A threshold crossing identifies a symptom. Several matching traces help explain it. Neither automatically proves the root cause.
7. Validate the rule before paging
Use a controlled test environment and a test notification destination.
| Test case | What to verify |
|---|---|
| Normal traffic | The rule remains quiet |
| Sustained slow requests | The expected calculation crosses the threshold |
| Brief spike | The timing controls behave as documented |
| Sparse requests | The rule handles a small population correctly |
| No telemetry | You distinguish missing data from recovery |
| Sampling change | The reported rate still means what you expect |
| Recovery | The alert state and repeat notifications behave as expected |
Inspect the delivered message. Follow its links and confirm that the receiving team can reach the evidence.
Check the actual recovery behavior. A cooldown alone does not define when an alert resolves.
For larger alert systems, Prometheus separates rule evaluation from notification management. Alertmanager handles functions such as grouping, inhibition, silencing, and delivery.
Keep those responsibilities clear even when one product provides both.
Common questions
Are trace based alerts the same as anomaly detection?
No. A trace alert can use a fixed threshold. Anomaly detection compares behavior with an expected pattern or baseline.
Either approach still needs a useful population, sufficient data, and an action plan. Compare anomaly detection tools for small teams when you need baseline-based detection.
Can I calculate error rates from sampled traces?
You can calculate the error rate of the retained traces. Whether it estimates all requests depends on sampling and supported statistical correction.
Do not use an unweighted, error-biased sample as the total request error rate.
Should every slow trace send an alert?
Usually, start with an aggregate condition that reflects a meaningful service problem. Use individual traces as evidence for the investigation.
An individual event can justify an alert when its business impact requires immediate action. Define that exception explicitly.
Where should I start with Tracekit?
Verify incoming traces, choose one service, and configure one warning rule with a test destination. Check its calculation and notification before enabling urgent delivery.
The Tracekit alerting page explains the wider alert workflow. The Alert Rules documentation provides the setup controls.
Related Posts
Node.js Response Time Monitoring by Route
Measure Node.js response time by route, read p95 latency with traces, and separate event loop delays from database and API waits.
ActiveRecord Performance Monitoring in Rails
Monitor ActiveRecord query count, SQL time, and object instantiation in Rails. Use request traces to confirm production bottlenecks.
Sentry Performance Units vs Spans: What Changed?
Learn when Sentry performance units still apply, how legacy transactions were counted, and why current span quotas need a different estimate.