
Node.js Monitoring Dashboard: 8 Production Panels
Build a Node.js monitoring dashboard with eight panels that connect request impact, event loop health, memory, and slow traces.
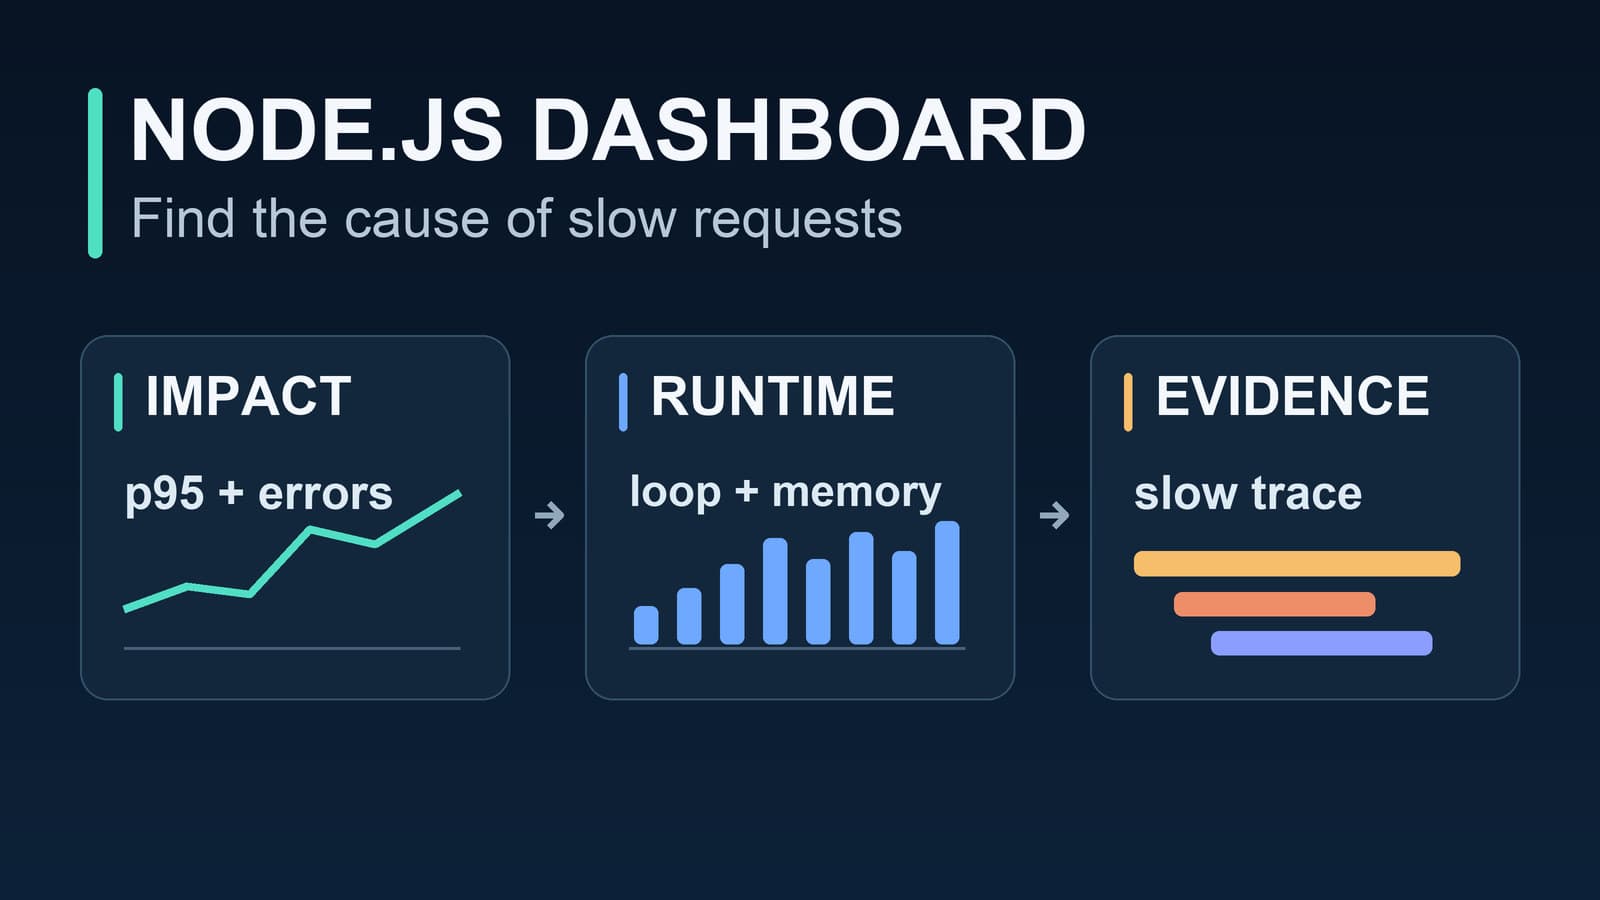
A Node.js monitoring dashboard should tell you whether users are affected, which part of the runtime changed, and where to inspect next. A wall of CPU and memory charts cannot answer those questions alone. Start with eight panels in three rows: request impact, runtime health, and trace evidence.
This is a dashboard blueprint, not an importable Grafana template. You can build it with an OpenTelemetry and Grafana stack or a managed APM. The panel names and checks stay useful in either setup.
The eight panels
| Row | Panel | Show | What it helps you decide |
|---|---|---|---|
| User impact | Request rate | Requests per minute, split by service and route | Did traffic change before latency rose? |
| User impact | Response time | p50, p95, and p99 by route | Which route has a slow tail? |
| User impact | Error rate | Failed requests divided by total requests | Is the slowdown also causing failures? |
| Runtime health | Event loop delay | p95 delay in milliseconds | Is synchronous work delaying other requests? |
| Runtime health | Event loop utilization | Active time as a fraction of elapsed time | Is the event loop busy for a sustained period? |
| Runtime health | Memory | Heap used and resident set size, in bytes | Is memory growing, and which part grows? |
| Trace evidence | Dependency time | Database and outbound HTTP span duration | Is a dependency consuming the request budget? |
| Trace evidence | Slow request examples | Traces for the selected route and time window | Which operation and input path explain the chart? |
Keep the first three panels visible without scrolling. They show whether an incident affects requests. Place the runtime panels below them, then link each route view to example traces. This order prevents a memory spike from becoming the assumed cause of an unrelated slow request.
Use bounded dimensions such as service, environment, route template, method, and status class. Do not make a separate metric series for every user ID or raw URL. If you use Grafana, its dashboard variables can apply service and environment selections across panels.
Define each signal before drawing it
Request rate counts completed requests in a fixed window. Error rate needs the same request population in its numerator and denominator. Show both beside latency, because a low-traffic route can have a noisy percentile, and a failing route may appear fast when it returns errors early.
For response time, keep route p95 and p99 separate from a service-wide average. Compare a slow route with its own normal range. Then open traces from the same route and time window. A service average can hide one painful route.
Node.js provides two runtime measurements through node:perf_hooks: monitorEventLoopDelay() and performance.eventLoopUtilization(). Event loop delay values are nanoseconds, so divide by 1e6 before displaying milliseconds. Utilization is a fraction, so label its axis clearly if you display it as a percentage. The Node.js event loop guide explains how to interpret both signals.
For memory, show both heapUsed and resident set size. The Node.js process documentation explains that heapUsed measures V8 heap use, while rss includes the whole process. A growing RSS line with a steady heap line does not by itself prove a JavaScript heap leak.
Record runtime metrics in a Node.js service
Tracekit's current Node.js SDK guide documents counters, gauges, and histograms. The following example adds event loop delay, utilization, and memory to an already initialized Tracekit client. Keep the SDK initialization in the application's early startup path, as shown in the Node.js APM guide.
import { monitorEventLoopDelay, performance } from 'node:perf_hooks'
import { memoryUsage } from 'node:process'
import { client } from './instrumentation.js'

const delay = monitorEventLoopDelay({ resolution: 20 })
const delayP95 = client.gauge('nodejs.event_loop.delay_p95_ms')
const utilization = client.gauge('nodejs.event_loop.utilization_ratio')
const heapUsed = client.gauge('nodejs.memory.heap_used_bytes')
const rss = client.gauge('nodejs.memory.rss_bytes')

let previous = performance.eventLoopUtilization()
delay.enable()

setInterval(() => {
  const current = performance.eventLoopUtilization(previous)
  previous = performance.eventLoopUtilization()

  delayP95.set(Number(delay.percentile(95)) / 1e6)
  utilization.set(current.utilization)

  const memory = memoryUsage()
  heapUsed.set(memory.heapUsed)
  rss.set(memory.rss)
  delay.reset()
}, 60_000).unref()
This records one p95 delay value per interval. It does not export the full delay distribution. Keep that distinction clear when you label the panel. Measure request latency separately with request spans or a request-duration histogram. Do not treat event loop delay as request response time.
Tracekit's custom metrics guide explains how to view metrics in Metrics Explorer and add metric widgets to dashboards. Tracekit is not a general log-ingestion system. Keep normal application logs in your logger, and use traces to inspect individual requests.
Turn a red panel into a useful investigation
Use the panel combination, not one chart, to choose the next step:
| Dashboard pattern | First investigation |
|---|---|
| Route p95 rises; event loop delay rises | Check synchronous work or CPU-heavy code. Use a CPU profile when traces cannot identify the function. |
| Route p95 rises; event loop delay stays normal | Open a slow trace and compare database or outbound HTTP spans. |
| RSS rises; heap used stays steady | Check buffers, native allocations, and process behavior before calling it a heap leak. |
| Error rate rises after a release | Compare failed traces and release metadata for the affected route. |
| Request rate falls; errors stay flat | Check ingress, upstream traffic, deployment, and health signals. |
A trace shows where time went, but a wide span does not prove which JavaScript function used CPU. Node.js CPU profiling is the next tool for that question. Tracekit does not collect continuous CPU profiles.
For a database pattern, inspect repeated child spans. The N+1 query guide gives a trace-based investigation method. For a route-specific latency drilldown, use the Node.js response time guide.
Grafana or a managed APM?
If your team already exports metrics to Prometheus, Grafana can show these panels. Add service, environment, and route variables, then link the dashboard to your trace backend. Grafana's dashboard documentation covers panels and links. You still need to define the metrics and verify that the selected trace matches the chart window.
If you use Tracekit, the Node.js integration sends traces and supports custom metrics. Its Metrics Explorer and dashboard widgets can show the runtime measurements above. Tracekit alert rules cover service error rate, latency, and throughput. Connect a dashboard change to a representative trace before you decide what code to change.
Check the dashboard with one controlled request
Before you trust the dashboard in an incident, send a request through a known route that calls a database or another service. Verify all of these items:
- Request rate increases for the expected route and environment.
- The request appears in the response-time distribution.
- Its trace contains the server span and the expected dependency span.
- Event loop and memory panels show the correct units.
- The dashboard link opens a trace from the same time window.
- A worker or queue job appears under its own service when it runs outside the request.
If one item fails, fix instrumentation before adding more panels. A small dashboard with a reliable trace path is more useful than a large dashboard with missing evidence.
Related Posts
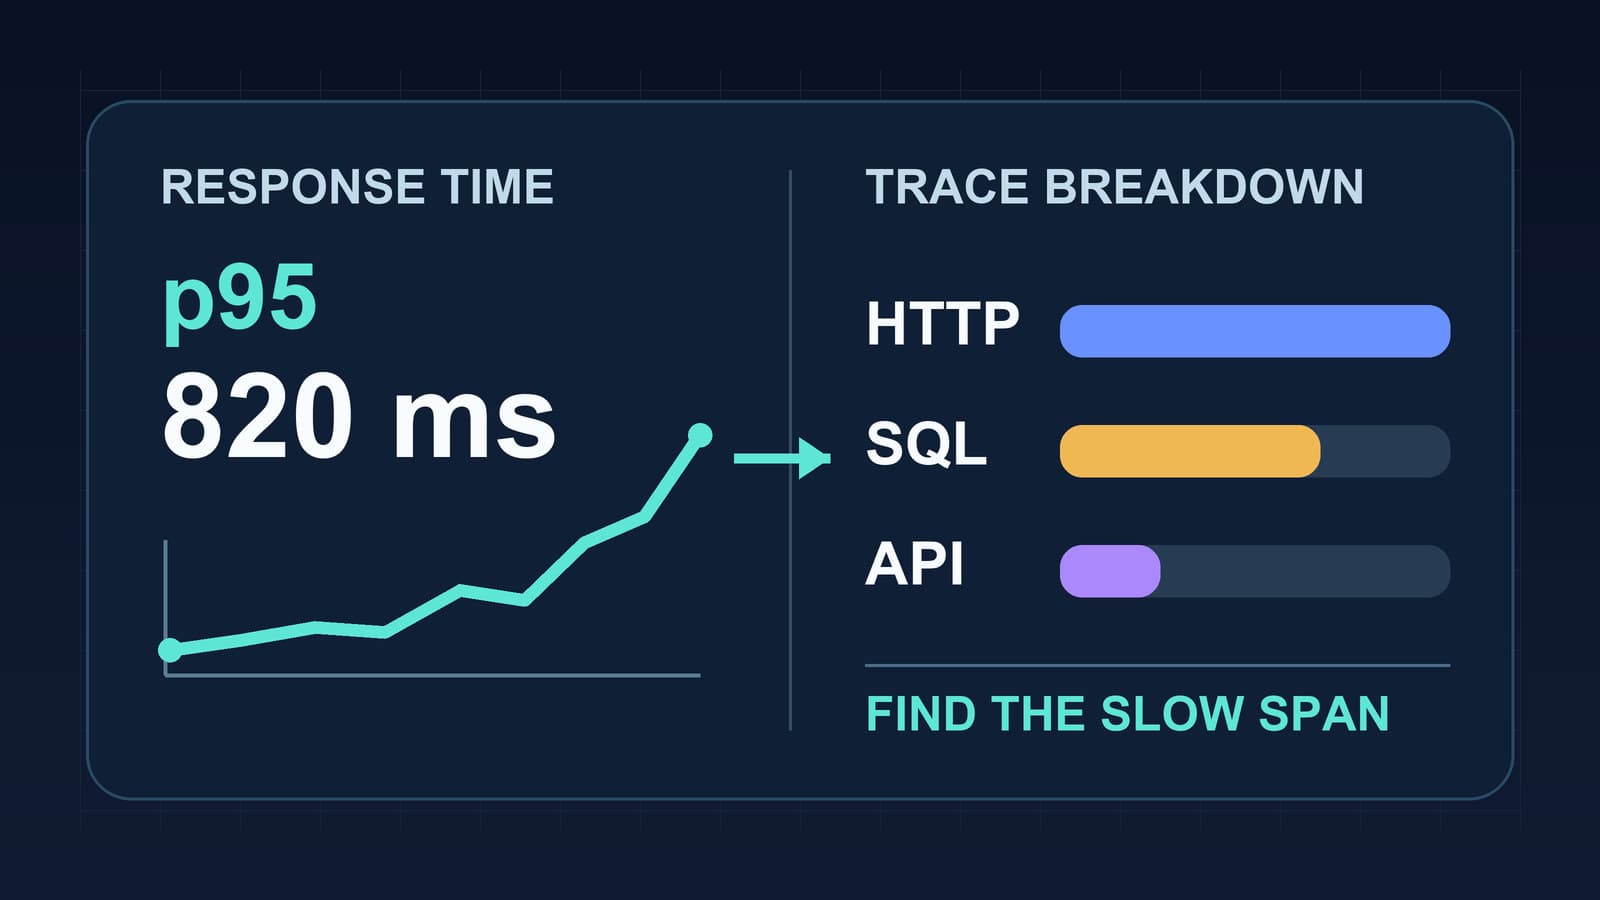
Node.js Response Time Monitoring by Route
Measure Node.js response time by route, read p95 latency with traces, and separate event loop delays from database and API waits.
Node.js monitorEventLoopDelay and eventLoopUtilization
Use Node.js monitorEventLoopDelay and eventLoopUtilization to measure event-loop lag, export useful metrics, and debug blocking production code.
Your API Just Threw a 500. Here's How to Actually Fix It.
Your API threw a 500 at 3 AM. A systematic approach to diagnose, trace, and fix production API errors without the panic and guesswork.