
Flask Performance Monitoring in Production
Set up Flask performance monitoring with request metrics and traces. Find slow routes, database calls, and failed exports before users report them.
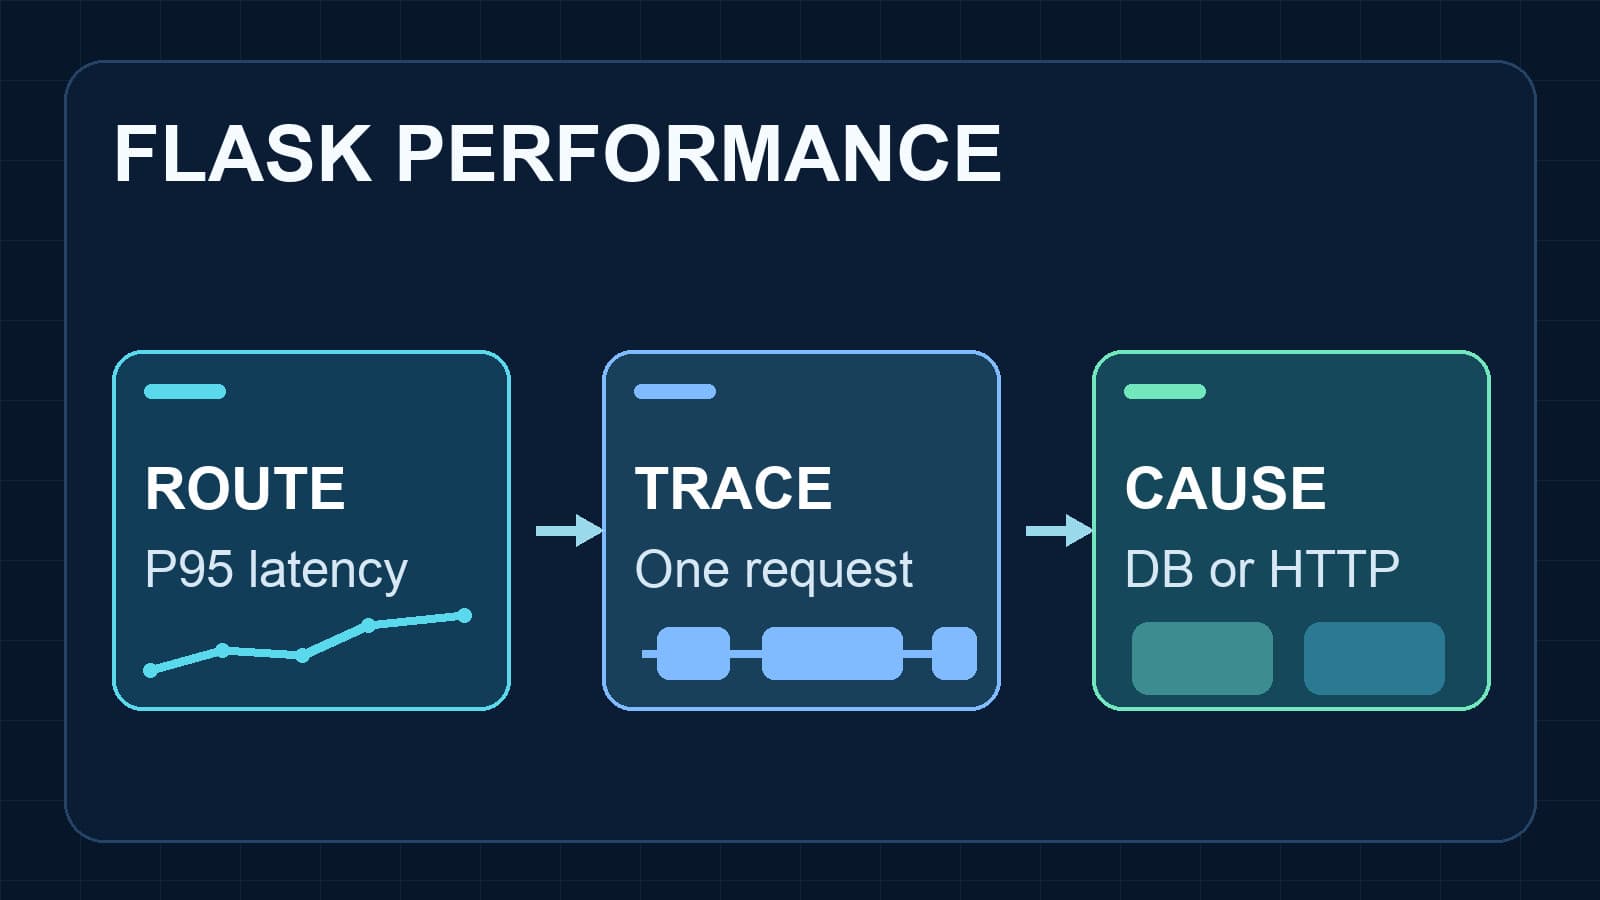
Flask performance monitoring starts with three questions: Which routes are slow, how often do they fail, and where does the request time go? A request duration chart locates the problem. A trace explains one slow request. You need both views because a single trace does not show how often the problem affects users.
This guide gives you a small production setup. It shows what to measure, how to instrument Flask with OpenTelemetry, and how to check that the data reaches your backend.
Measure four things first
| Signal | Question | Check |
|---|---|---|
| Request duration | Which routes have slow tail latency? | Compare P95 by route and time window. |
| Request rate | Did traffic change? | Compare the same route before and during the incident. |
| Error rate | Did failed requests rise? | Split failures by route and status class. |
| Dependency spans | Where did one slow request spend time? | Compare database, outbound HTTP, and application spans. |
OpenTelemetry recommends http.server.request.duration for HTTP server duration. Its unit is seconds. Some installed Python instrumentation still emits an older metric name or unit. Check your exported data before you build a dashboard or alert. See the HTTP metric specification and migration notes.
Do not use a single average as your only latency measure. A few slow requests can hide behind a normal average. Compare a duration distribution and inspect an affected trace.
Instrument the production Flask process
Flask's built-in server is for development. Flask's deployment guide recommends a production WSGI server or hosting platform. Instrument the command that runs in production, not only a local flask run command.
For an existing Flask service, start with OpenTelemetry's Python distribution and OTLP exporter:
pip install opentelemetry-distro opentelemetry-exporter-otlp
opentelemetry-bootstrap -a install
Run the bootstrap step after you install Flask and the service's other dependencies. It finds matching instrumentation packages. Pin the resolved packages in your production dependency file. The OpenTelemetry Python example uses Flask to explain this setup.
Set a stable service name and exporter settings. This example sends telemetry to an OTLP HTTP receiver. Replace the endpoint and headers with your backend's documented values.
export OTEL_SERVICE_NAME="checkout-flask-api"
export OTEL_TRACES_EXPORTER="otlp"
export OTEL_METRICS_EXPORTER="otlp"
export OTEL_EXPORTER_OTLP_PROTOCOL="http/protobuf"
export OTEL_EXPORTER_OTLP_ENDPOINT="https://your-otlp-receiver.example"

opentelemetry-instrument gunicorn "app:app"
Set the endpoint to the correct base URL for your receiver. Some backends require separate trace and metric endpoints. Keep authentication values in your deployment secret store. The Python exporter guide explains OTLP exporter options.
Use one method to create Flask server spans. Do not add both the zero-code Flask agent and another Flask request middleware without checking for duplicate spans. The Flask instrumentation reference documents manual FlaskInstrumentor().instrument_app(app) setup and URL exclusions.
Verify the first request
Send one request through the deployed WSGI server. Then verify these facts:
- A server span exists for the request.
- The span has the expected service name, route, status, and duration.
- A request duration metric appears if your installed instrumentation emits it.
- The exporter reports no authentication, timeout, or connection error.
- A failing route creates a useful error signal without exposing sensitive request data.
If only traces arrive, do not assume metrics are present. Check the installed instrumentation, OTEL_METRICS_EXPORTER, endpoint, and receiver support. If neither signal arrives, check the production launch command and exporter logs before changing sampling.
Find the slow part of one Flask request
Start with a slow route and its time window. Open a trace from that route. Compare the server span with child spans for SQL queries and outbound HTTP calls.
| Trace shape | Likely next check |
|---|---|
| One long database span | Inspect that query and its plan. |
| Many short database spans | Check for an N+1 query pattern. |
| One long outbound HTTP span | Inspect the downstream service and timeout. |
| Large unaccounted application time | Add a manual span around the suspected operation. |
Automatic Flask instrumentation covers the request edge. It does not explain every function inside the handler. OpenTelemetry supports manual child spans when you need that detail:
from opentelemetry import trace

tracer = trace.get_tracer(__name__)

def load_recommendations(user_id):
    with tracer.start_as_current_span("recommendations.load"):
        return fetch_recommendations(user_id)
Add database or HTTP client instrumentation for the libraries your service actually uses. The Python instrumentation library guide explains how to add a matching package. A slow function with no child span remains hidden until you instrument it.
Send the evidence to Tracekit
Tracekit accepts OTLP traces and metrics. The Python integration guide also documents a Tracekit Flask middleware path. Pick one Flask server instrumentation path for a service and verify its output before adding another.
With the direct OTLP path, set the documented Tracekit trace and metric endpoints and API-key header. The Python performance monitoring guide shows that configuration. Tracekit's distributed tracing page explains how to inspect request paths.
When a trace points to application code but lacks the needed variable values, Tracekit dynamic logs can capture runtime state at a selected capture point. Treat this as a focused debugging step. It is not general log ingestion or a CPU profiler.
A small production checklist
- Run instrumentation in every production worker process.
- Keep service names stable across deployments.
- Verify actual metric names and units before you configure alerts.
- Test one successful request and one failed request.
- Check database and outbound HTTP spans where those libraries are instrumented.
- Exclude high-volume health checks only after you confirm the exclusion pattern.
- Recheck exporter errors and trace coverage after dependency changes.
For a wider Django, Flask, and FastAPI plan, use the Python application performance monitoring guide. For repeated SQL calls, use the N+1 query detection guide.
Related Posts
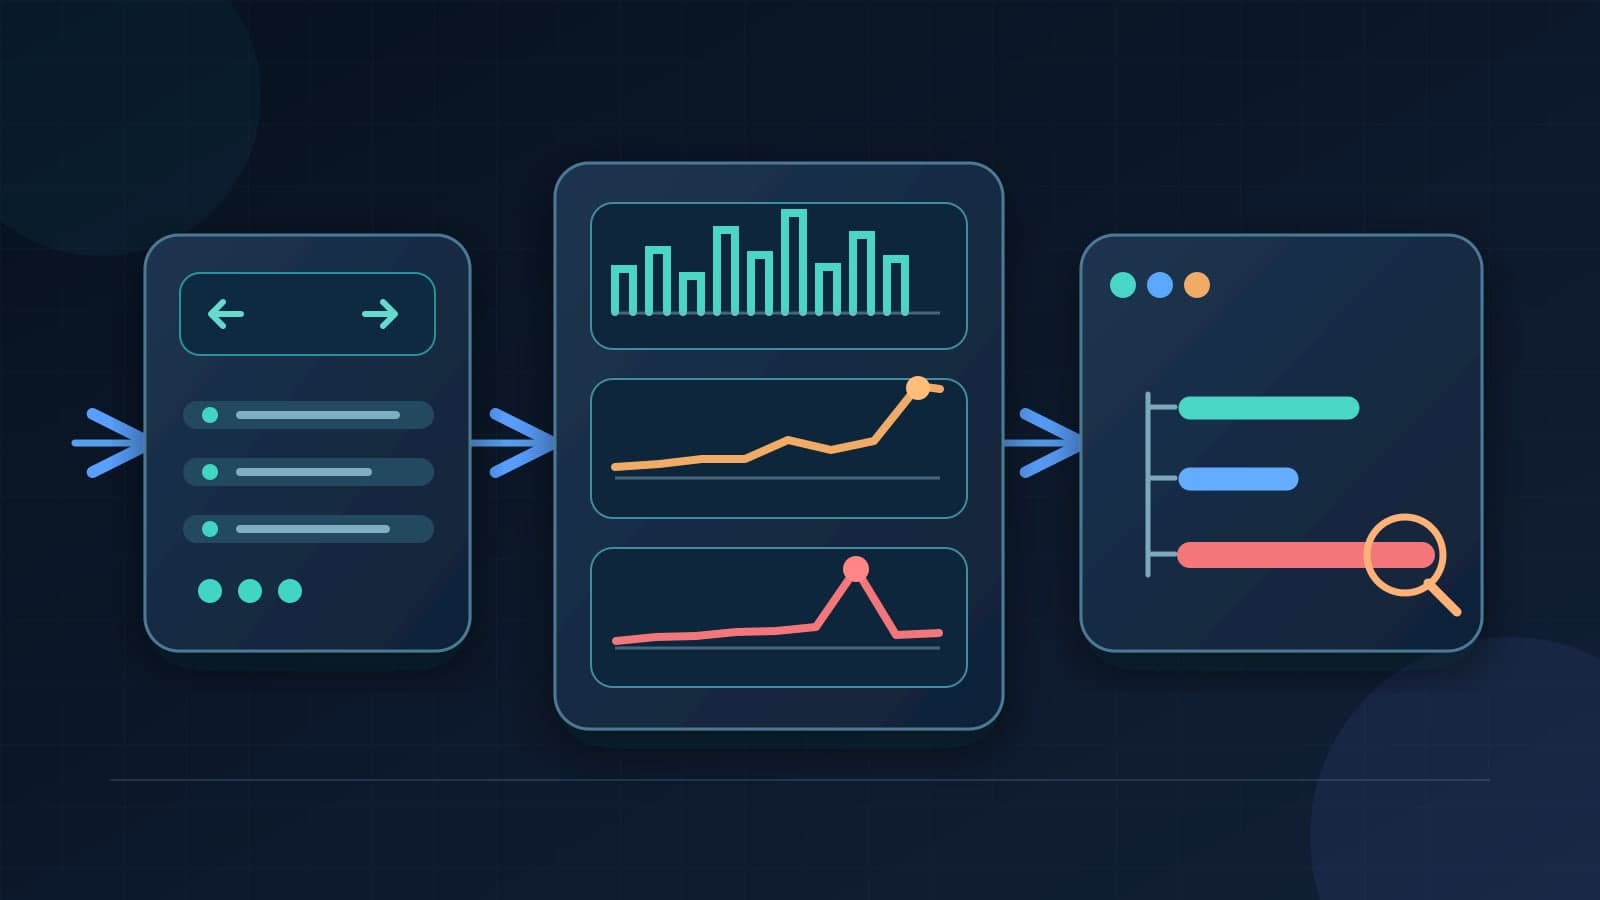
FastAPI Monitoring with OpenTelemetry in Production
Monitor FastAPI routes with request metrics and OpenTelemetry traces. Check latency, errors, and downstream work before setting alerts.
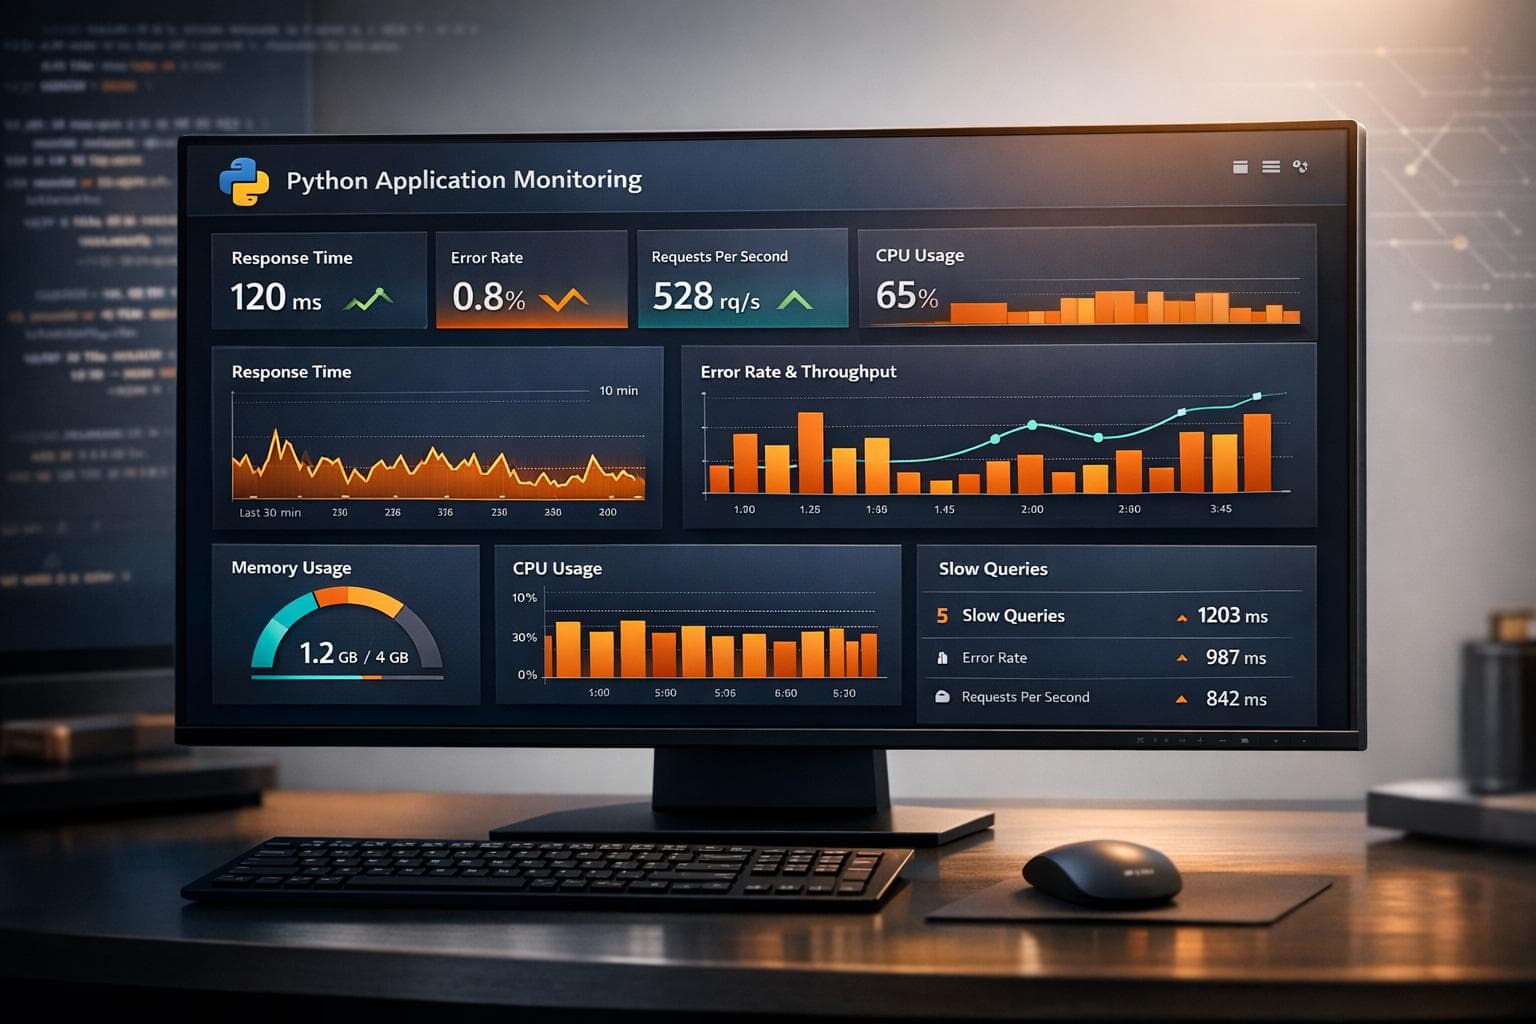
Python Application Performance Monitoring with OpenTelemetry
Set up Python application performance monitoring with OpenTelemetry. Measure latency, errors, throughput, and dependency spans across production requests.

FastAPI Tracing with OpenTelemetry: A Practical Setup
Set up FastAPI tracing with OpenTelemetry. Connect request, SQLAlchemy, and HTTPX spans, then verify trace context across services.