
Rails N+1 Query Detection: Find and Fix Lazy Loads
Detect Rails N+1 queries with SQL notifications and strict loading. Fix lazy associations with includes, then verify the request trace.
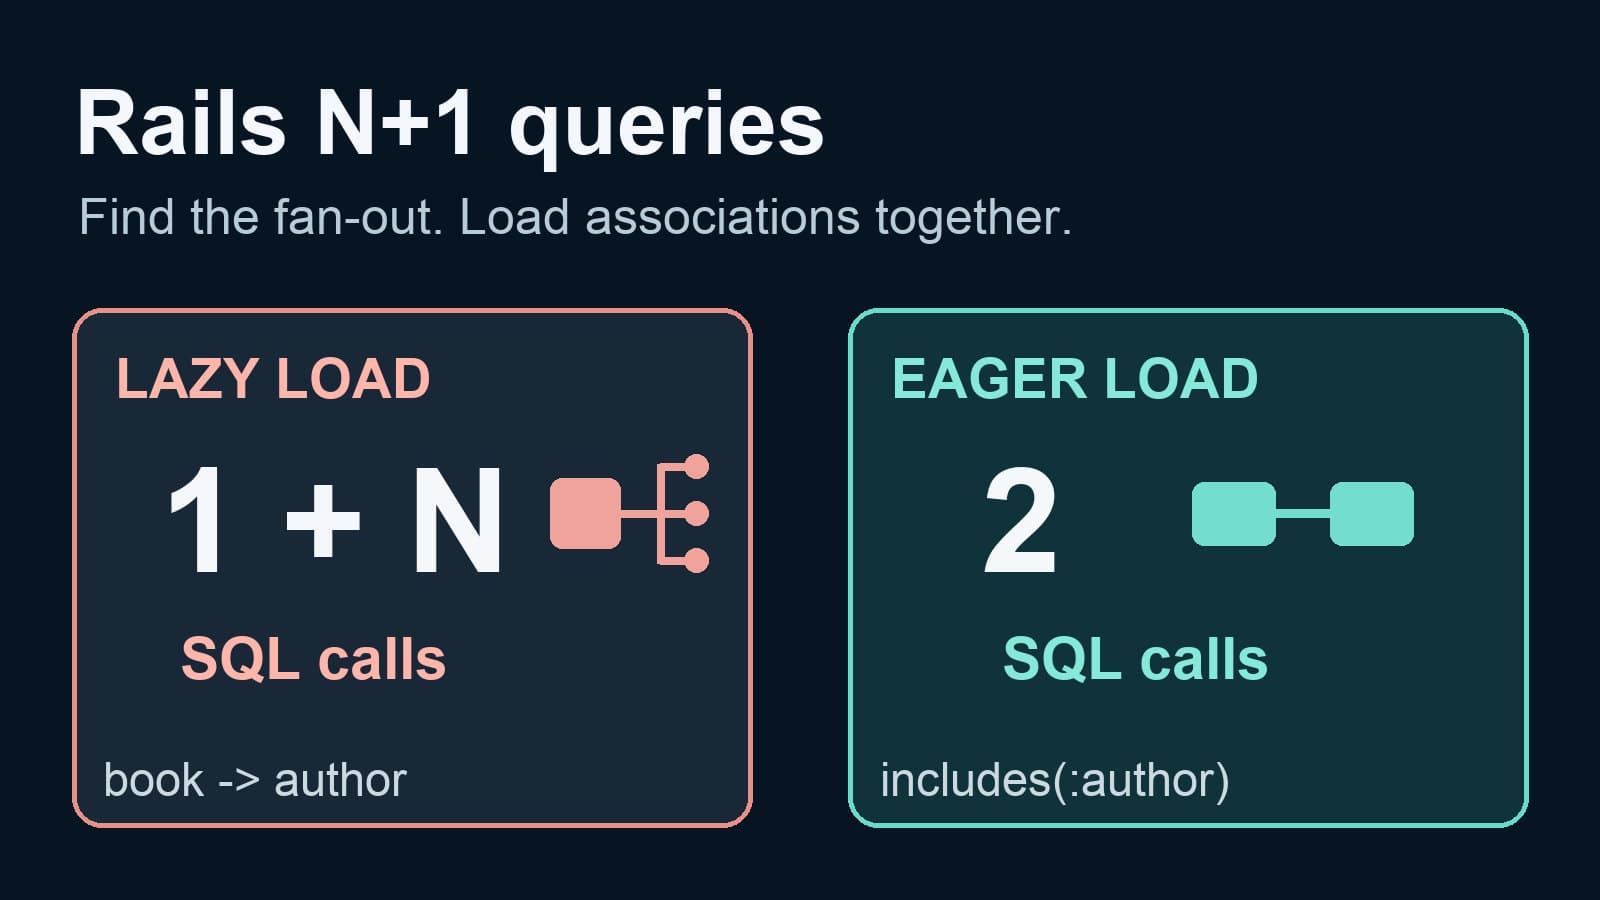
A Rails N+1 query starts with one query for a list. Rails then runs another query for each record when code reads an unloaded association. A page with 20 books can run one book query and 20 author queries. The extra work often hides in a view or serializer, after the controller builds its relation.
To detect the pattern, count SQL calls while the page renders. Then check which association loads inside a loop. Use includes or preload for that association, add a strict-loading guard, and compare the query count again. In production, a request trace can show whether the repeated database work affected a real route.
Reproduce the query fan-out
Assume that Book belongs to Author. This code reads one author for each book:
books = Book.limit(20)
rows = books.map { |book| [book.title, book.author.name] }
Rails loads the books when map evaluates the relation. It can then load each author on demand. The Rails Active Record guide uses this same pattern to explain N+1 queries.
| List size | Possible query shape | Sign to investigate |
|---|---|---|
| 5 books | One list query and up to five author queries | Repeated author loads |
| 20 books | One list query and up to 20 author queries | Query count grows with the list |
These counts are examples. A loaded or cached association can change the count. The important sign is a repeated relation lookup that grows with the list size.
Count SQL calls around the actual work
Rails publishes a sql.active_record event for database work. The Active Support instrumentation guide documents the event and its payload. Subscribe around a small, controlled reproduction:
queries = 0
subscriber = lambda do |event|
  payload = event.payload
  queries += 1 unless payload[:name] == "SCHEMA" || payload[:cached]
end

ActiveSupport::Notifications.subscribed(subscriber, "sql.active_record") do
  Book.limit(20).each { |book| book.author.name }
end

puts "Database calls: #{queries}"
Run the same block with 5 and 20 books. If the count rises with the list, inspect the association access. This example excludes schema and cached events. Your application can run other queries inside the block, so review the route and its work before you call every extra query an N+1 problem.
Count the rendered page, not only relation construction. Rails relations are lazy. A controller can appear quiet while a view or serializer triggers the extra queries. Keep SQL values and personal data out of permanent logs when you inspect the events.
Fix the association load
For this belongs_to relation, load authors before the loop:
books = Book.includes(:author).limit(20)
rows = books.map { |book| [book.title, book.author.name] }
Rails usually loads the books and their authors in a small fixed number of queries. It can choose a join when the relation needs one. The Rails eager-loading guide explains when includes, preload, and eager_load differ.
| Method | First use | Check |
|---|---|---|
includes(:author) | Load an association before iteration | Rails can choose separate queries or a join |
preload(:author) | Keep the association load in a separate query | Confirm filters do not require a join |
eager_load(:author) | Request a LEFT OUTER JOIN | Check duplicate rows and transferred data |
Do not add every association to a relation. A wide join can transfer more data than the page needs. Start with the association that caused the measured fan-out, then compare query count and response time with representative records.
Add a strict-loading regression guard
Rails strict_loading raises an error when code tries to lazy-load an association. It makes an accidental new relation access visible during development and tests. The Rails strict-loading guide also describes a log mode when raising is too disruptive.
books = Book.includes(:author).strict_loading.limit(20)
rows = books.map { |book| [book.title, book.author.name] }
Exercise the same view or serializer in a test. If someone later removes includes(:author), the association access can fail instead of silently adding one query per book. Scope strict loading to the path you test first. A global setting can expose unrelated lazy loads across the application.
Strict loading is a guard, not a performance measurement. Keep the SQL count or a representative request test so you can see whether the fix holds as the list grows.
Check the affected production request
A local test finds one known path. A production request trace helps identify which route and input size make that path expensive. Look for one request span with repeated database child spans. Compare similar requests with different list sizes, or compare the same route before and after a release.
Tracekit's Ruby integration guide describes Rails request and Active Record tracing. The Ruby SDK enables OpenTelemetry Active Record instrumentation when that library is available. Confirm that database spans appear in your own trace. A missing span can mean missing instrumentation or sampling, not zero SQL calls.
When database spans are present, use distributed tracing to find repeated database work under the slow route. If the trace shows the route but leaves a conditional branch unclear, use a bounded dynamic log capture point to inspect runtime state. Dynamic logs do not replace normal Rails application logs.
For the general method across frameworks, read the N+1 query detection guide. The OpenTelemetry trace viewer guide explains how to read a full request trace.
Verify the fix
- Run the same view with a small list and a larger list.
- Confirm that database calls stay near a fixed count.
- Confirm that the page still shows the correct authors.
- Measure response time with representative data.
- Compare production traces when database spans are available.
The fix is complete when the repeated association lookup disappears and the page remains correct. One fast request does not prove the query shape stays safe as the list grows.
Related Posts
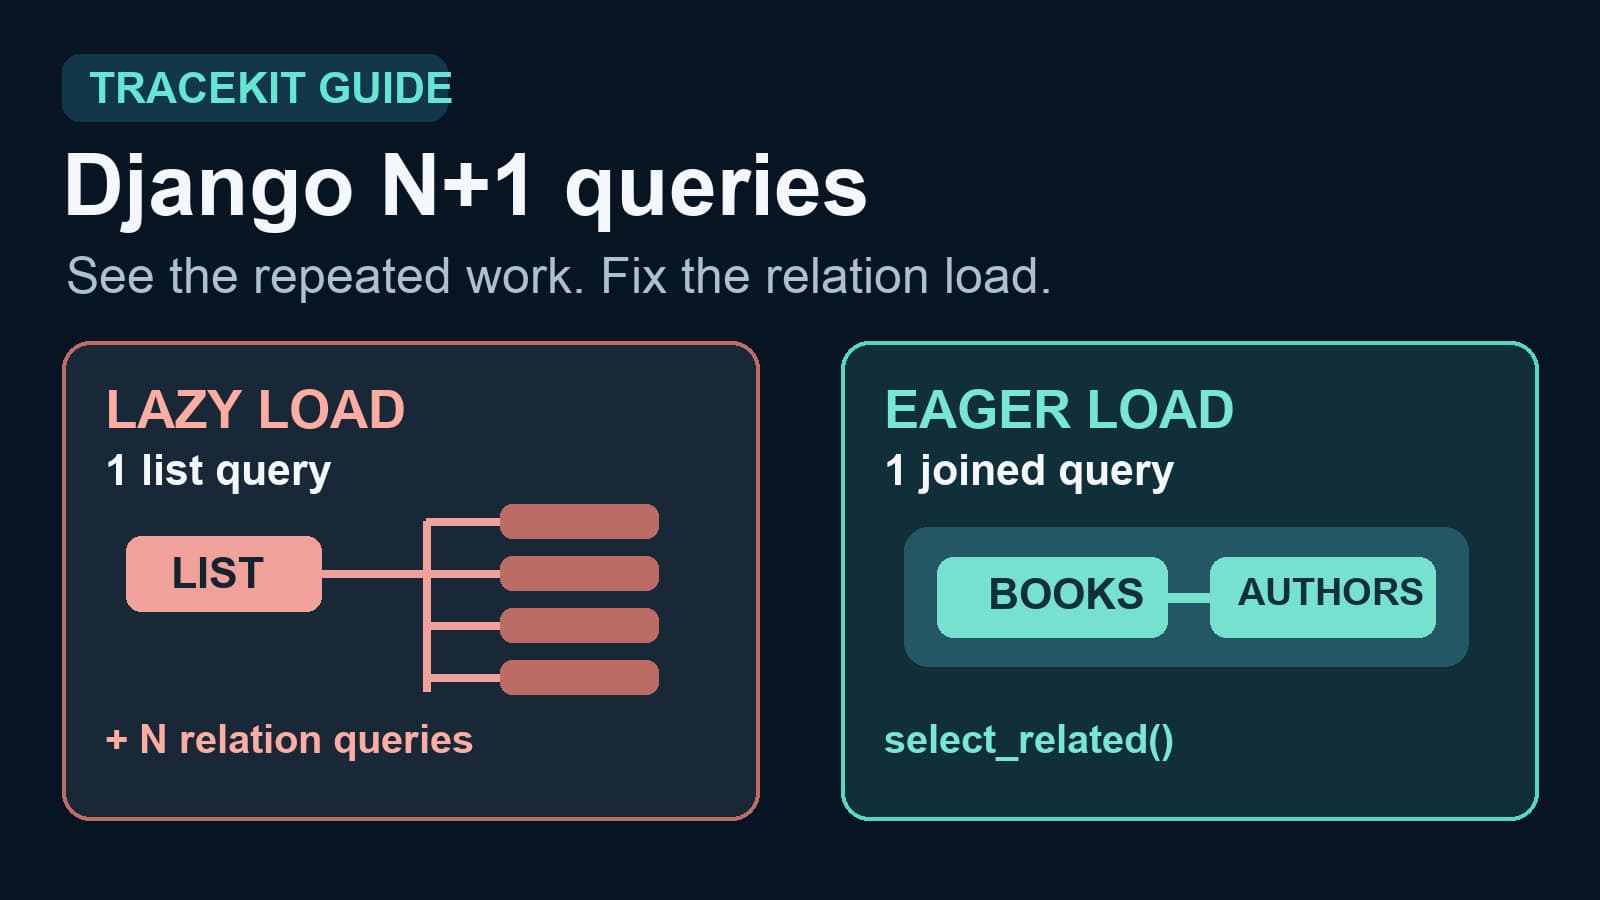
Django N+1 Query Detection: Test and Fix ORM Fan-Out
Find Django N+1 queries with query-count tests and request traces. Fix lazy relation loads with select_related or prefetch_related.
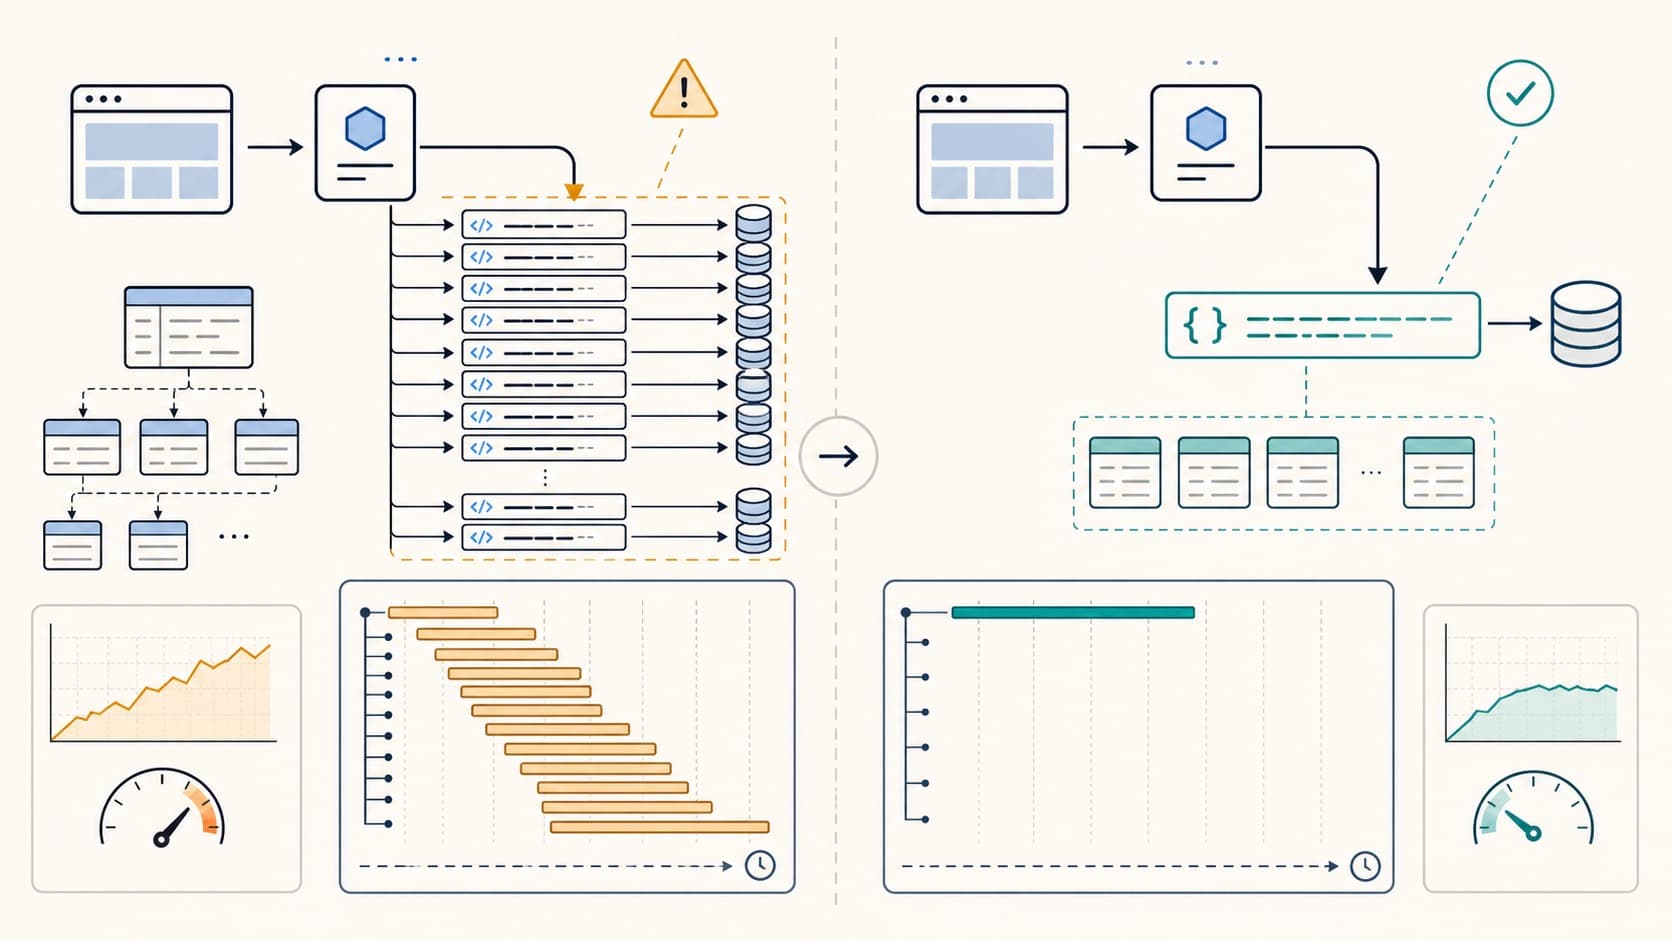
N+1 Query Detection: Find and Fix Regressions
Detect N+1 queries with query counts and traces. Find repeated database calls, fix ORM loading, and verify the result in production.
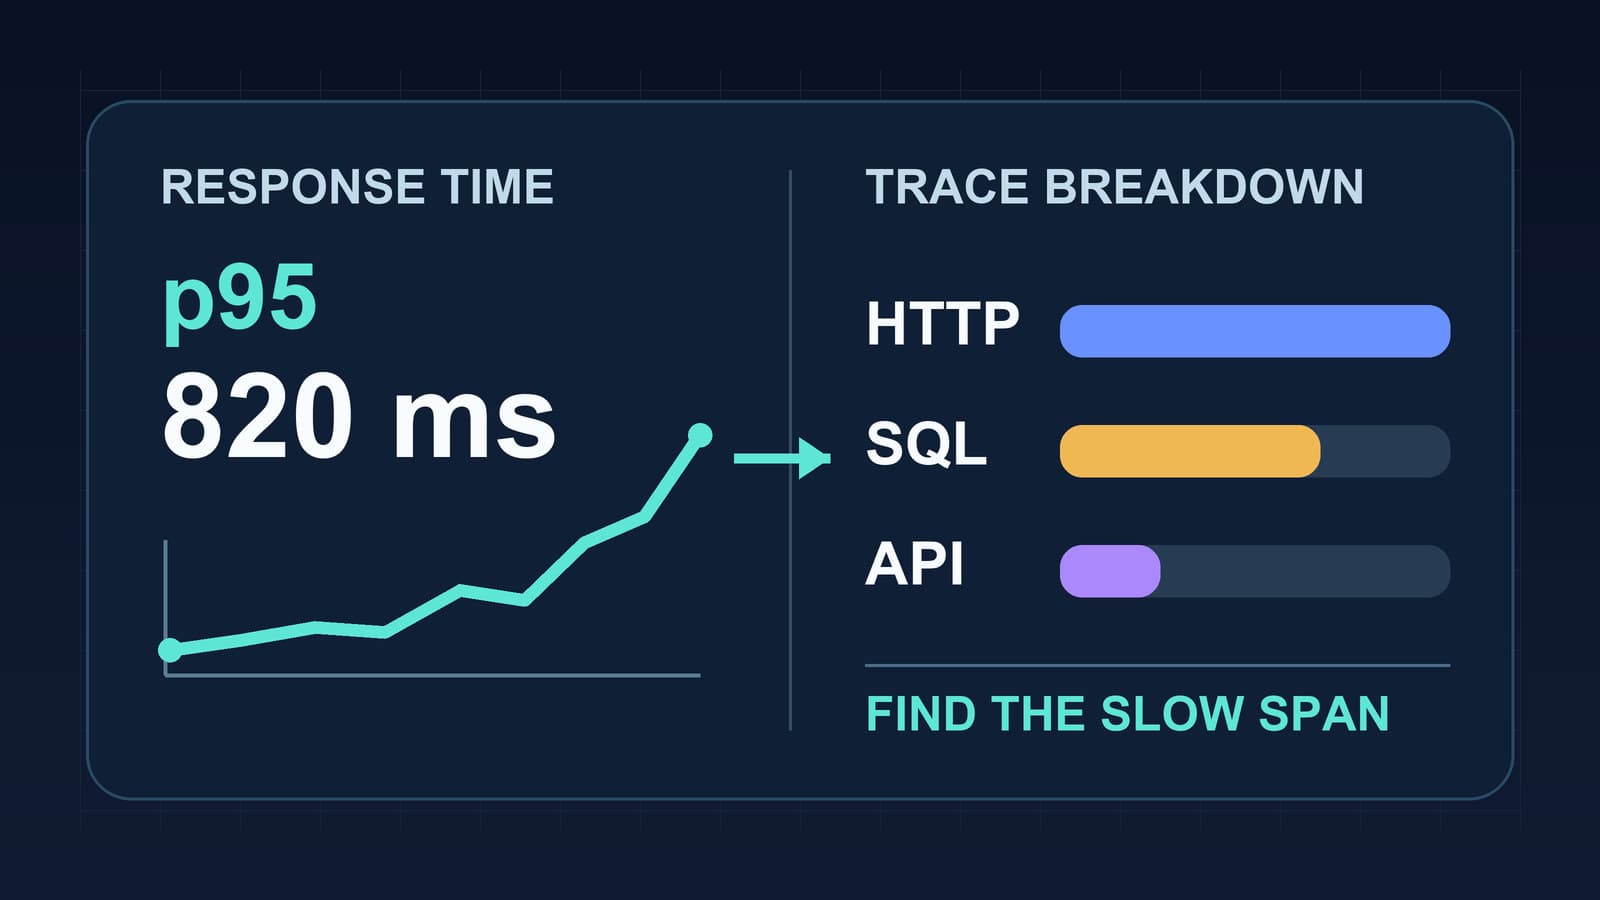
Node.js Response Time Monitoring by Route
Measure Node.js response time by route, read p95 latency with traces, and separate event loop delays from database and API waits.