
7 min
Vite Source Maps for Error Tracking
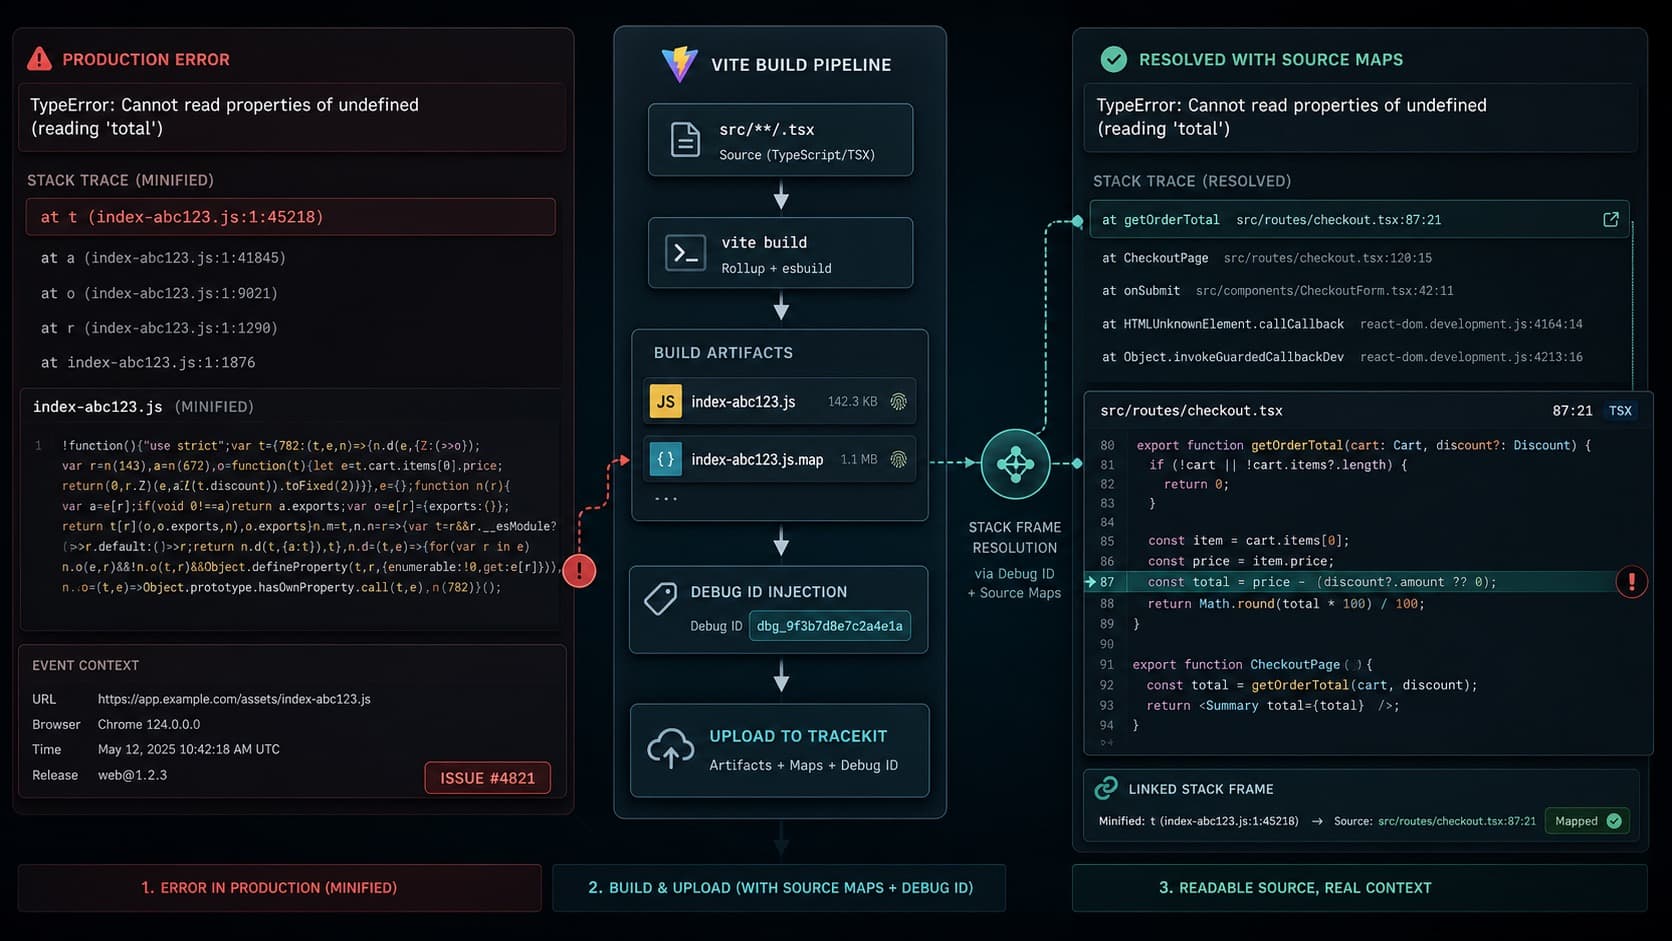
Set up Vite source maps for error tracking so production stack traces point to real files, lines, and functions instead of minified bundles.
vitesource-maps
Engineering insights on observability, distributed tracing, and production debugging.
Set up Vite source maps for error tracking so production stack traces point to real files, lines, and functions instead of minified bundles.
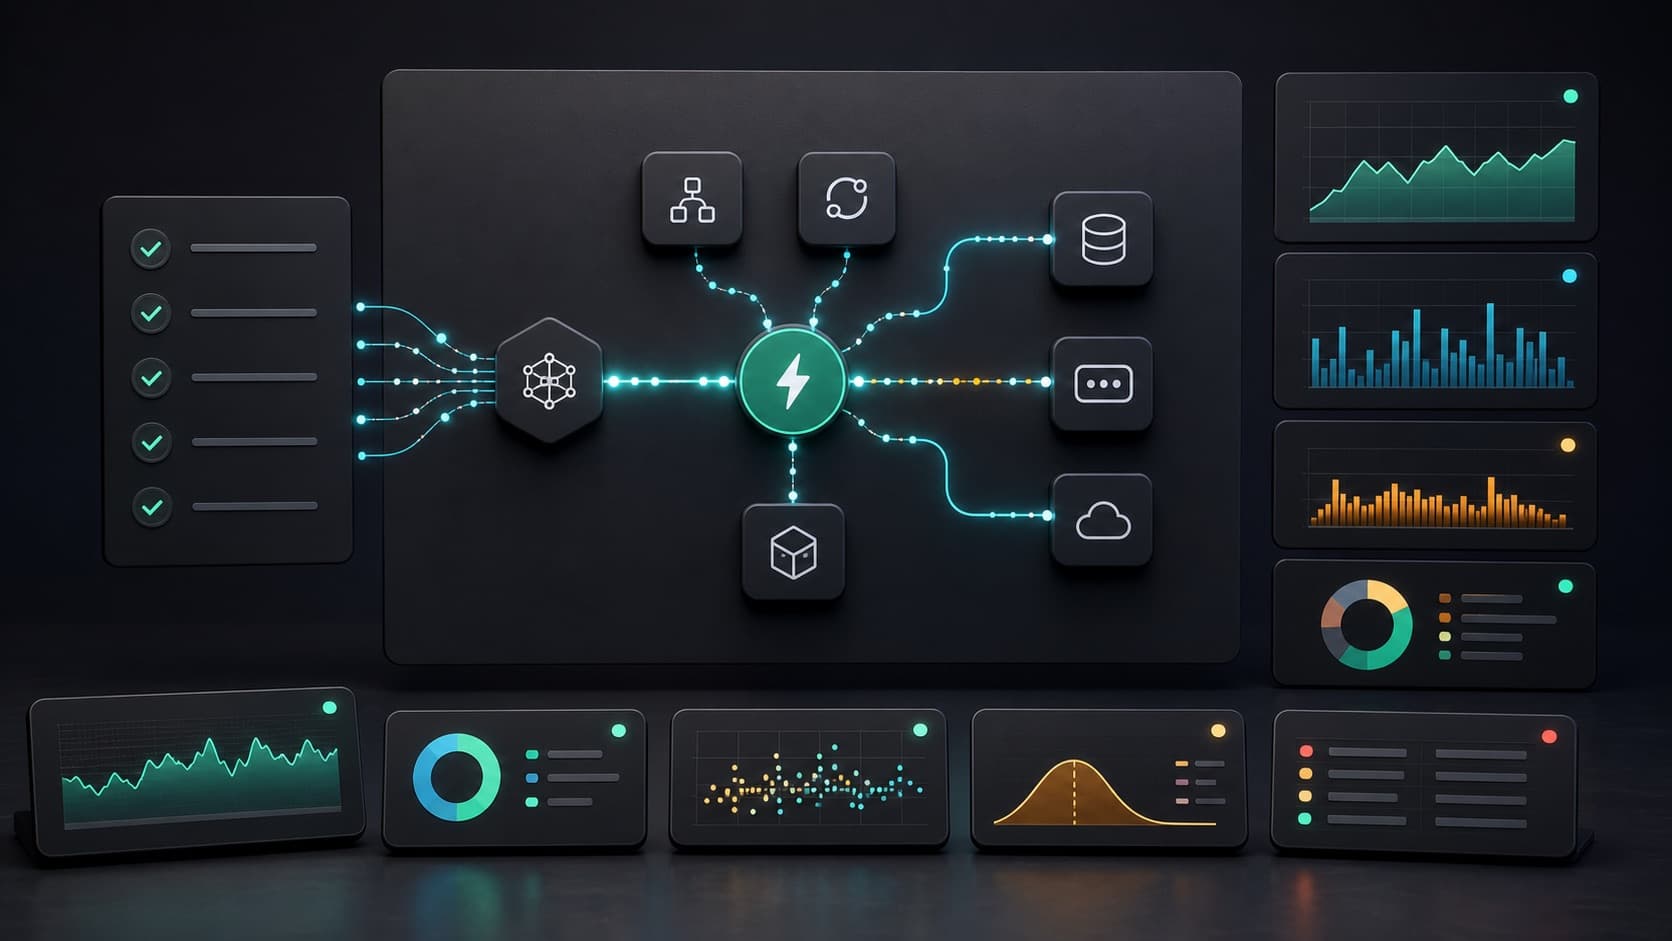
Use this production observability checklist for FastAPI applications to verify request metrics, traces, errors, background tasks, alerts, and releases.

Debug Gin framework apps in production with OpenTelemetry tracing, pprof profiling, GORM query optimization, and structured logging for Go services.

Debug Laravel in production beyond dd() and Log::info(). Use Telescope, dynamic logs, distributed tracing, and performance profiling.
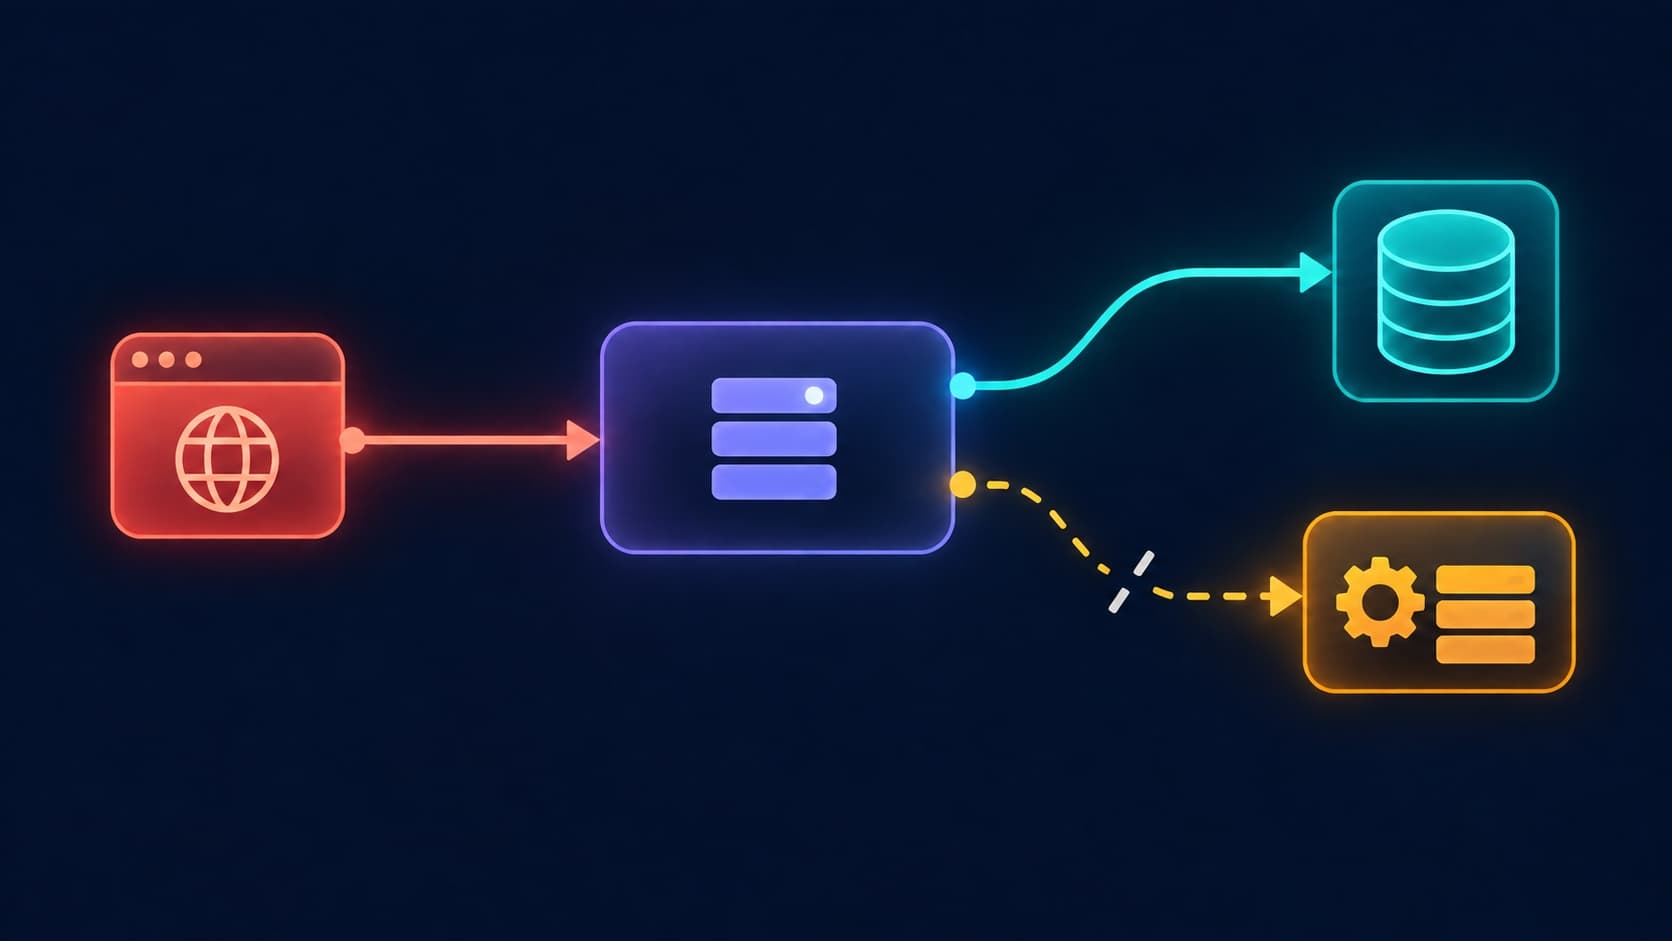
Set up OpenTelemetry PHP auto-instrumentation for Laravel, configure OTLP before autoload, and verify request, SQL, and queue trace boundaries.

Step-by-step guide to debugging production without redeploying. Set up dynamic logs for PHP, Node.js, Go, and Python in minutes.

Fix intermittent 500 errors systematically. Reproduce, investigate logs, trace requests, and capture application state to find the root cause.

Why production logs never have what you need and how to fix it. Replace reactive logging with dynamic logs and tracing to cut debug time by 80%.

Debug Spring Boot in production beyond logging. Use dynamic logs, distributed tracing, database monitoring, and AI alerts without redeploying.

Debug Django apps in production without DEBUG=True or redeploying. Use dynamic logs, flame graphs, and distributed tracing to fix issues in real time.

New Relic alternative for bootstrapped startups. Distributed tracing and dynamic logs starting at $29/month instead of $500+. 5-minute setup.
Your API threw a 500 at 3 AM. A systematic approach to diagnose, trace, and fix production API errors without the panic and guesswork.