
20 min
Complete Guide to Application Observability for Startups
Practical observability for startups: logs, metrics, traces with OpenTelemetry, cost-saving sampling, AI-driven detection, and CI/CD integration.
observabilitystartups
Engineering insights on observability, distributed tracing, and production debugging.
Practical observability for startups: logs, metrics, traces with OpenTelemetry, cost-saving sampling, AI-driven detection, and CI/CD integration.

Practical RCA steps for production: define clear problems, collect logs and traces, map events, prioritize fixes, and validate changes with monitoring.
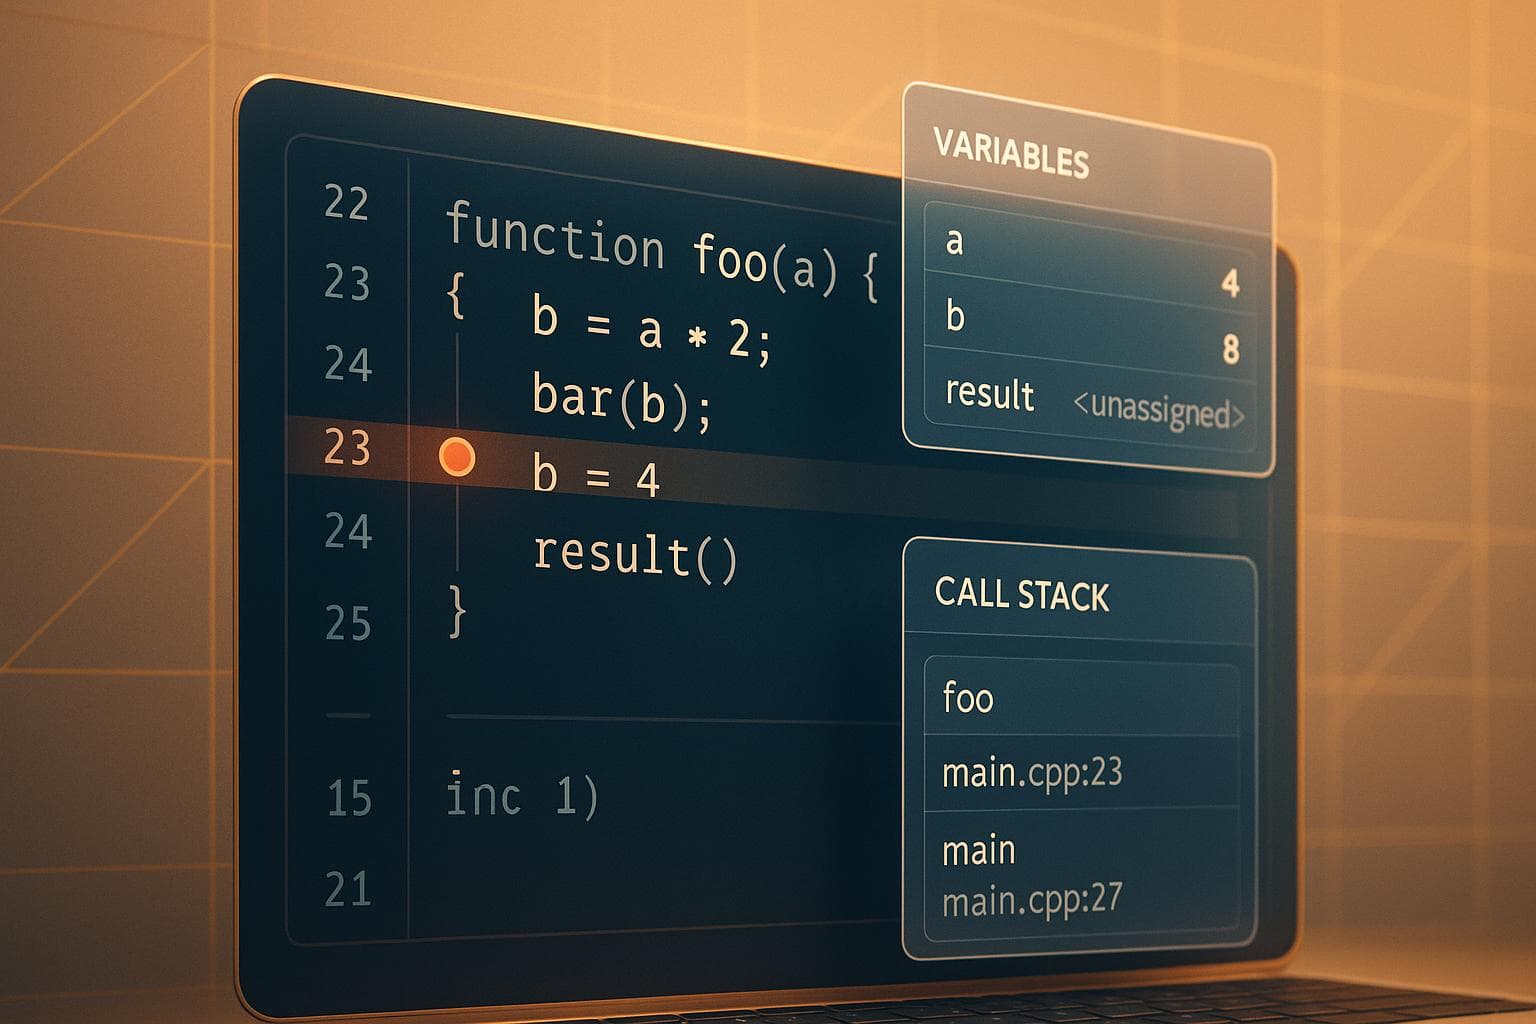
How live breakpoints work: debug production apps without pausing them. Capture variable snapshots, call stacks, and performance data in real time.
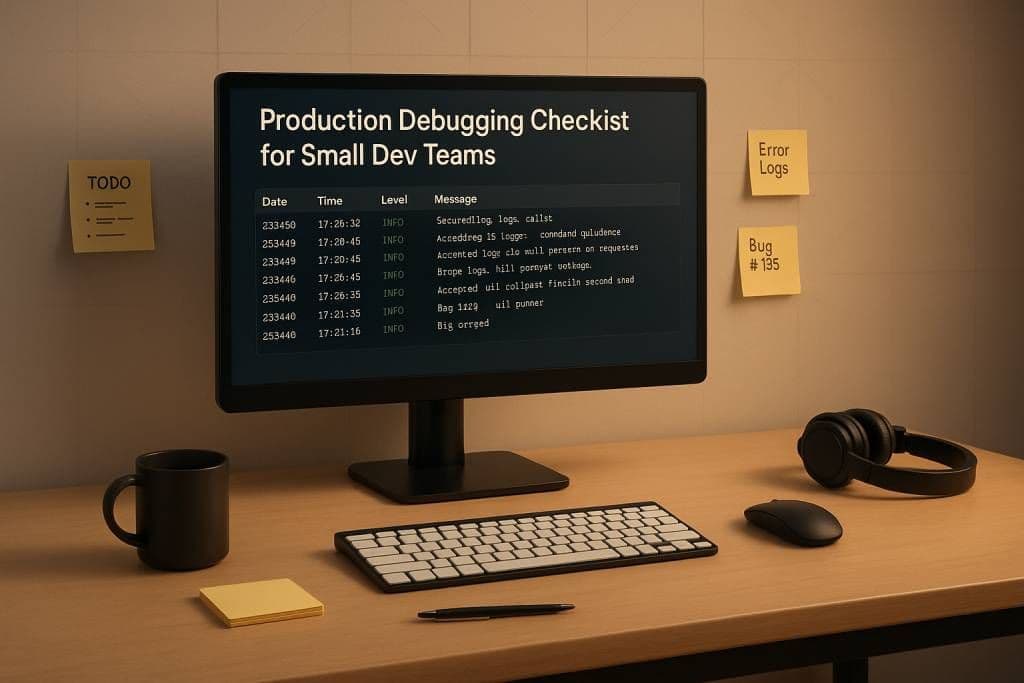
Production debugging checklist for small dev teams: structured logs, focused alerts, fast triage, tracing, fixes, and post-mortems to prevent repeat issues.
Explore the key differences between application monitoring and observability, and learn how they work together to enhance system reliability.

Explore five innovative ways to debug production applications in real-time without redeploying, ensuring smooth user experiences.
Go observability for production: OpenTelemetry setup for Gin, Echo, gRPC, and GORM. Distributed tracing, metrics, and monitoring for Go services.
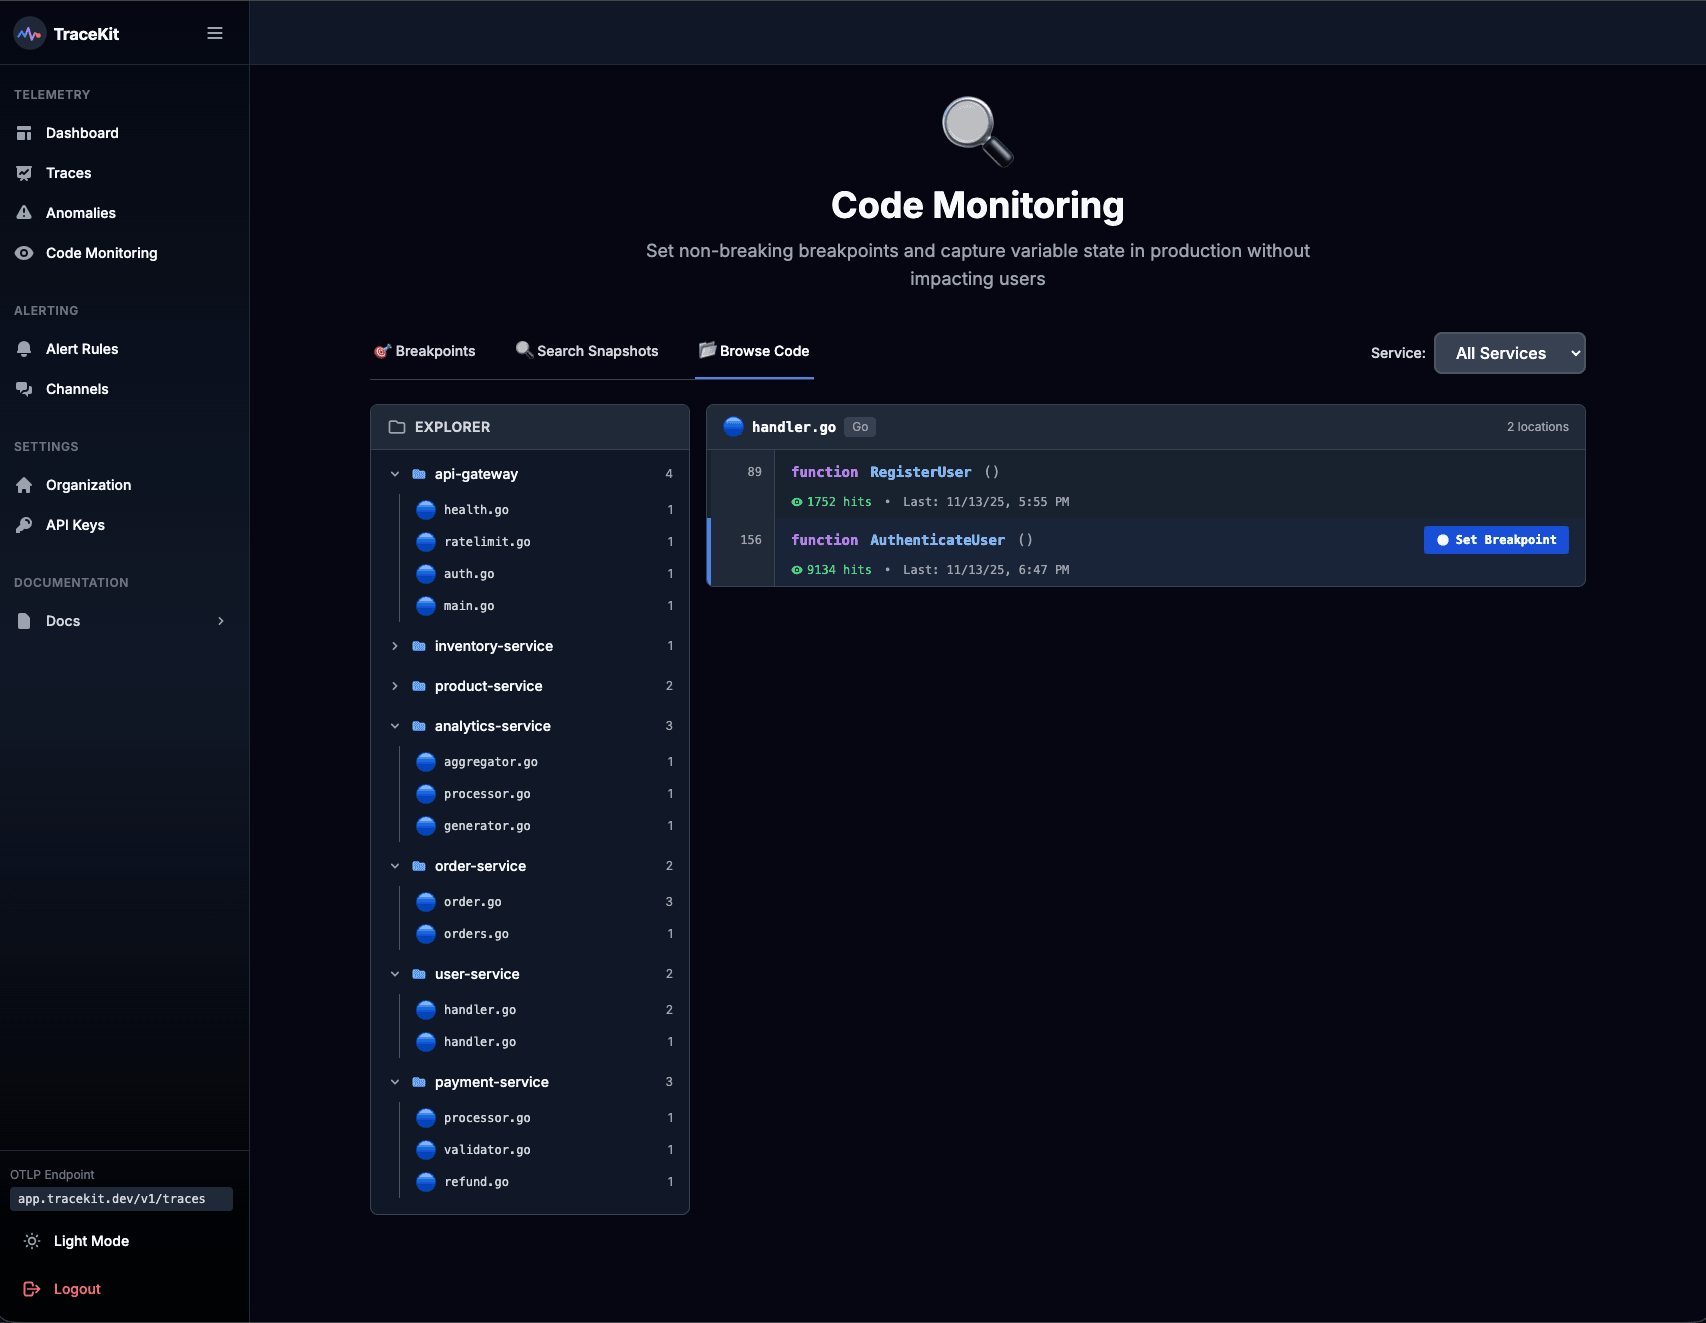
Debug production apps with dynamic logs and log points. Capture variable state without redeploying or stopping your application.
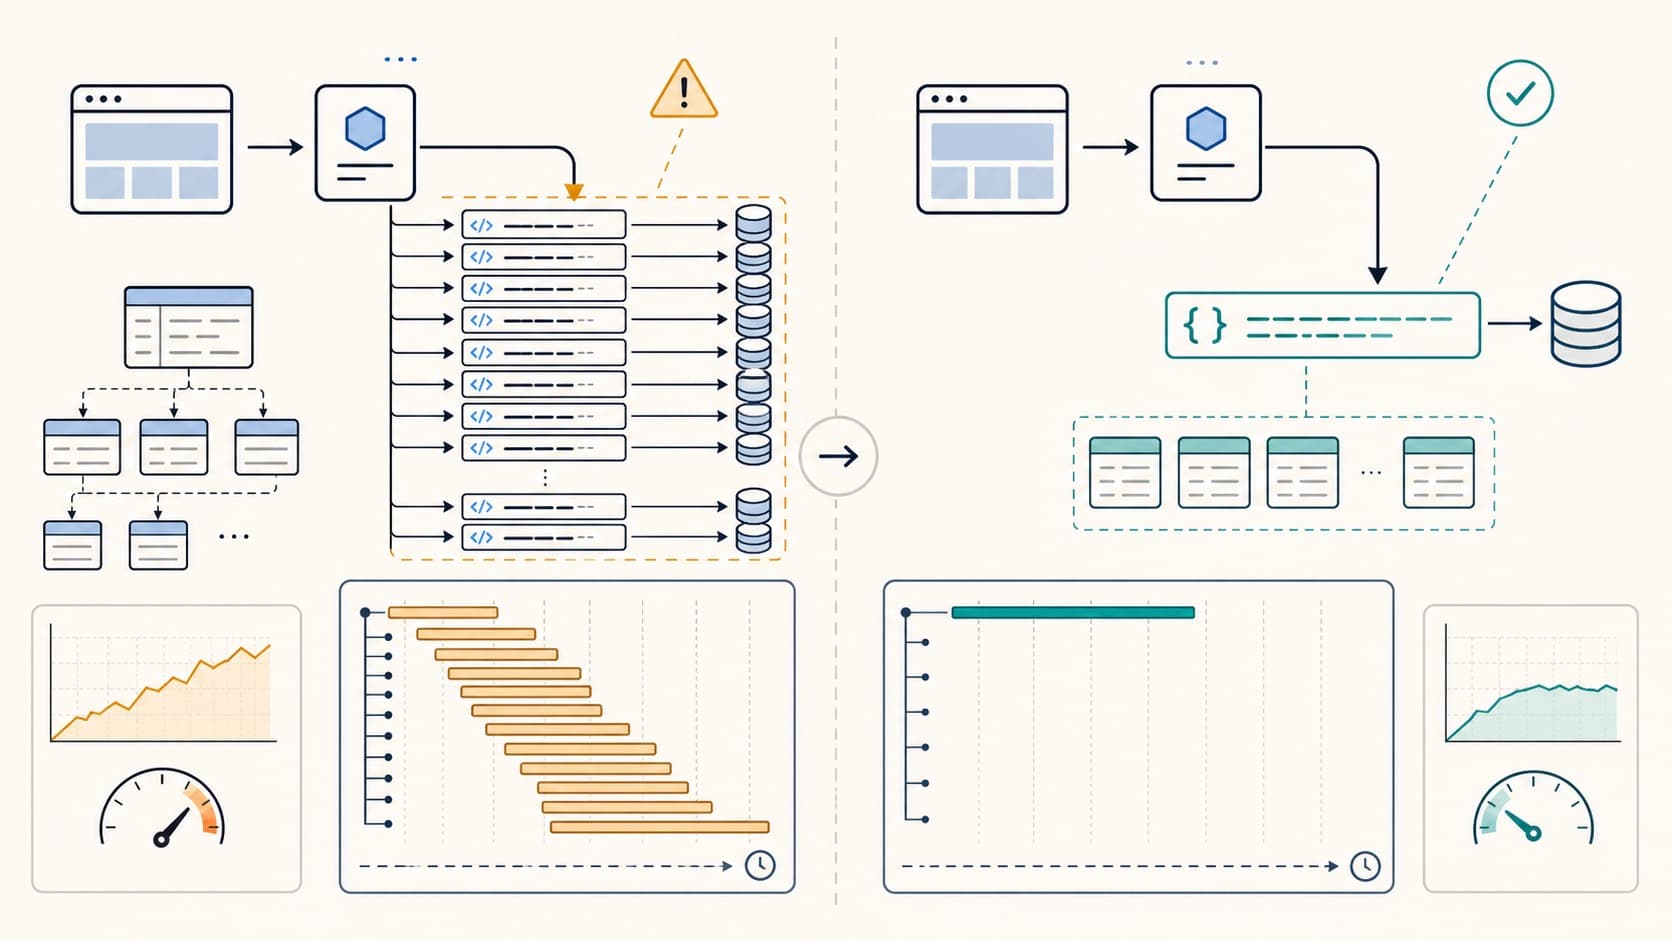
Detect N+1 queries with query counts and traces. Find repeated database calls, fix ORM loading, and verify the result in production.
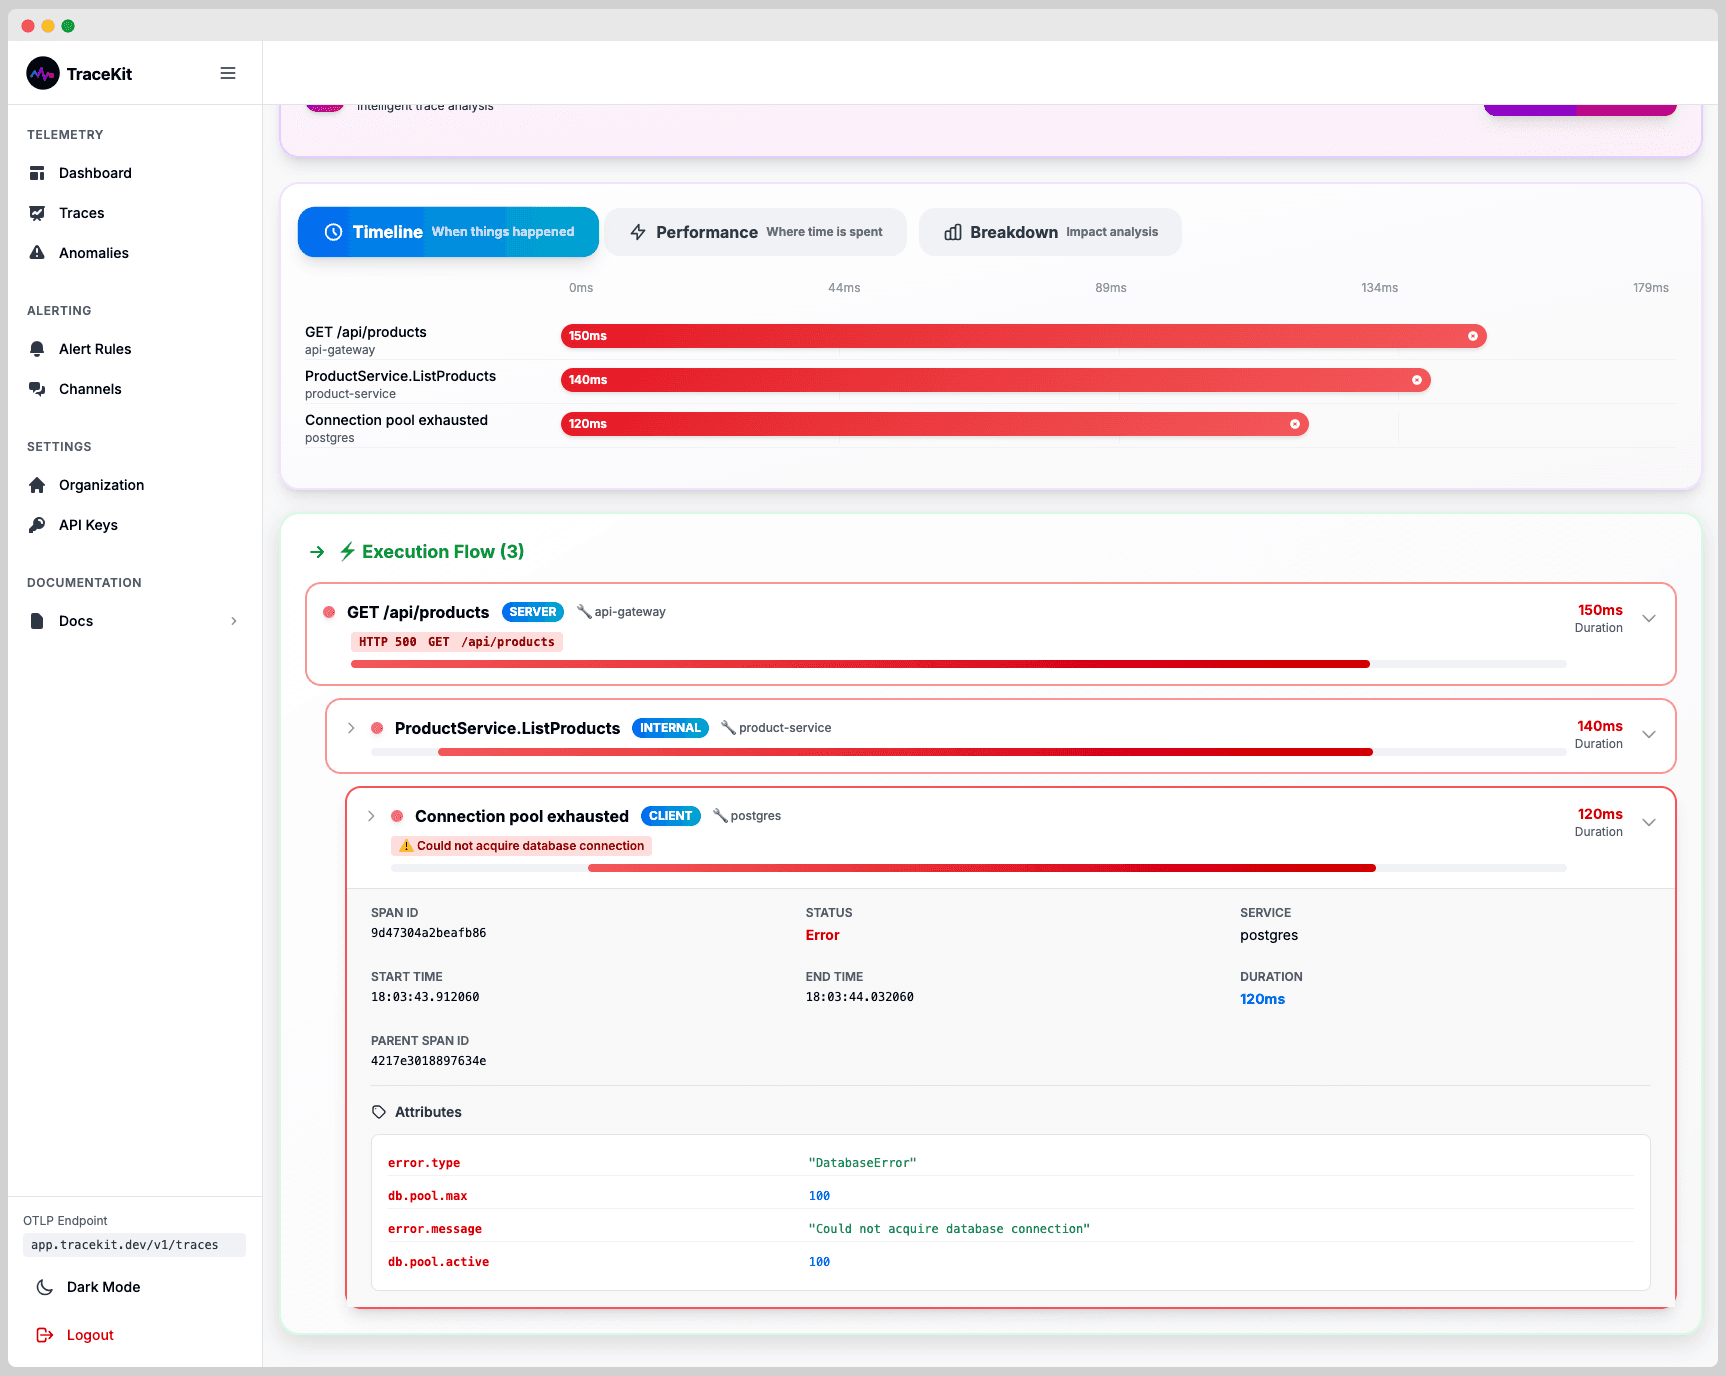
Complete OpenTelemetry setup guide. Install the SDK, configure exporters, and ship your first traces in under 5 minutes. Covers Node.js, Python, Go, and Java.
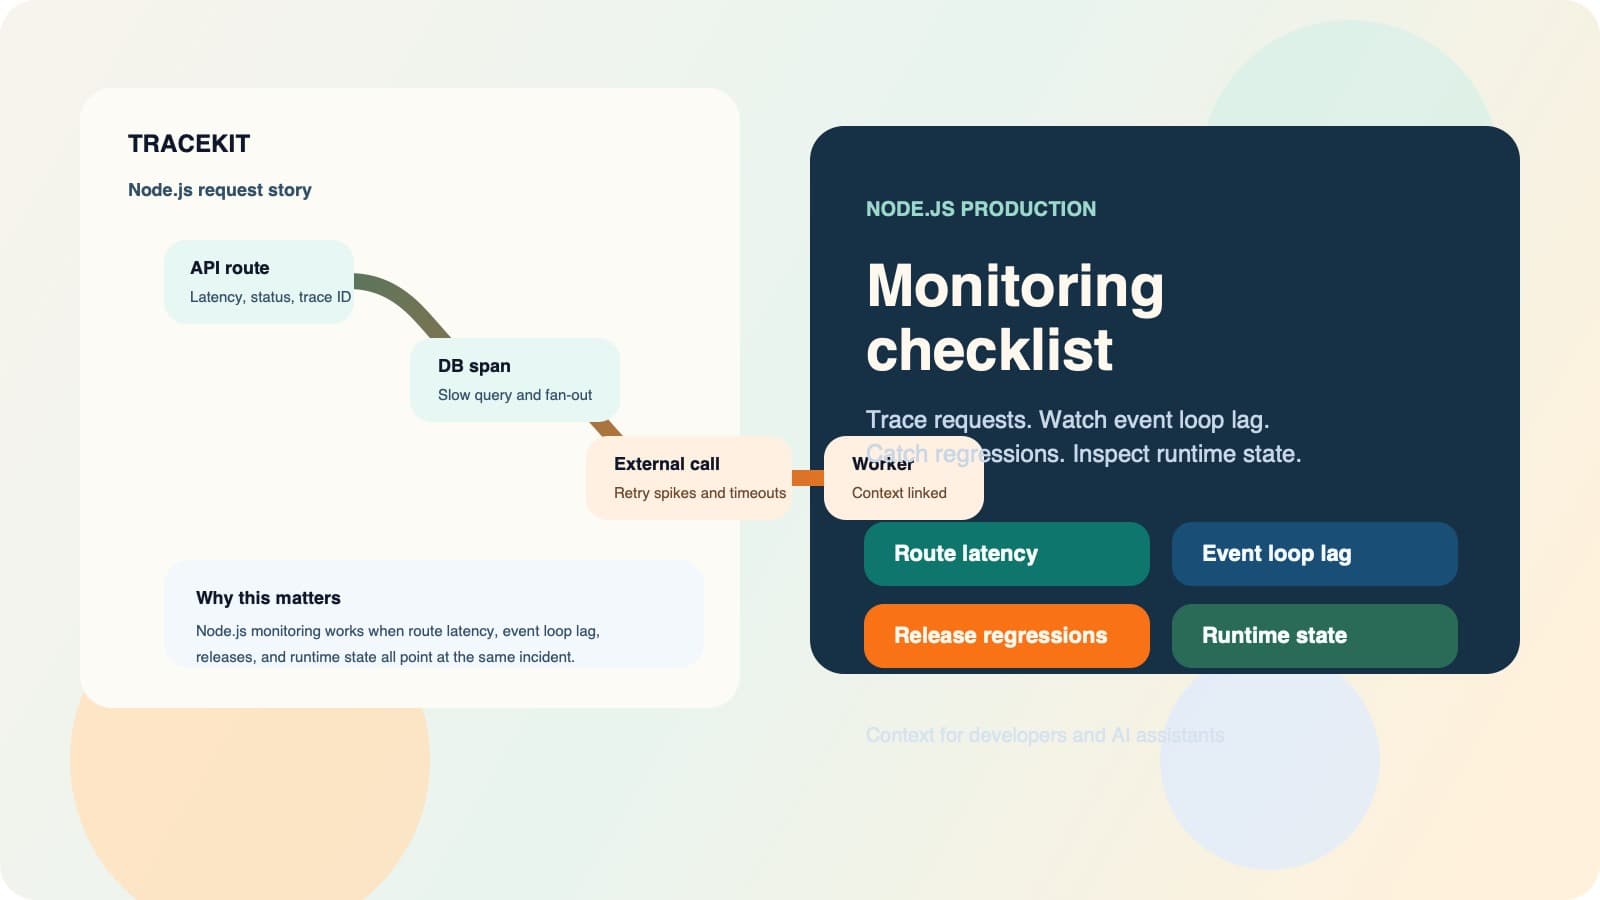
Use Node.js application performance monitoring to connect request traces, event loop health, dependencies, releases, and runtime state.
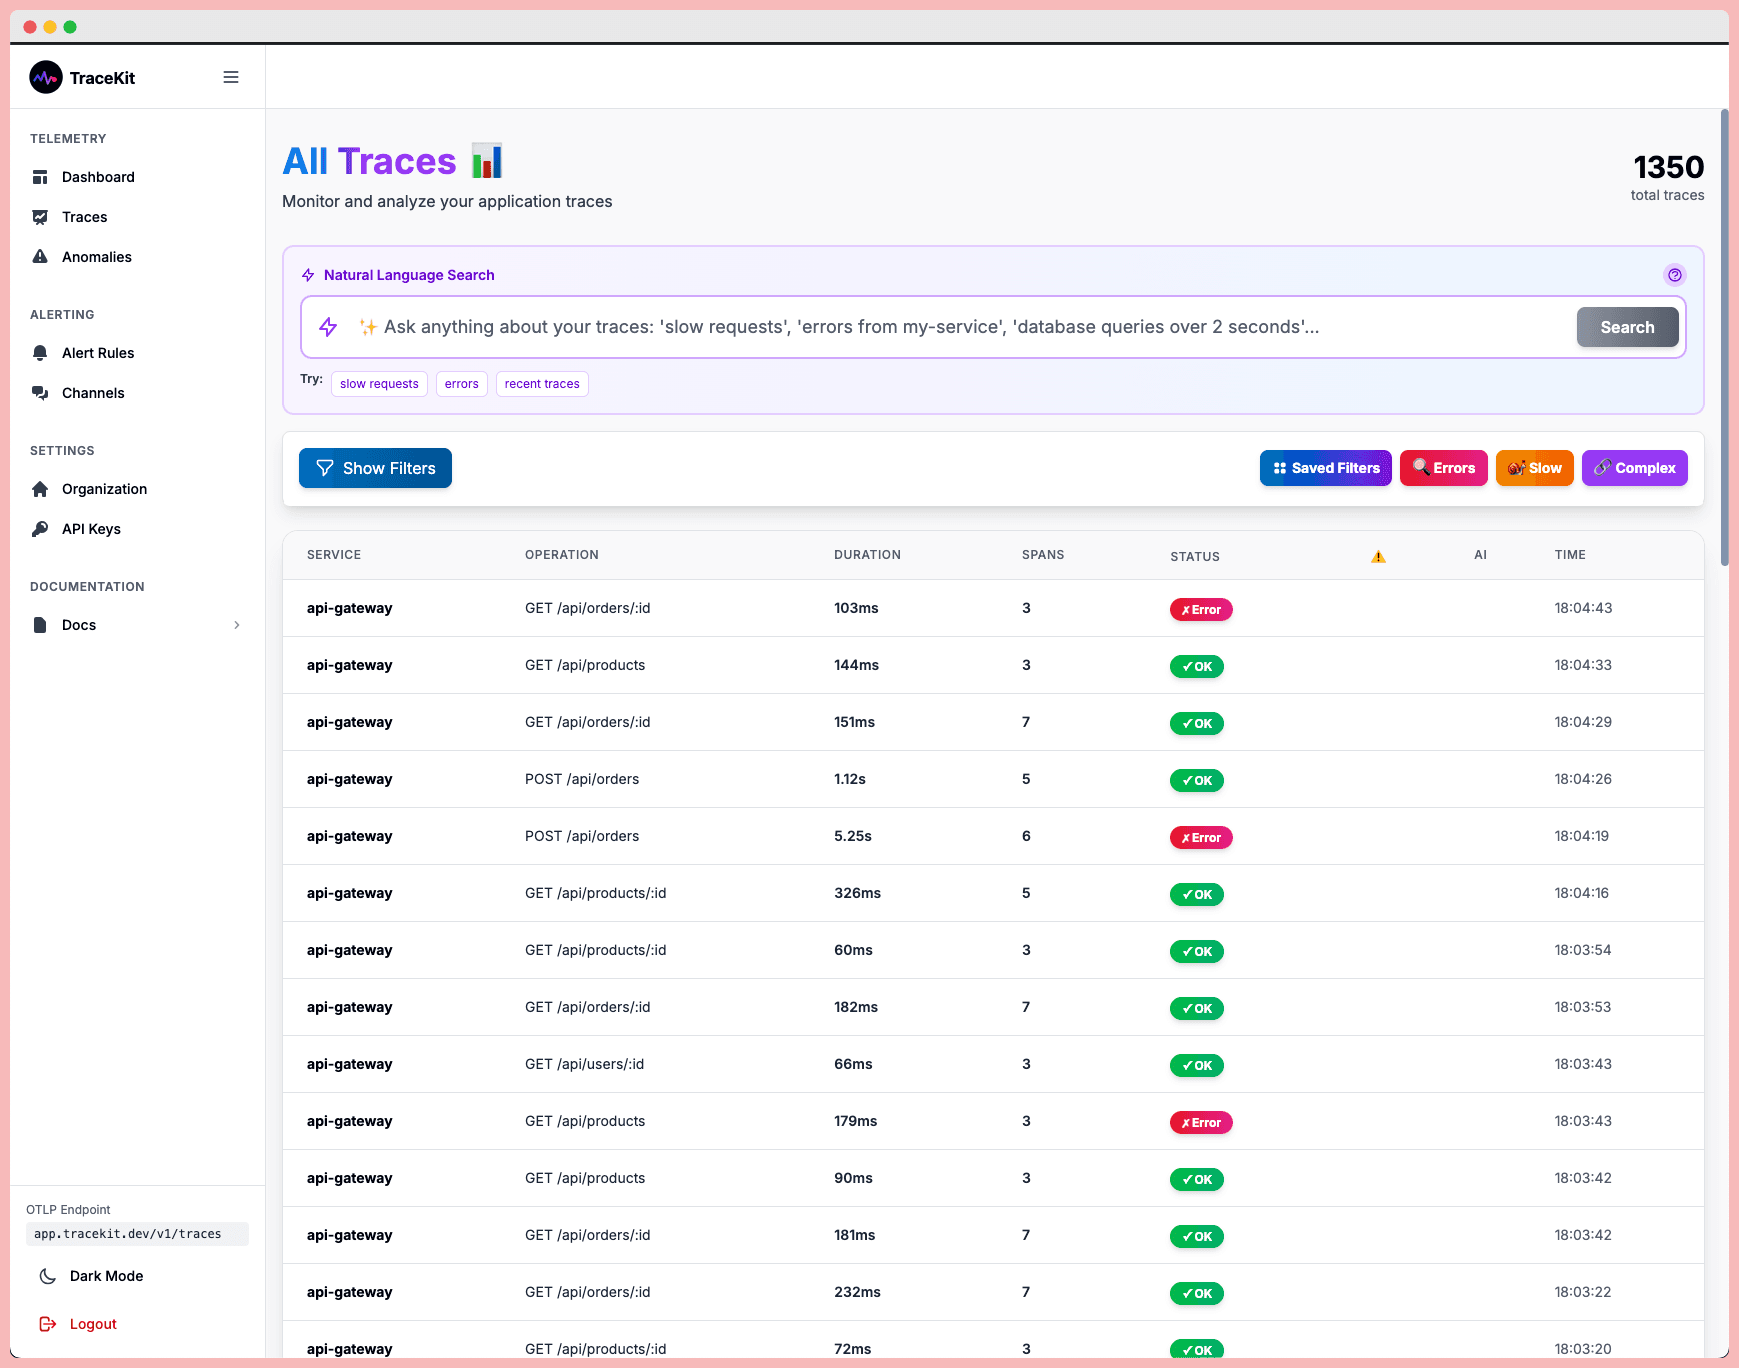
What is observability? Complete guide covering the three pillars (metrics, logs, traces), implementation strategies, and tools for modern software systems.