
Node.js monitorEventLoopDelay and eventLoopUtilization
Use Node.js monitorEventLoopDelay and eventLoopUtilization to measure event-loop lag, export useful metrics, and debug blocking production code.
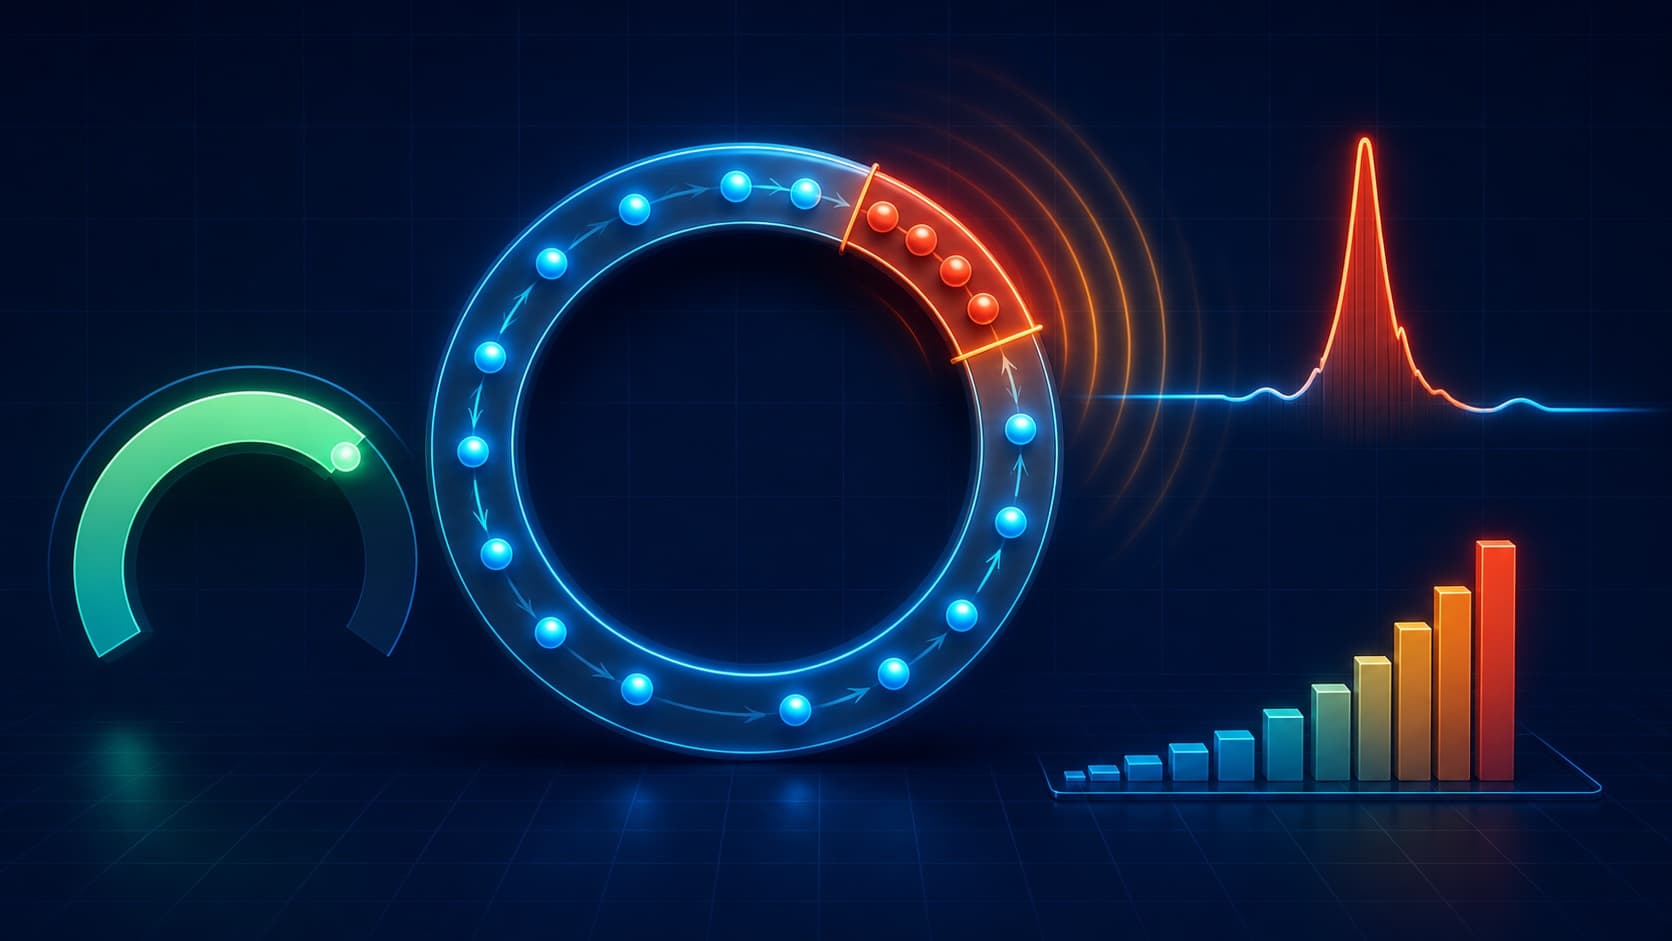
Node.js monitorEventLoopDelay and eventLoopUtilization answer different production questions. Delay measures how late the event loop runs scheduled work. Event-loop utilization, or ELU, measures how much time the loop stays active instead of waiting.
You need both signals. A latency chart can show a slow route, but it cannot prove that blocked JavaScript caused the delay. These two built-in node:perf_hooks APIs help separate event-loop pressure from slow databases, external APIs, and other dependencies.
This guide shows a correct measurement loop, explains the units, exports the results through Tracekit custom metrics, and connects a bad metric window to traces and runtime state.
monitorEventLoopDelay vs eventLoopUtilization
The APIs measure related behavior, but their outputs are not interchangeable.
| Signal | What it measures | Useful output | Best question |
|---|---|---|---|
monitorEventLoopDelay() | The delay between expected and actual event-loop execution | p50, p90, p99, maximum, mean | "How late did scheduled work run?" |
performance.eventLoopUtilization() | Active and idle event-loop time | A ratio from 0.0 to 1.0 | "How busy was the loop during this window?" |
The official Node.js docs state that monitorEventLoopDelay() reports nanoseconds. They also state that ELU is not CPU utilization. A synchronous child process can block the event loop and produce high ELU while the CPU remains mostly idle.
That distinction prevents a common mistake. High request latency does not always mean high CPU. The event loop can wait on blocking work, or the request can wait on a dependency while the loop remains healthy.
Measure both signals in one interval
Use windowed values. Cumulative process values become harder to compare after a service runs for several days.
import { monitorEventLoopDelay, performance } from 'node:perf_hooks'

const eventLoopDelay = monitorEventLoopDelay({ resolution: 20 })
eventLoopDelay.enable()

let previousElu = performance.eventLoopUtilization()

const timer = setInterval(() => {
  const currentElu = performance.eventLoopUtilization()
  const eluDelta = performance.eventLoopUtilization(currentElu, previousElu)
  previousElu = currentElu

  const sample = {
    delayP50Ms: Number(eventLoopDelay.percentile(50)) / 1e6,
    delayP99Ms: Number(eventLoopDelay.percentile(99)) / 1e6,
    delayMaxMs: Number(eventLoopDelay.max) / 1e6,
    utilization: eluDelta.utilization,
  }

  console.log(sample)
  eventLoopDelay.reset()
}, 60_000)

timer.unref()

async function shutdown() {
  clearInterval(timer)
  eventLoopDelay.disable()
}
This example makes four important choices:
- It converts delay values from nanoseconds to milliseconds.
- It calculates ELU for the latest interval, not the full process lifetime.
- It reads every delay value before calling
reset(). - It calls
unref()so the reporting interval does not keep the process alive.
The resolution value controls interval-based sampling frequency. A smaller value samples more often. Start with the Node.js default or a moderate value such as 20, then test overhead in your own service.
Do not compare results from different sampling modes as if they were identical. Current Node.js releases also provide a per-iteration mode, and the official docs state that its results differ significantly from interval-based sampling.
Use percentiles instead of one average
An average can hide the short stalls that users notice. Record at least p50, p99, and maximum delay for each interval.
Consider this window:
p50 delay: 1.8 ms
p99 delay: 84.2 ms
max delay: 312.7 ms
ELU: 0.76
The median looks healthy. The tail does not. A small group of callbacks waits much longer than normal, and the high ELU makes event-loop pressure a credible cause.
Do not copy a universal alert threshold from another application. A batch worker, WebSocket service, and checkout API have different latency budgets. Build a baseline by runtime, route mix, instance size, and normal traffic period.
A useful alert policy compares the current window with two things:
- the service's own normal p99 delay and ELU;
- user-facing route latency during the same window.
This pairing reduces false conclusions. A delay spike without route impact may not need a page. A route regression with healthy event-loop metrics points toward a database, network call, queue, or downstream service.
Export Node.js event-loop metrics to Tracekit
The current Tracekit Node SDK exposes custom counters, gauges, and histograms. It does not automatically collect monitorEventLoopDelay() or ELU values. Add the gauges explicitly when you need them.
The OpenTelemetry Node.js runtime metric conventions recommend these names:
nodejs.eventloop.delay.p50nodejs.eventloop.delay.p90nodejs.eventloop.delay.p99nodejs.eventloop.delay.maxnodejs.eventloop.utilization
The delay convention uses seconds. ELU uses a unitless ratio from 0.0 to 1.0. The following example keeps those units.
import { monitorEventLoopDelay, performance } from 'node:perf_hooks'
import * as tracekit from '@tracekit/node-apm'

const client = tracekit.init({
  apiKey: process.env.TRACEKIT_API_KEY!,
  serviceName: 'checkout-api',
  enableCodeMonitoring: true,
})

const delayP50 = client.gauge('nodejs.eventloop.delay.p50')
const delayP99 = client.gauge('nodejs.eventloop.delay.p99')
const delayMax = client.gauge('nodejs.eventloop.delay.max')
const utilization = client.gauge('nodejs.eventloop.utilization')

const delay = monitorEventLoopDelay({ resolution: 20 })
delay.enable()

let previousElu = performance.eventLoopUtilization()

const timer = setInterval(() => {
  const currentElu = performance.eventLoopUtilization()
  const eluDelta = performance.eventLoopUtilization(currentElu, previousElu)
  previousElu = currentElu

  delayP50.set(Number(delay.percentile(50)) / 1e9)
  delayP99.set(Number(delay.percentile(99)) / 1e9)
  delayMax.set(Number(delay.max) / 1e9)
  utilization.set(eluDelta.utilization)

  delay.reset()
}, 60_000)

timer.unref()

async function shutdown() {
  clearInterval(timer)
  delay.disable()
  await client.shutdown()
}

process.once('SIGTERM', () => void shutdown())
process.once('SIGINT', () => void shutdown())
Keep metric labels low-cardinality. Service, environment, and runtime version can be useful. Request IDs, user IDs, URLs, and stack traces do not belong in metric labels.
The OpenTelemetry conventions currently mark these Node.js runtime metrics as in development. Keep their names and units visible in code review so a future convention change is easy to manage.
Read delay and ELU together
Use both metrics to narrow the first investigation step.
| Delay | ELU | Likely next check |
|---|---|---|
| High | High | Synchronous code, CPU-heavy JavaScript, large serialization work, or a blocking native call |
| High | Normal | Short bursts, timer pressure, GC, a mismatched measurement window, or work outside the measured process |
| Low | High | Sustained callback work that still meets the current latency budget |
| Low | Low | Database, network, queue, lock, or downstream-service latency |
This table gives a starting hypothesis. It does not prove root cause.
For example, a large JSON.stringify() call can block JavaScript and raise both signals. A slow PostgreSQL span can raise request latency while delay and ELU stay normal. A synchronous child process can raise ELU even when CPU looks quiet.
Use the metrics to decide which evidence to inspect next. Do not stop at the metric.
Connect a bad metric window to a trace
Event-loop metrics describe a process. A distributed trace describes a request. You need both scopes during an incident.
Use this workflow:
- Mark the exact interval where p99 delay or ELU changed.
- Find routes with higher p95 or p99 latency in that interval.
- Open representative slow traces for those routes.
- Separate long dependency spans from long application gaps.
- Compare the affected service release with the previous healthy release.
- Inspect the suspicious code path or add a bounded capture point.
Tracekit's distributed tracing shows request and dependency spans. Its release-aware data helps you ask whether the change started after a deploy. The current Node.js integration guide documents incoming HTTP, outgoing HTTP, and supported database instrumentation.
A trace with a long database child span points toward query or connection work. A trace with unexplained application time and high event-loop delay points toward work inside the Node.js process.
Use dynamic logs after the trace narrows the path
A trace can identify the slow handler without showing which input or branch made it slow. That is where Tracekit dynamic logs help.
Add a bounded capture point to the suspicious branch:
await client.captureSnapshot('pricing-rules-input', {
  ruleCount: rules.length,
  itemCount: cart.items.length,
  customerTier,
  fallbackEnabled,
})
The current Code Monitoring docs describe capture points, conditions, sampling, maximum captures, and safety controls. Dynamic logs capture runtime state without another redeploy after the capture point exists. They are not generic log ingestion.
Use this sequence:
- event-loop metrics identify the bad process window;
- traces identify the affected route and code area;
- release data identifies what changed;
- dynamic logs capture the runtime state that explains the bad branch.
Keep sensitive data out of captures. Prefer counts, stable identifiers, Boolean decisions, and bounded values over full payloads.
Measure each process and worker separately
ELU belongs to one event loop. A cluster worker, worker thread, and separate Node.js process each have their own runtime behavior.
Do not report only the main process and assume it represents every worker. Add a stable worker or process label when you need per-worker metrics, but avoid labels that change on every restart.
Also check aggregation behavior. One blocked worker can disappear inside an average across twenty healthy workers. Per-instance maximums and high percentiles reveal that imbalance better than a fleet-wide mean.
Common implementation mistakes
Treating nanoseconds as milliseconds
monitorEventLoopDelay() returns nanoseconds. Divide by 1e6 for milliseconds or 1e9 for seconds.
Reporting cumulative ELU forever
A lifetime ratio hides recent changes. Calculate a delta from two cumulative readings for each reporting interval.
Resetting before reading
Read every percentile and maximum first. Then reset the delay histogram for the next interval.
Alerting on one metric alone
Pair event-loop metrics with route latency, error rate, traffic, and trace evidence. One noisy process sample should not create an incident without user impact.
Assuming Tracekit collects these values automatically
The current Node SDK supports custom gauges, but you must record these two perf_hooks signals yourself.
Using high-cardinality metric labels
Do not attach trace_id, request_id, user data, or raw route URLs to runtime metrics. Use traces for request-level detail.
Production checklist
- Enable
monitorEventLoopDelay()once per measured runtime. - Report p50, p99, and maximum delay in a documented unit.
- Calculate interval ELU with two cumulative readings.
- Reset the delay histogram after every reporting window.
- Keep the reporting timer from blocking shutdown.
- Measure each process or worker that handles production traffic.
- Compare event-loop signals with route latency and error rate.
- Connect the bad window to traces and release data.
- Use dynamic logs only after you narrow the suspicious path.
- Build thresholds from your own baseline and latency budget.
What to do next
Start with the smallest complete signal set: p99 delay, maximum delay, interval ELU, route p99 latency, and representative traces. That set can tell you whether the event loop is the likely bottleneck and which request path needs evidence.
For the wider production setup, use the Node.js performance monitoring checklist. Then add release tracking, alert rules, and dynamic logs where they shorten the investigation.
The goal is not another dashboard. The goal is a defensible path from slow request to blocked code, changed release, and verified runtime state.
Related Posts
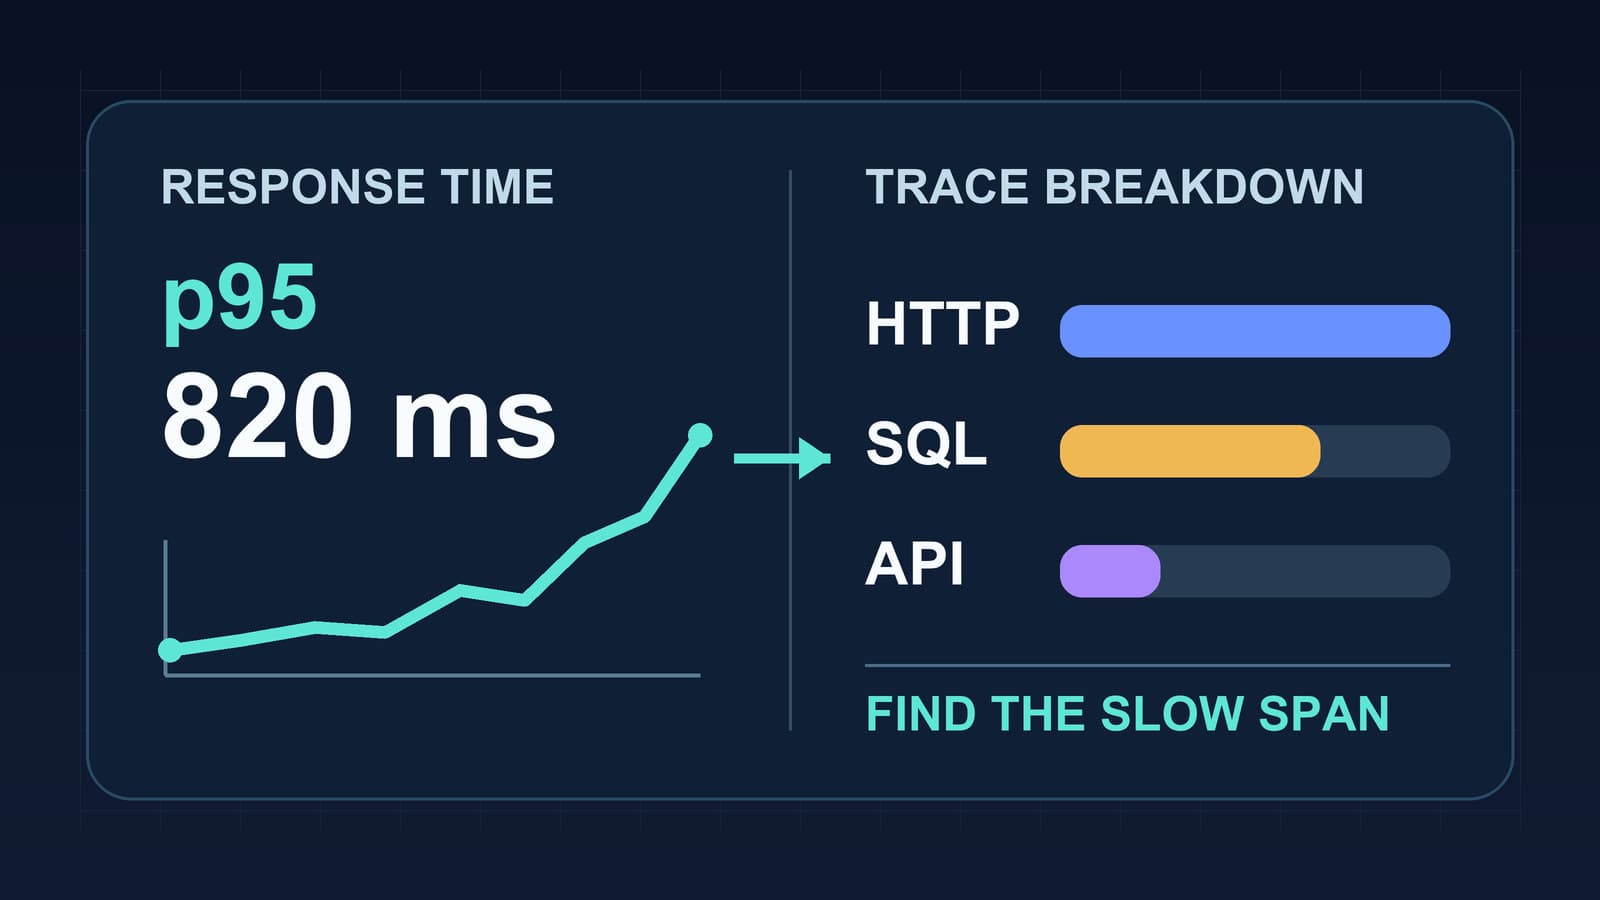
Node.js Response Time Monitoring by Route
Measure Node.js response time by route, read p95 latency with traces, and separate event loop delays from database and API waits.
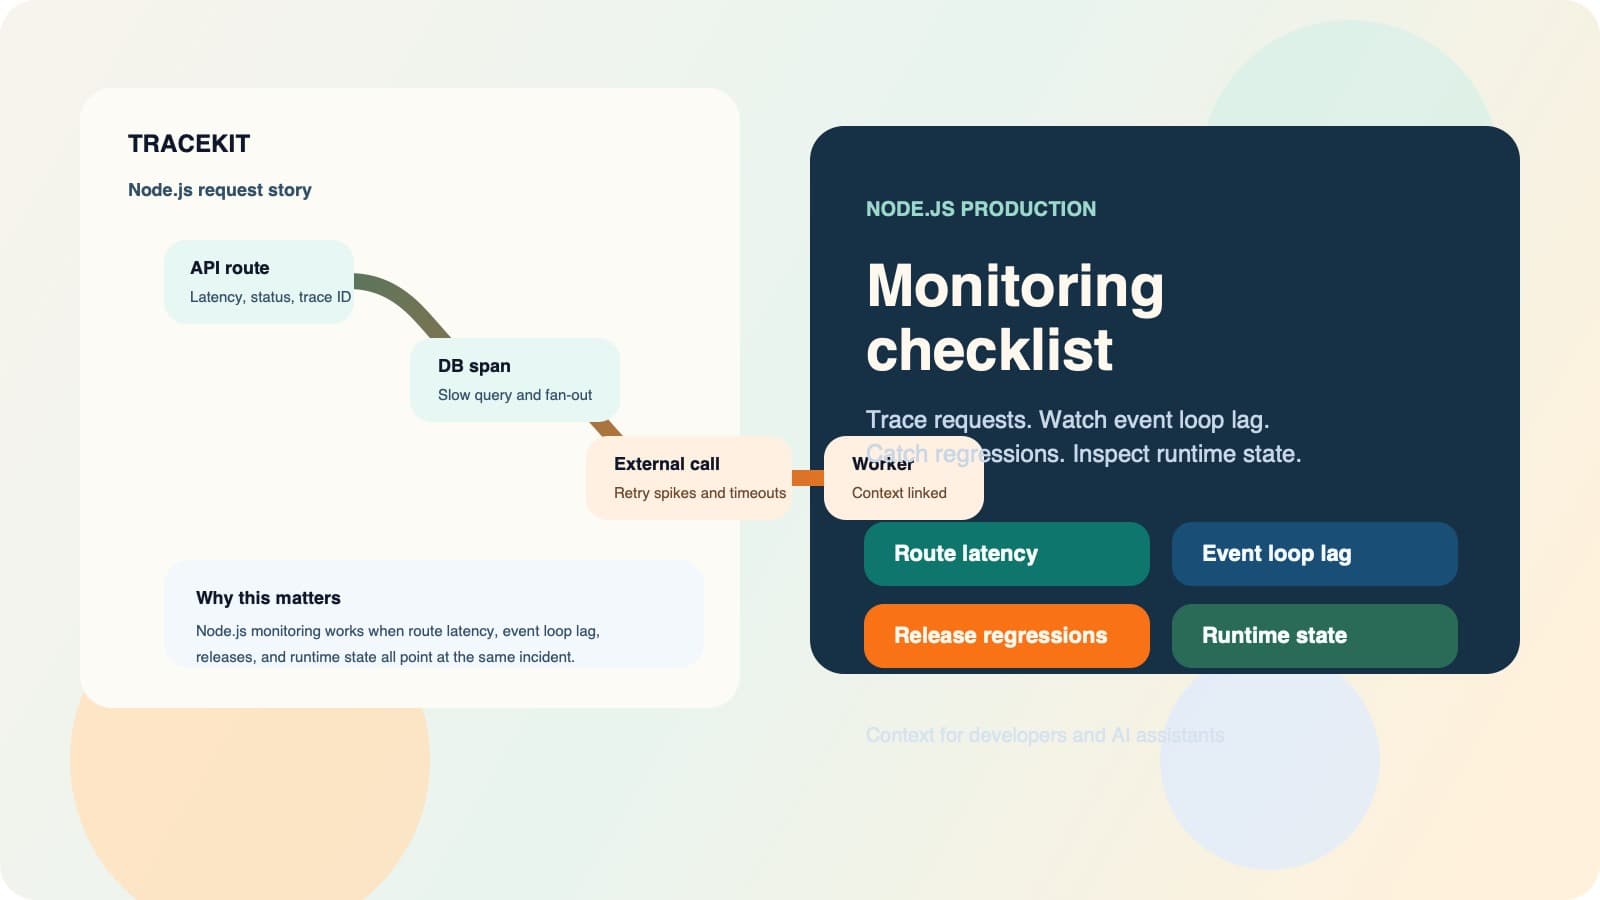
Node.js Application Performance Monitoring Guide
Use Node.js application performance monitoring to connect request traces, event loop health, dependencies, releases, and runtime state.
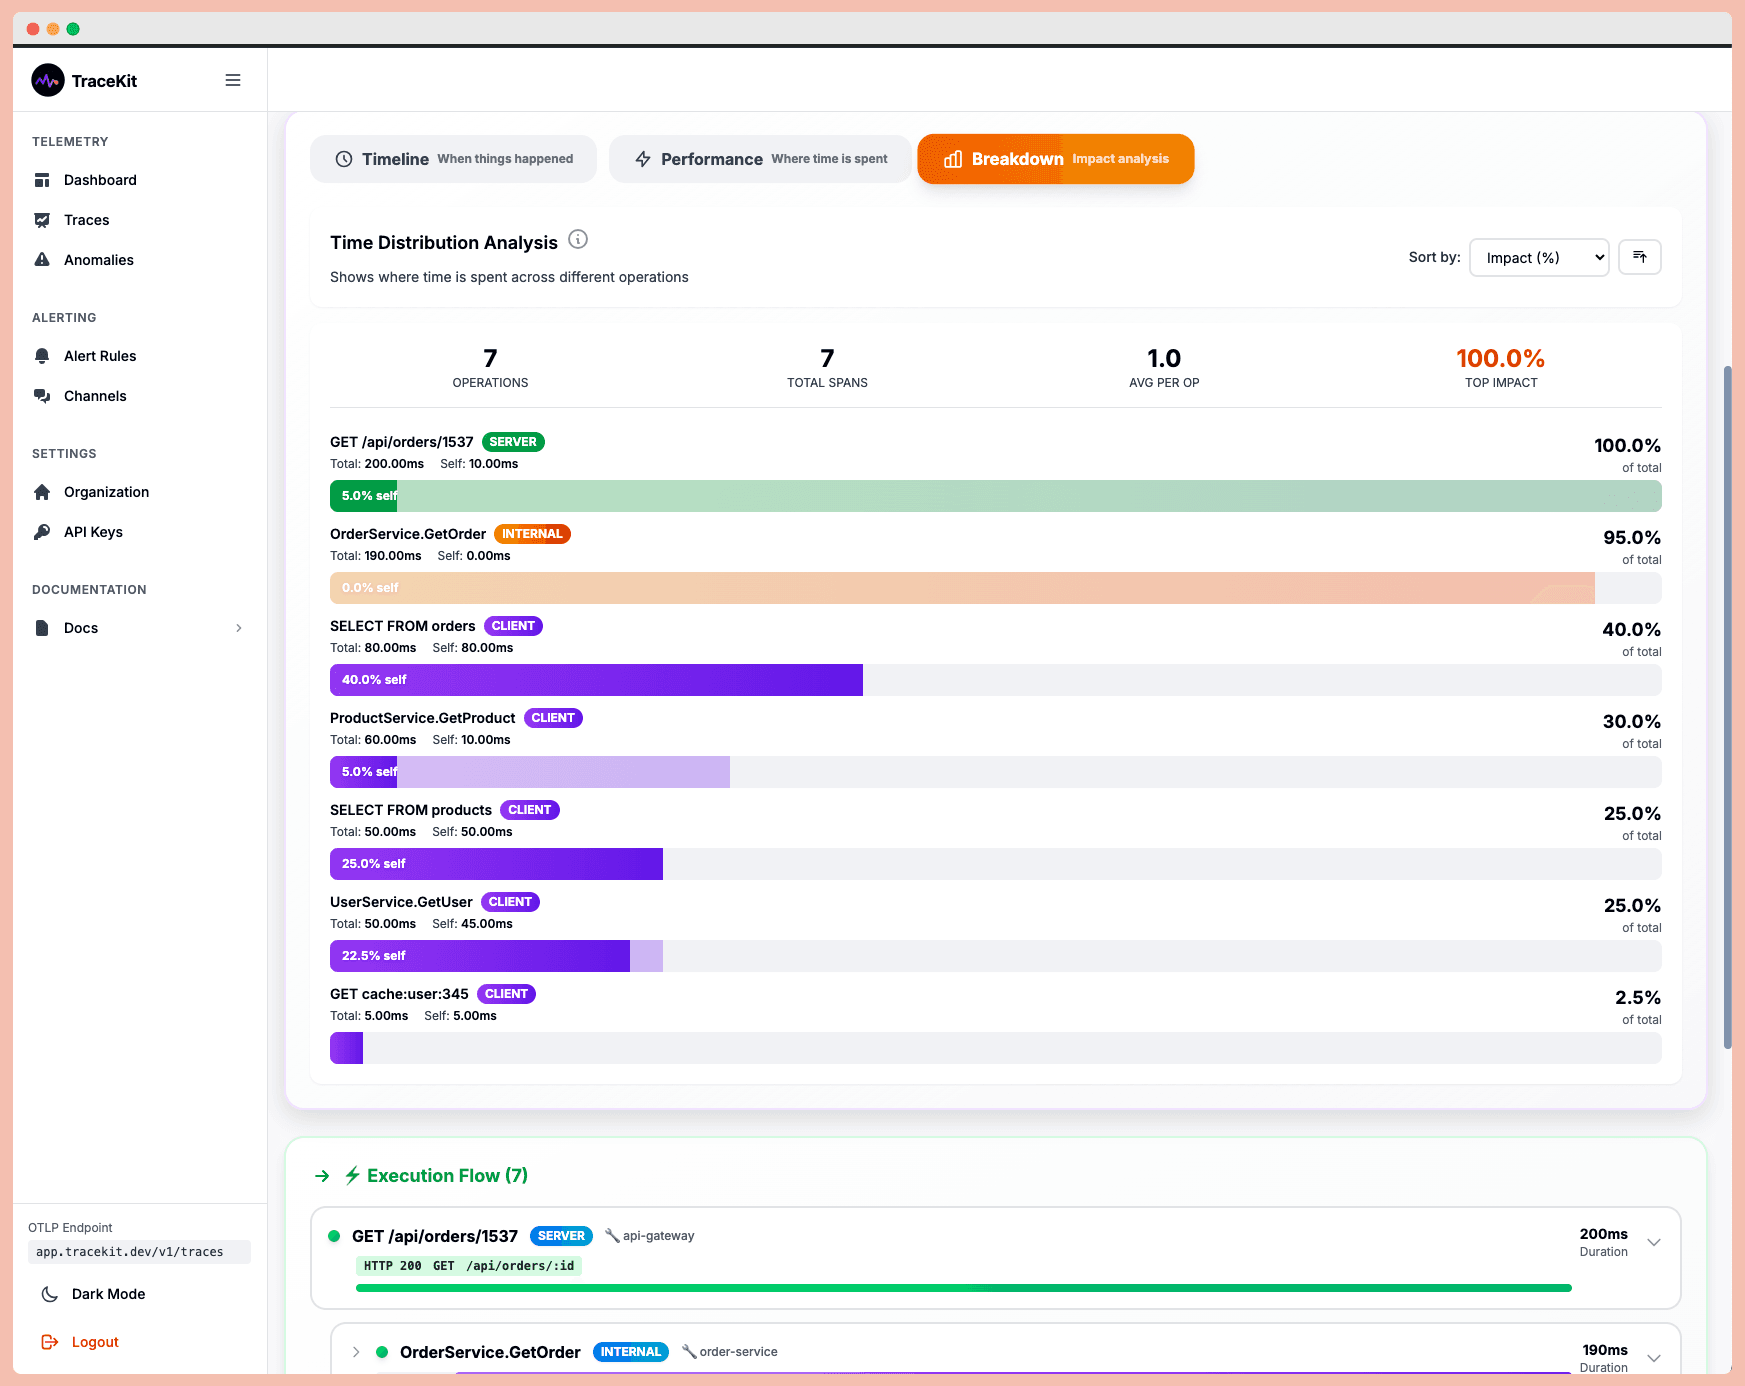
Debug Production Issues 10x Faster with Tracing
Debug production issues 10x faster with distributed tracing. Track requests across microservices, find bottlenecks, and resolve errors without log diving.