
FastAPI Background Tasks: Production Checklist
Use this FastAPI background tasks production checklist to catch silent failures, blocked workers, lost trace context, and release regressions.
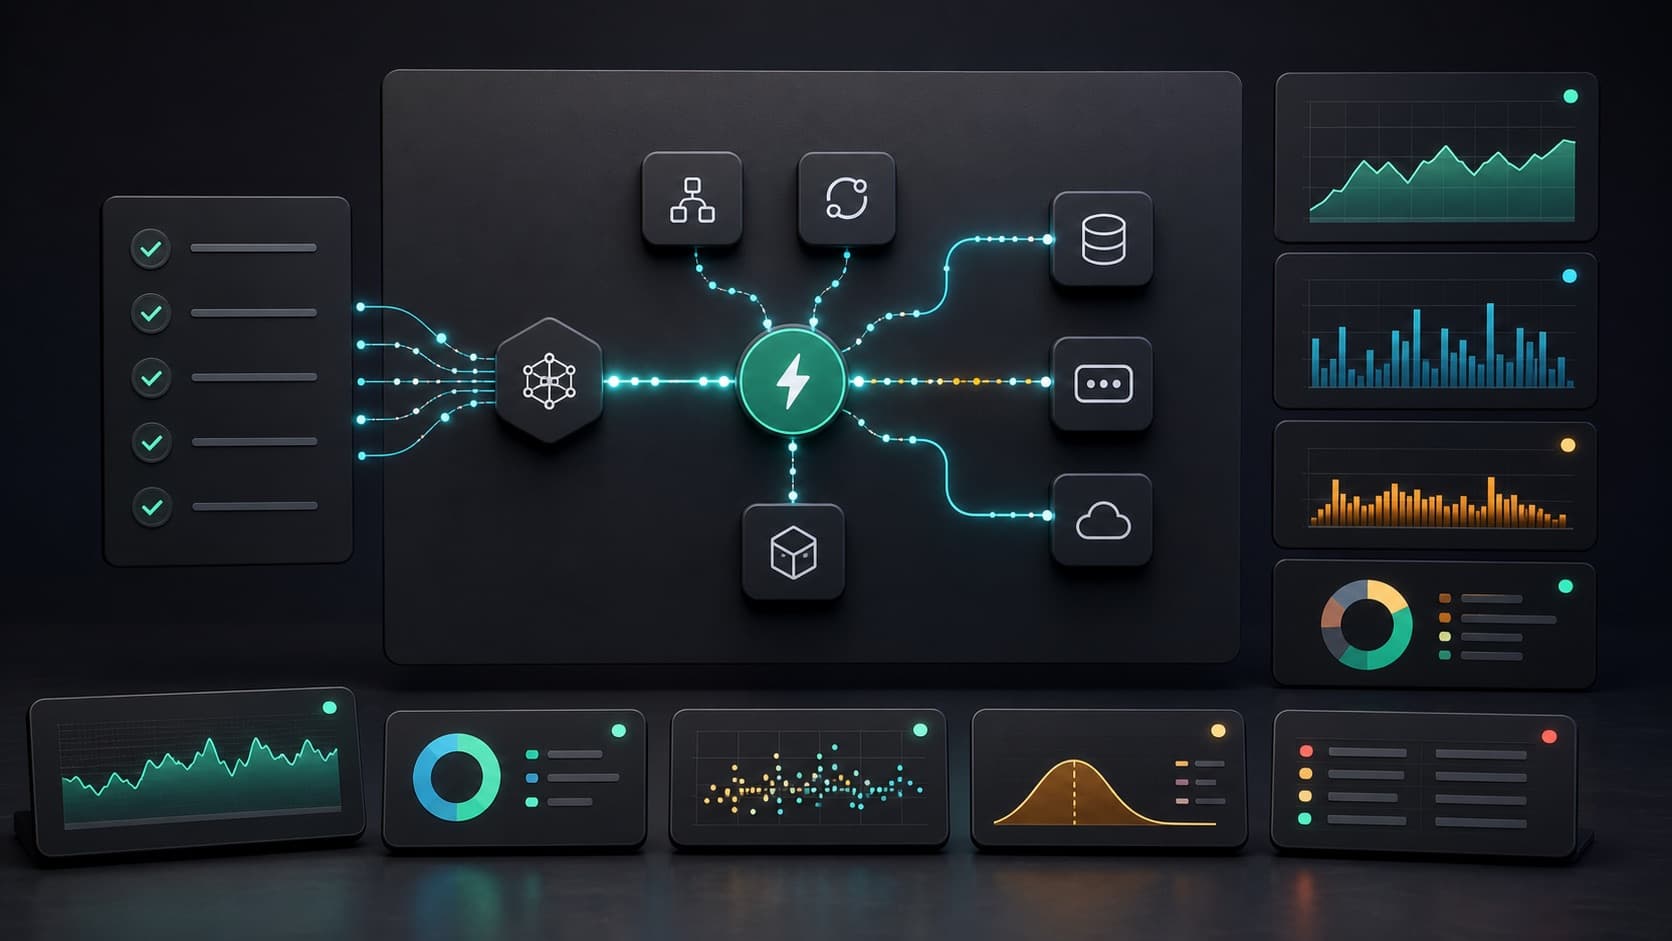
A production checklist for FastAPI background tasks must cover more than background_tasks.add_task(). The response can succeed while later work fails.
You need proof that each task started, finished, kept trace context, and survived the current traffic level. You also need a clear boundary between small in-process work and durable queued work.
Short answer: Use BackgroundTasks only when a restart may safely lose the work. Give each task its own resources and trace span. Measure accepted, started, completed, and failed work. Put critical work in a durable queue.
This guide gives you that checklist. It uses current FastAPI background task behavior, Starlette task execution rules, and OpenTelemetry Python context propagation.
FastAPI Background Tasks Production Checklist
| Check | Pass condition | Failure signal |
|---|---|---|
| Workload choice | Small, in-process work uses BackgroundTasks | Long or critical work disappears during restarts |
| Trace context | Each task has a named span linked to its request | Task spans appear as unrelated traces |
| Error capture | Exceptions set span status and reach monitoring | The API returns success while work fails silently |
| Concurrency | Sync task demand stays below measured thread capacity | Requests and tasks wait for the same thread pool |
| Data lifetime | Tasks open their own resources and receive stable identifiers | Closed request resources fail after the response |
| Delivery | Critical work uses a durable queue with retries | A process exit loses accepted work |
| Release safety | A release check proves task count, errors, and latency | A deploy changes task behavior without evidence |
| Runtime evidence | Capture points inspect unexpected state safely | Engineers add permanent logs and redeploy to investigate |
1. Choose In-Process Work or a Durable Queue
FastAPI runs BackgroundTasks after it sends the response. The work still runs inside the application process.
Use BackgroundTasks when all these conditions are true:
- The task is small and has a short, measured duration.
- The task does not need guaranteed delivery.
- A process restart can safely interrupt the task.
- The task does not need independent scaling.
- The task can share the application deployment lifecycle.
Use a durable queue when any condition is false. FastAPI recommends larger tools, such as Celery, for heavy work across processes or servers.
A payment capture, billing change, or order transition usually needs durable delivery. A small notification or best-effort audit action can fit in-process work.
Do not use a fixed duration limit from an unsourced checklist. Measure the task under production-like load and define your own limit.
What does a 202 response prove?
It proves that the request returned an accepted response. It does not prove that the background function started or completed. BackgroundTasks does not give the task a durable queue, retry policy, or independent worker. Keep a persistent operation record when users need a reliable completion status. Use a queue when losing an accepted operation would cause harm.
2. Instrument the Request and the Task Separately
Request tracing does not prove that post-response work completed. Give every background task its own span and stable name.
Start with the current Tracekit Python integration. For the request, SQLAlchemy, and HTTPX setup, use the FastAPI tracing guide.
import os

import tracekit
from fastapi import BackgroundTasks, FastAPI
from opentelemetry import context, trace
from opentelemetry.trace import Status, StatusCode
from tracekit.middleware.fastapi import init_fastapi_app

tracekit_client = tracekit.init(
    api_key=os.environ["TRACEKIT_API_KEY"],
    service_name="checkout-api",
    enable_code_monitoring=True,
)

app = FastAPI()
init_fastapi_app(app, tracekit_client)
tracer = trace.get_tracer("checkout.background_tasks")
The current Tracekit middleware creates a server span for each incoming request. It records HTTP details, status, duration, and extracted W3C trace context.
Do not assume the request span stays active during post-response work. Capture its context explicitly before scheduling the task.
3. Keep Trace Context Across the Background Boundary
Capture the current OpenTelemetry context before you schedule in-process work. Pass that context into the task explicitly.
def send_receipt(order_id: str, parent_context: context.Context) -> None:
    with tracer.start_as_current_span(
        "background.send_receipt",
        context=parent_context,
    ) as span:
        span.set_attribute("task.type", "send_receipt")
        span.set_attribute("order.id", order_id)

        try:
            receipt_service.send(order_id)
        except Exception as error:
            span.record_exception(error)
            span.set_status(Status(StatusCode.ERROR))
            raise


@app.post("/orders/{order_id}/receipt", status_code=202)
async def queue_receipt(
    order_id: str,
    background_tasks: BackgroundTasks,
) -> dict[str, str]:
    parent_context = context.get_current()
    background_tasks.add_task(send_receipt, order_id, parent_context)
    return {"status": "accepted", "order_id": order_id}
This example applies only to work inside the same process. A queue needs context injection into its message headers.
Use OpenTelemetry instrumentation when your queue client and worker support it. Otherwise, follow the official manual propagation guide.
Never put access tokens, passwords, or customer payloads into span attributes. Use stable identifiers and approved metadata.
4. Make Post-Response Failures Visible
A 202 response means that the endpoint accepted the request. It does not prove that the task completed.
Track these outcomes for each task type:
- accepted count
- started count
- completed count
- failed count
- duration
- retry count, when a queue provides retries
- queue delay, when work runs outside the application process
Starlette runs multiple background tasks in order. If one task raises an exception, later tasks do not run.
That rule makes task order part of your reliability design. Do not place an essential task after a best-effort task without an explicit failure policy.
Record the exception on the task span before you raise it. Then alert on task failures and missing completions.
The current Tracekit alert rules support error rate, latency, throughput, and service health conditions. Create rules from measured baselines.
5. Protect the Shared Thread Pool
Starlette runs synchronous background tasks in a thread pool. The same pool also supports synchronous endpoints, file handling, and FastAPI sync dependencies.
The current Starlette thread pool guide documents a default limit of 40 tokens. Treat this value as shared capacity.
Use def for blocking synchronous work. Use async def only when every slow operation uses a non-blocking library.
An async def task with blocking I/O can block the event loop. A burst of sync tasks can also exhaust the shared thread pool.
Measure these signals during load tests:
| Signal | What it can show |
|---|---|
| Task start delay | Work waits before execution begins |
| Task duration | External I/O or task logic slows down |
| Route p95 latency | Shared resource pressure affects users |
| Active task count | Concurrency grows beyond expected traffic |
| Thread wait time | Sync work competes for limited capacity |
Do not increase the thread limit without load testing. More threads can increase memory use and downstream pressure.
6. Separate Task Data From Request Data
Pass stable values into the task. Do not pass a request object or an open request-scoped database session.
A useful task input contains only what the task needs:
background_tasks.add_task(
    update_search_index,
    product_id,
    tenant_id,
    parent_context,
)
Open and close the task's database session inside the task. Re-read mutable records when current state matters. FastAPI's dependency guidance recommends a new task-owned session and stable record IDs.
Make side effects idempotent where practical. A stable operation identifier can prevent duplicate emails, writes, or webhook calls.
For durable queues, store the operation state outside the FastAPI process. The worker must not depend on memory from the request process.
7. Add Runtime Evidence Without Permanent Log Noise
Traces show where the task spent time. They do not always show which value caused the failure.
Tracekit dynamic logs use bounded capture points to collect runtime state without another deploy. They are not generic log ingestion.
The current Python SDK exposes an internal method name that still uses snapshot:
tracekit_client.capture_snapshot(
    "receipt-delivery-state",
    {
        "order_id": order_id,
        "provider": provider_name,
        "attempt": attempt_number,
        "template": template_name,
    },
)
Use an allowlist of safe values. Never capture secrets, payment data, or full customer payloads.
The capture includes trace context when an active span exists. That link connects the task timeline with the missing runtime state.
See the dynamic logs guide for capture limits, conditions, and the service kill switch.
8. Rehearse Four Failure Modes
A successful local request is not enough. Run these checks in a staging environment that uses your production worker settings:
| Drill | Action | Evidence to keep |
|---|---|---|
| Task exception | Make one task raise a controlled error | The task span shows the error, and failed count increases |
| Worker restart | Restart a worker while a task runs | The team can identify lost work, or the durable queue retries it |
| Task burst | Schedule more sync tasks than the normal peak | Task start delay and route p95 stay within measured limits |
| Resource expiry | Close request-scoped resources before task execution | The task opens its own database session and still completes |
Use a unique operation ID in the request, task span, and outcome record. Compare accepted IDs with completed and failed IDs. Any unmatched ID needs investigation. Tracekit can show the task span and related runtime state where instrumented, but your application must define the operation record and retry policy.
9. Run a Release Check Before Production
Test one successful task, one failed task, and one task burst before each important release.
Use this release checklist:
- The endpoint returns its intended status without waiting for task completion.
- An accepted operation has a completion record or a documented best-effort policy.
- The task starts after the response.
- The task span links to the initiating request.
- A task exception records an error span.
- Later ordered tasks follow the intended failure policy.
- Sync task bursts do not raise route p95 latency beyond your limit.
- Task resources open and close outside the request lifecycle.
- Critical work uses a durable queue and a retry policy.
- Alerts detect task failures, latency, and missing throughput.
- Release metadata identifies the first affected deployment.
- Capture points exclude sensitive values.
- Failure drills cover task exceptions, worker restarts, task bursts, and resource expiry.
Tracekit release tracking can connect errors and health changes with service.version. Use explicit release data in your deployment pipeline.
For alert design, use the trace-based alert setup guide. It explains evidence, sampling, and recovery checks.
Where Tracekit Fits
Tracekit connects standard OTLP traces with alerts, releases, and dynamic logs. It does not replace your durable queue or normal application logger.
Use these parts together:
| Need | Tracekit starting point |
|---|---|
| FastAPI request tracing | Python integration |
| Standard OTLP setup | OTel config generator |
| Runtime state inside a failing task | Dynamic logs |
| Error, latency, and throughput rules | Alert rules |
| Deploy and regression context | Release tracking |
The production goal is simple. Every accepted task must produce clear evidence of completion, failure, delay, or durable ownership.
Start with the task that users notice most. Trace its full lifecycle before you add more background work.
Related Posts
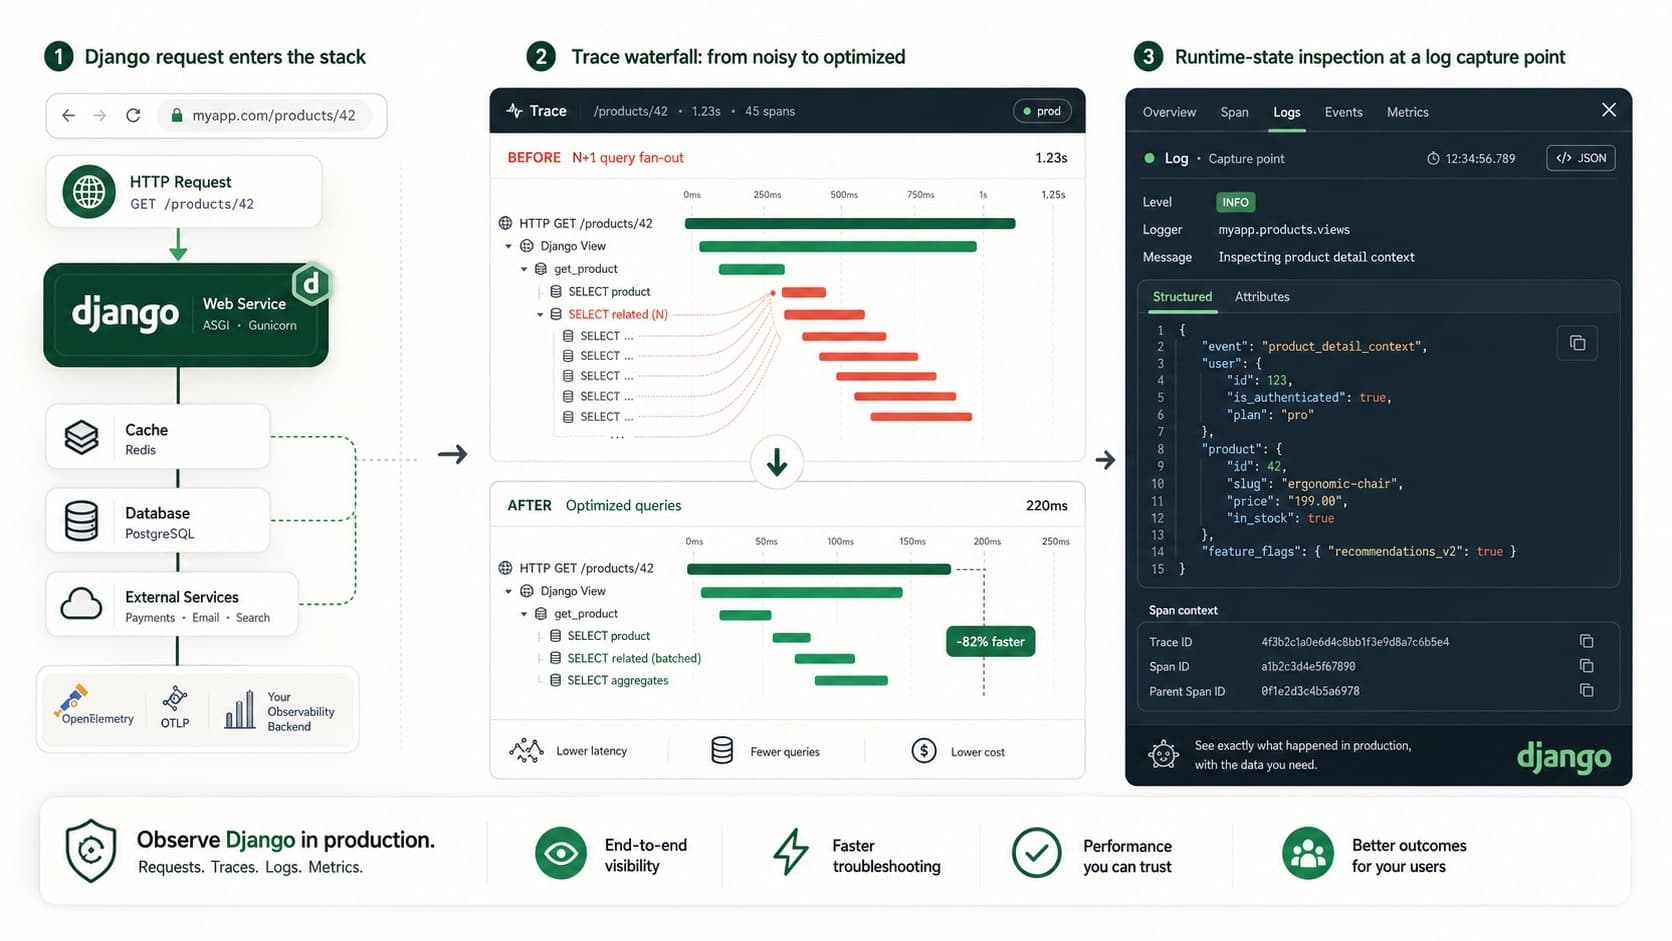
Django Observability Checklist for Production
Build Django observability with traces, query visibility, alerts, and dynamic logs so you can debug production issues without guessing.
FastAPI Monitoring with OpenTelemetry in Production
Monitor FastAPI routes with request metrics and OpenTelemetry traces. Check latency, errors, and downstream work before setting alerts.
FastAPI Tracing with OpenTelemetry: A Practical Setup
Set up FastAPI tracing with OpenTelemetry. Connect request, SQLAlchemy, and HTTPX spans, then verify trace context across services.