
4 min
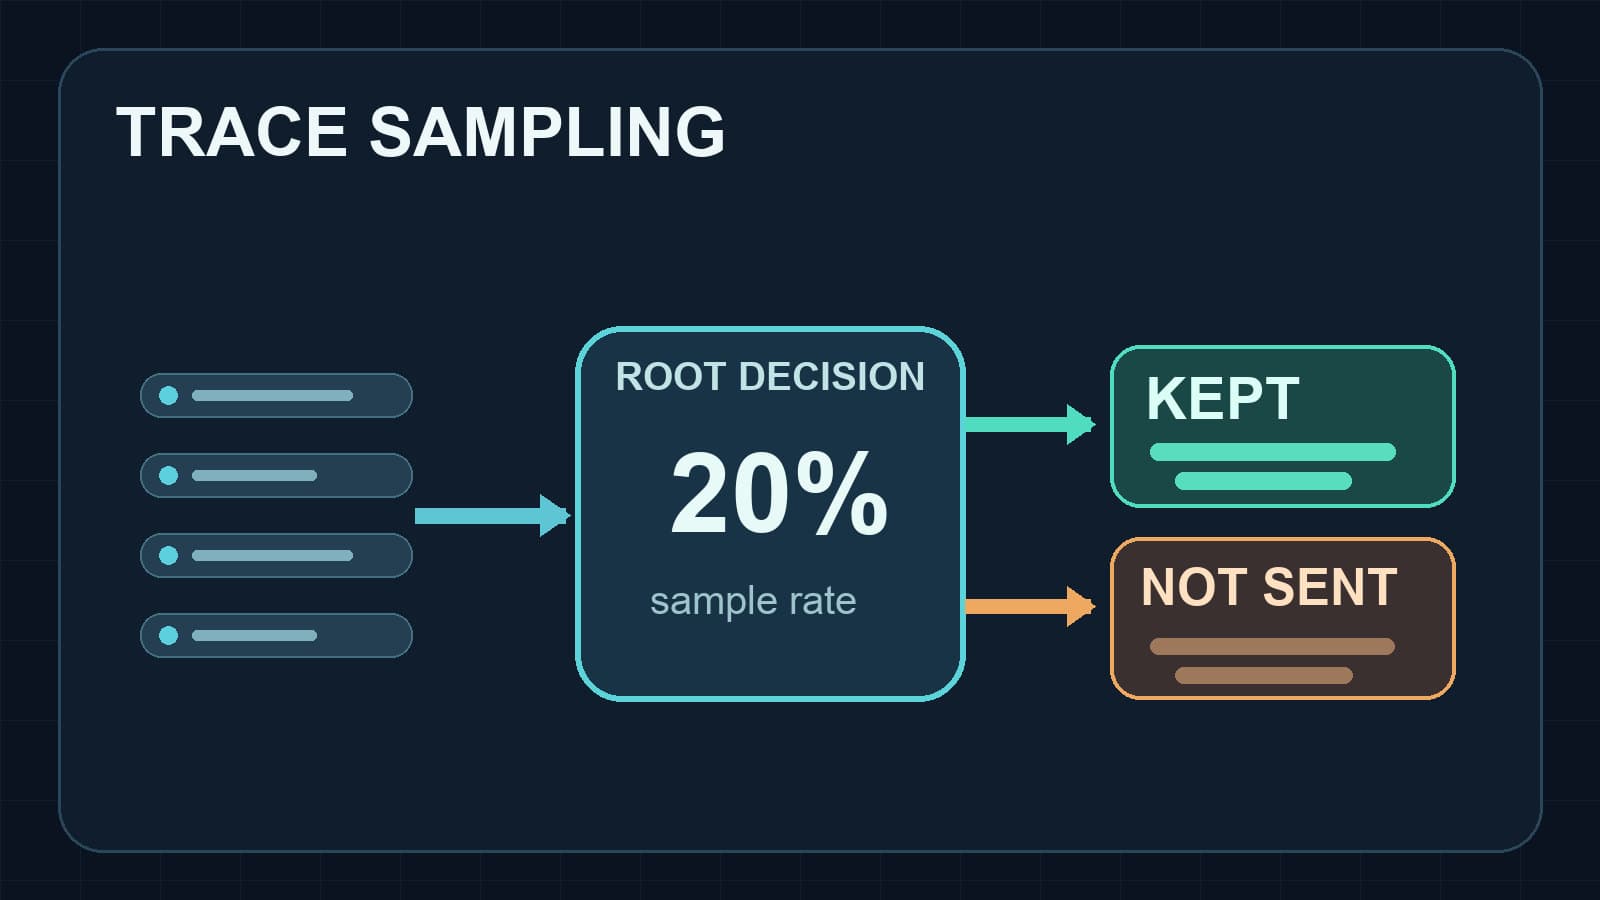
DD_TRACE_SAMPLE_RATE in Node.js: A Practical Guide
Set DD_TRACE_SAMPLE_RATE in Node.js, understand rate limits and sampling rules, and verify which distributed traces reach Datadog.
nodejsdistributed-tracing
Set DD_TRACE_SAMPLE_RATE in Node.js, understand rate limits and sampling rules, and verify which distributed traces reach Datadog.
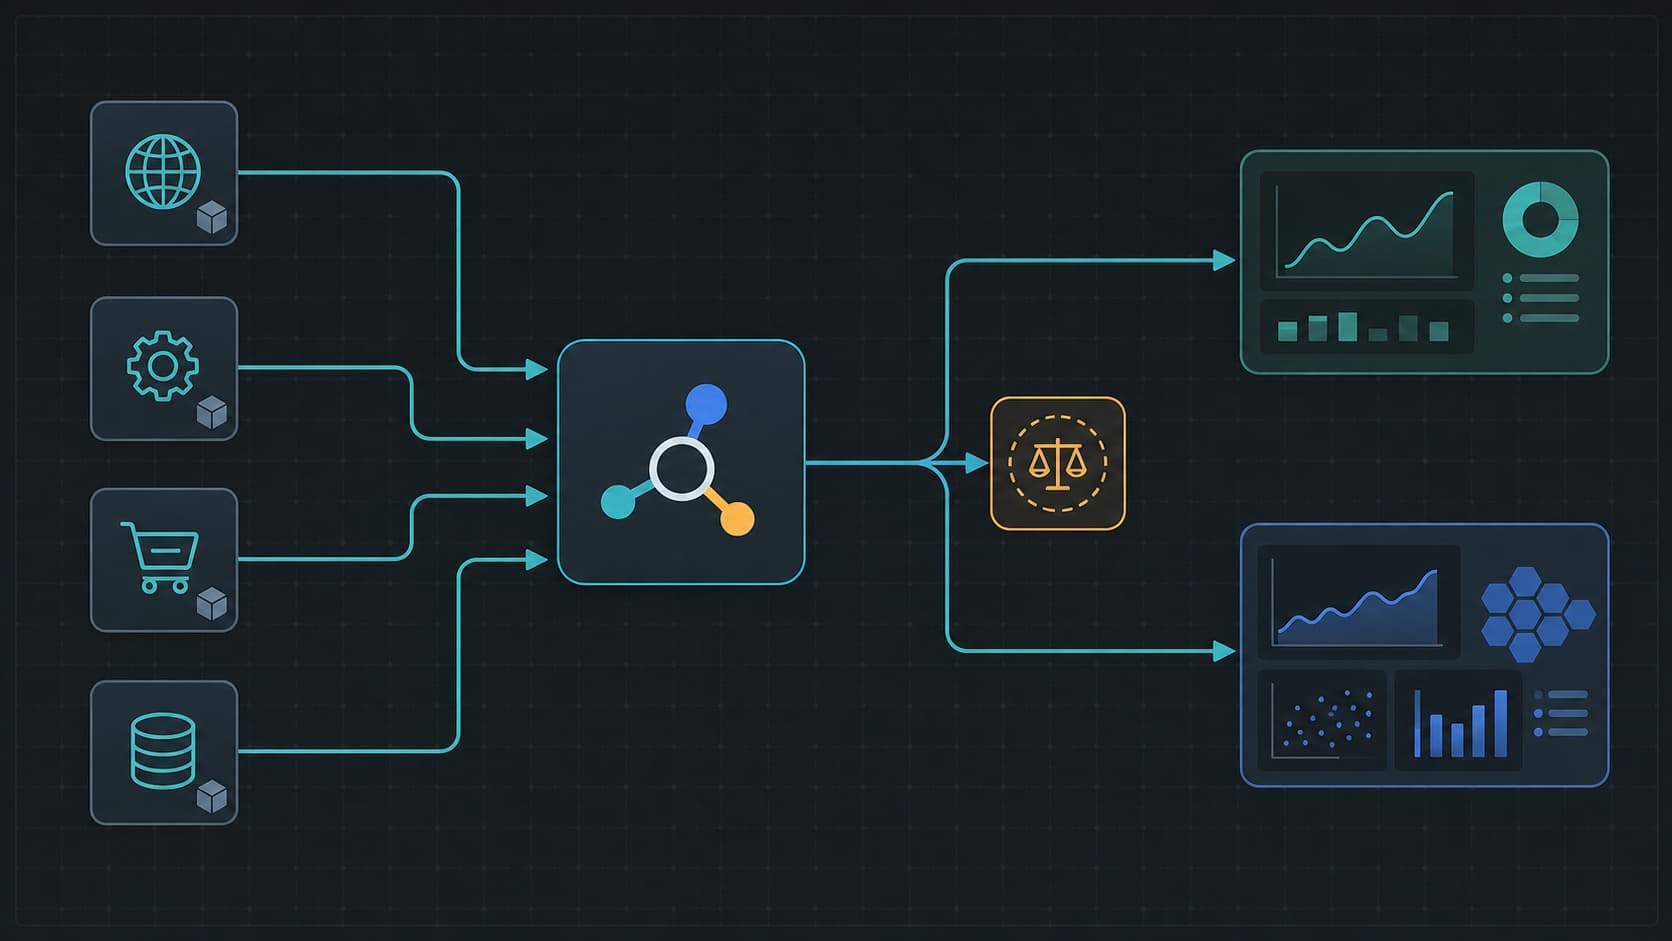
Migrate to OpenTelemetry without downtime with a parallel Collector path, trace parity checks, and a safe service-by-service cutover.
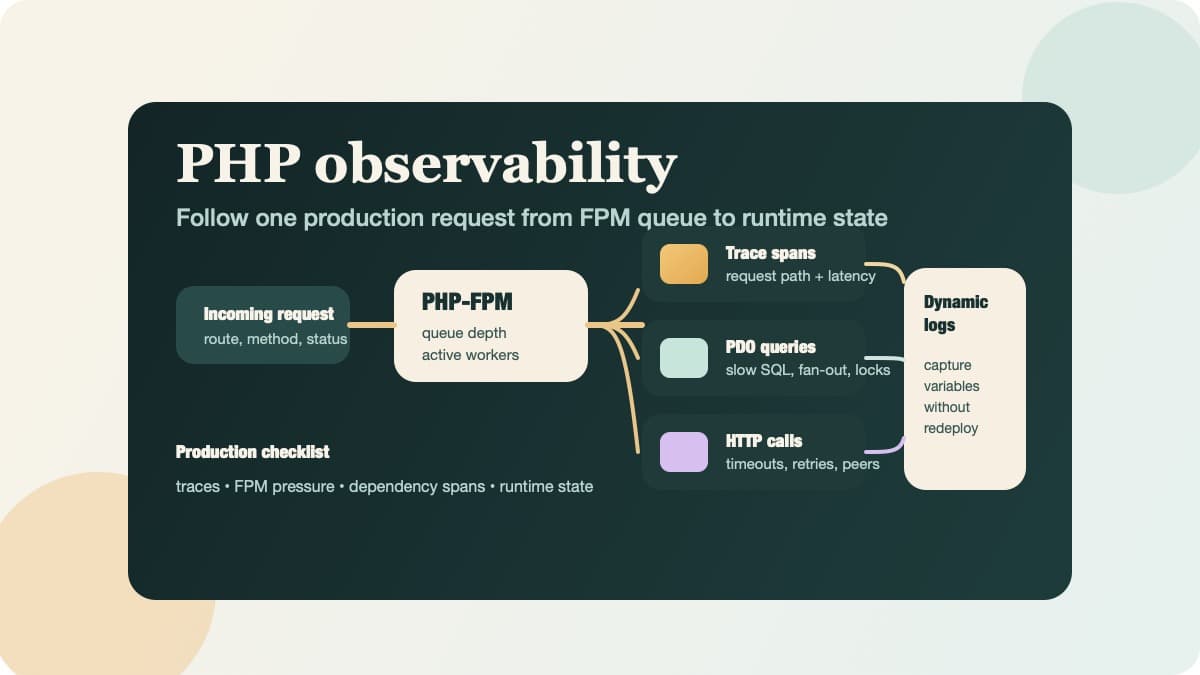
Use this PHP observability checklist to trace requests, surface PDO and HTTP bottlenecks, and inspect runtime state without redeploying.
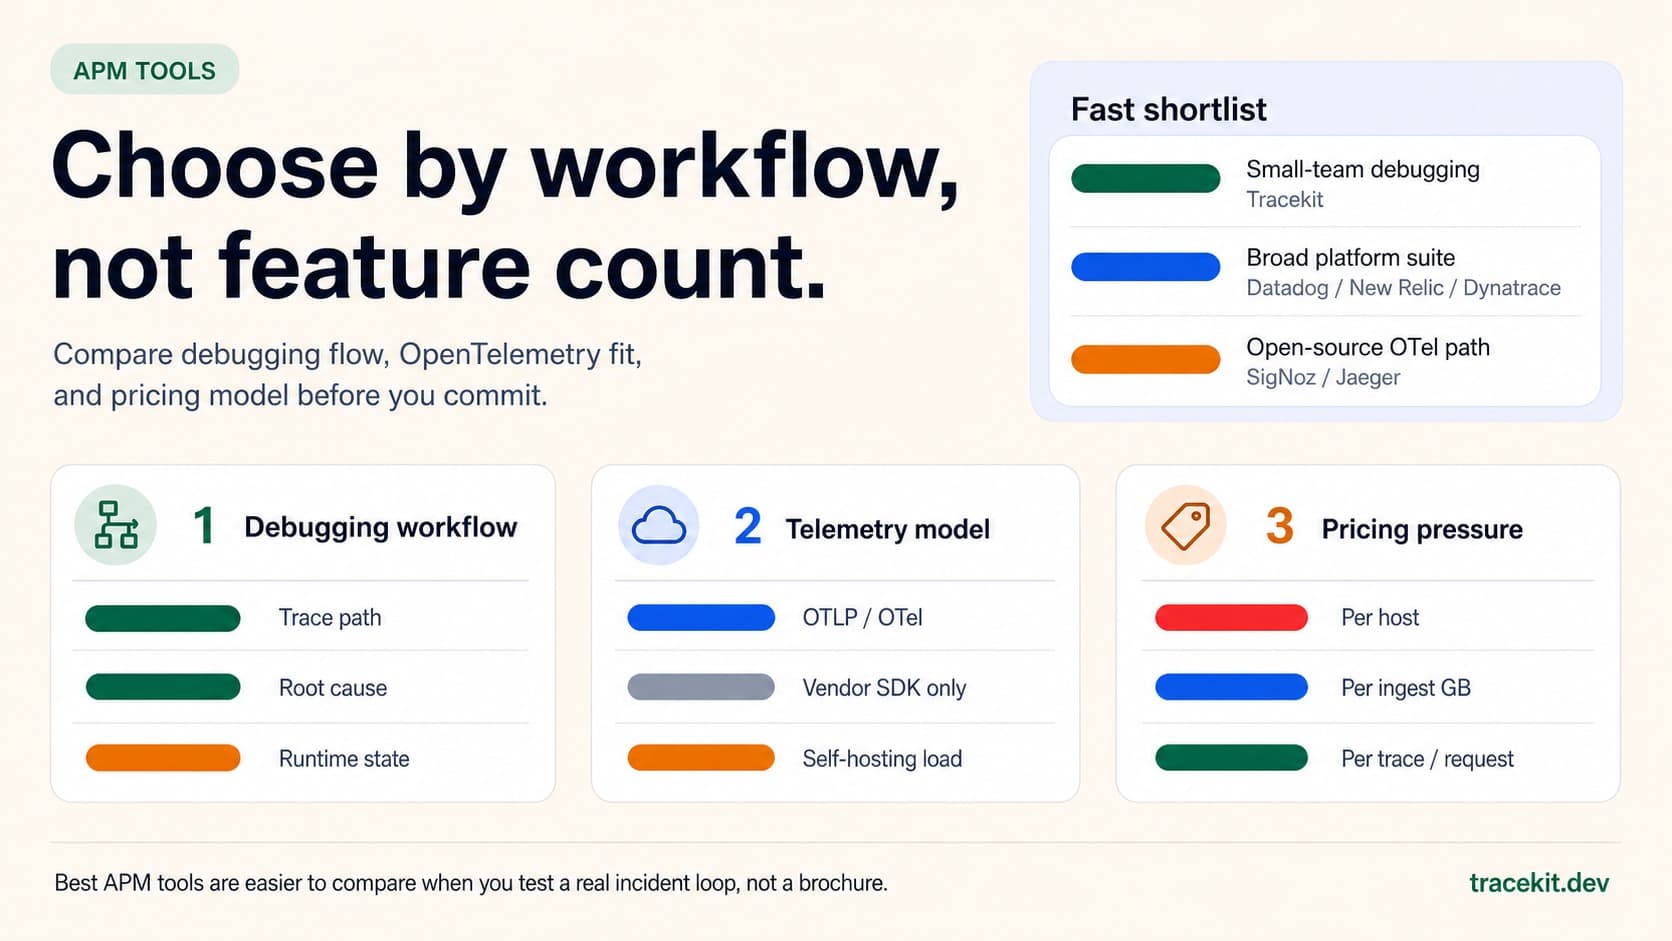
Compare the best APM tools for 2026 by debugging workflow, OpenTelemetry fit, pricing model, and runtime-state visibility.
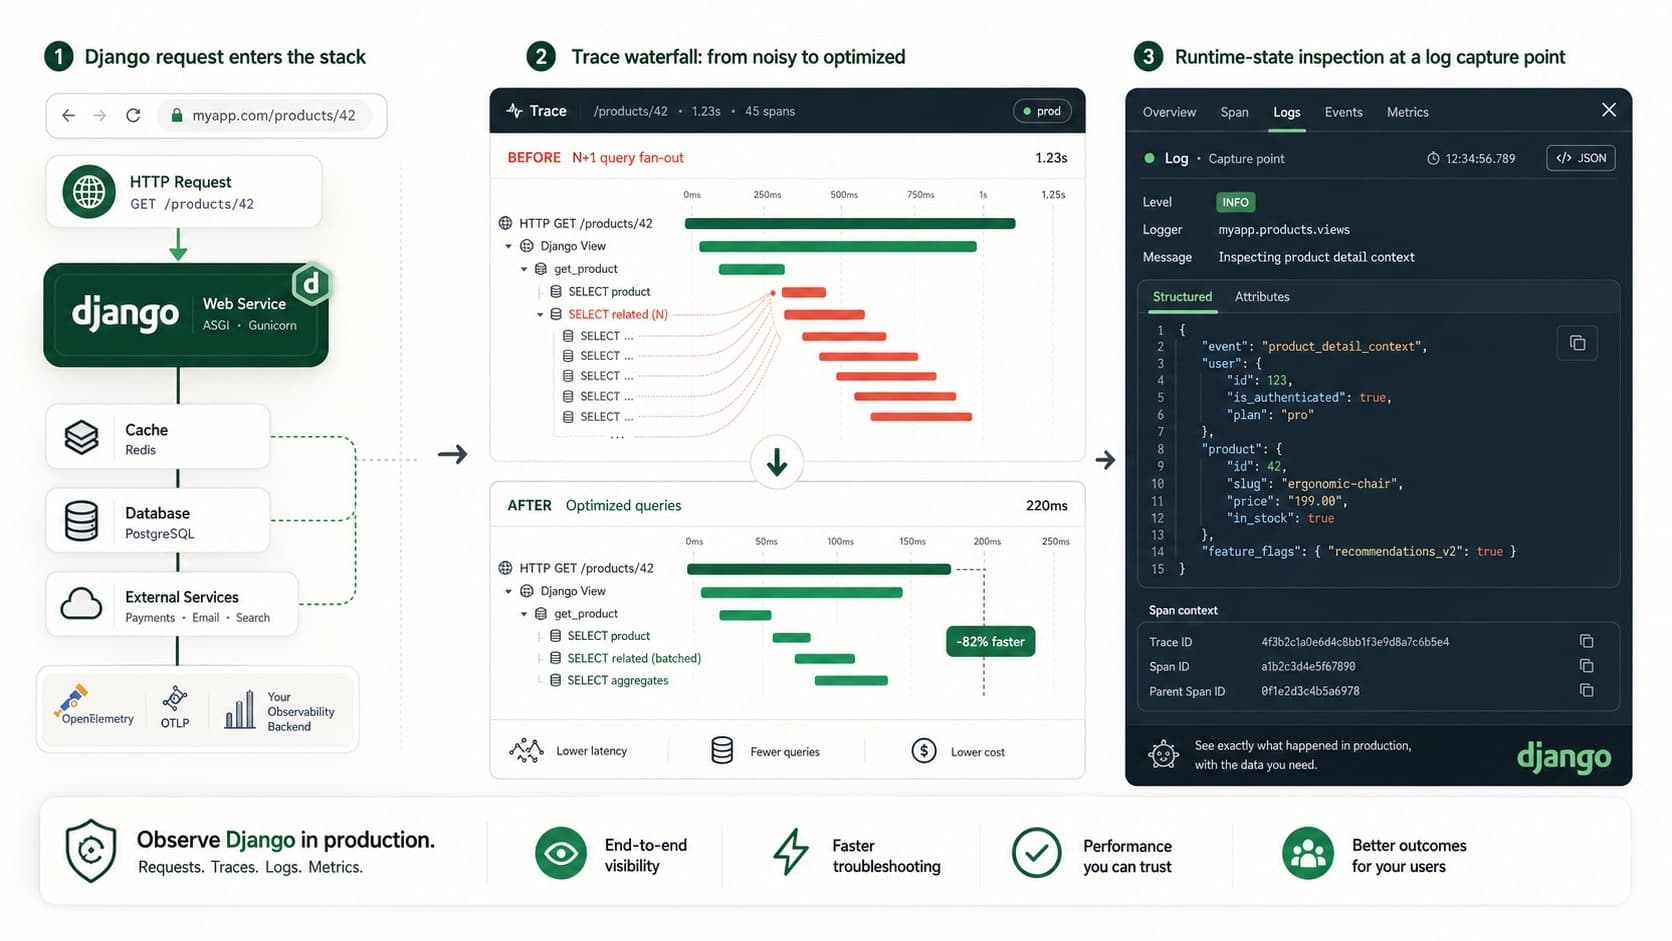
Build Django observability with traces, query visibility, alerts, and dynamic logs so you can debug production issues without guessing.
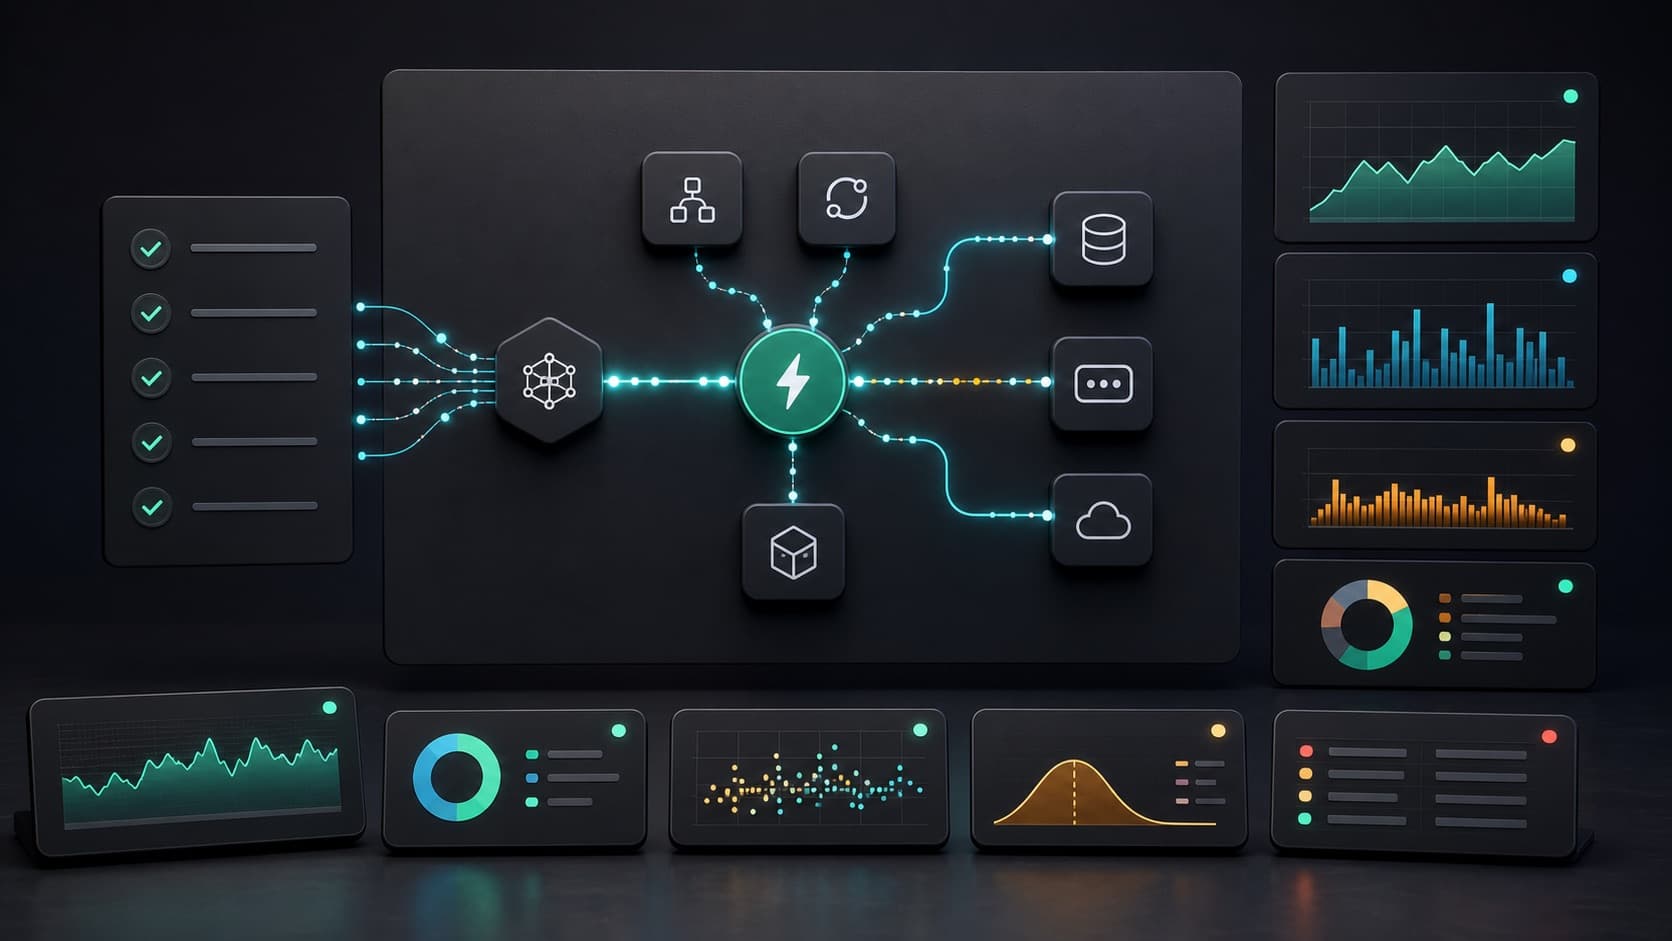
Use this FastAPI background tasks production checklist to catch silent failures, blocked workers, lost trace context, and release regressions.
Your API threw a 500 at 3 AM. A systematic approach to diagnose, trace, and fix production API errors without the panic and guesswork.
Get production visibility without the Datadog bill. Free-tier APM setup with OpenTelemetry for freelancers and small teams who need traces, not invoices.

Compare Tracekit and Datadog for small engineering teams by pricing units, product scope, OpenTelemetry support, and debugging workflow.

Debug distributed systems on a budget. Practical strategies for small teams: observability basics, centralized logging, OpenTelemetry, and AI-assisted diagnosis.

The guess-and-redeploy cycle costs 1,000x more than catching bugs early. Break the cycle with dynamic logs and AI-powered observability.

Compare four observability tools for real-time anomaly detection. Check their signals, baselines, alert timing, and investigation paths.