
20 min
Complete Guide to Application Observability for Startups
Practical observability for startups: logs, metrics, traces with OpenTelemetry, cost-saving sampling, AI-driven detection, and CI/CD integration.
observabilitystartups
Practical observability for startups: logs, metrics, traces with OpenTelemetry, cost-saving sampling, AI-driven detection, and CI/CD integration.
Explore the key differences between application monitoring and observability, and learn how they work together to enhance system reliability.
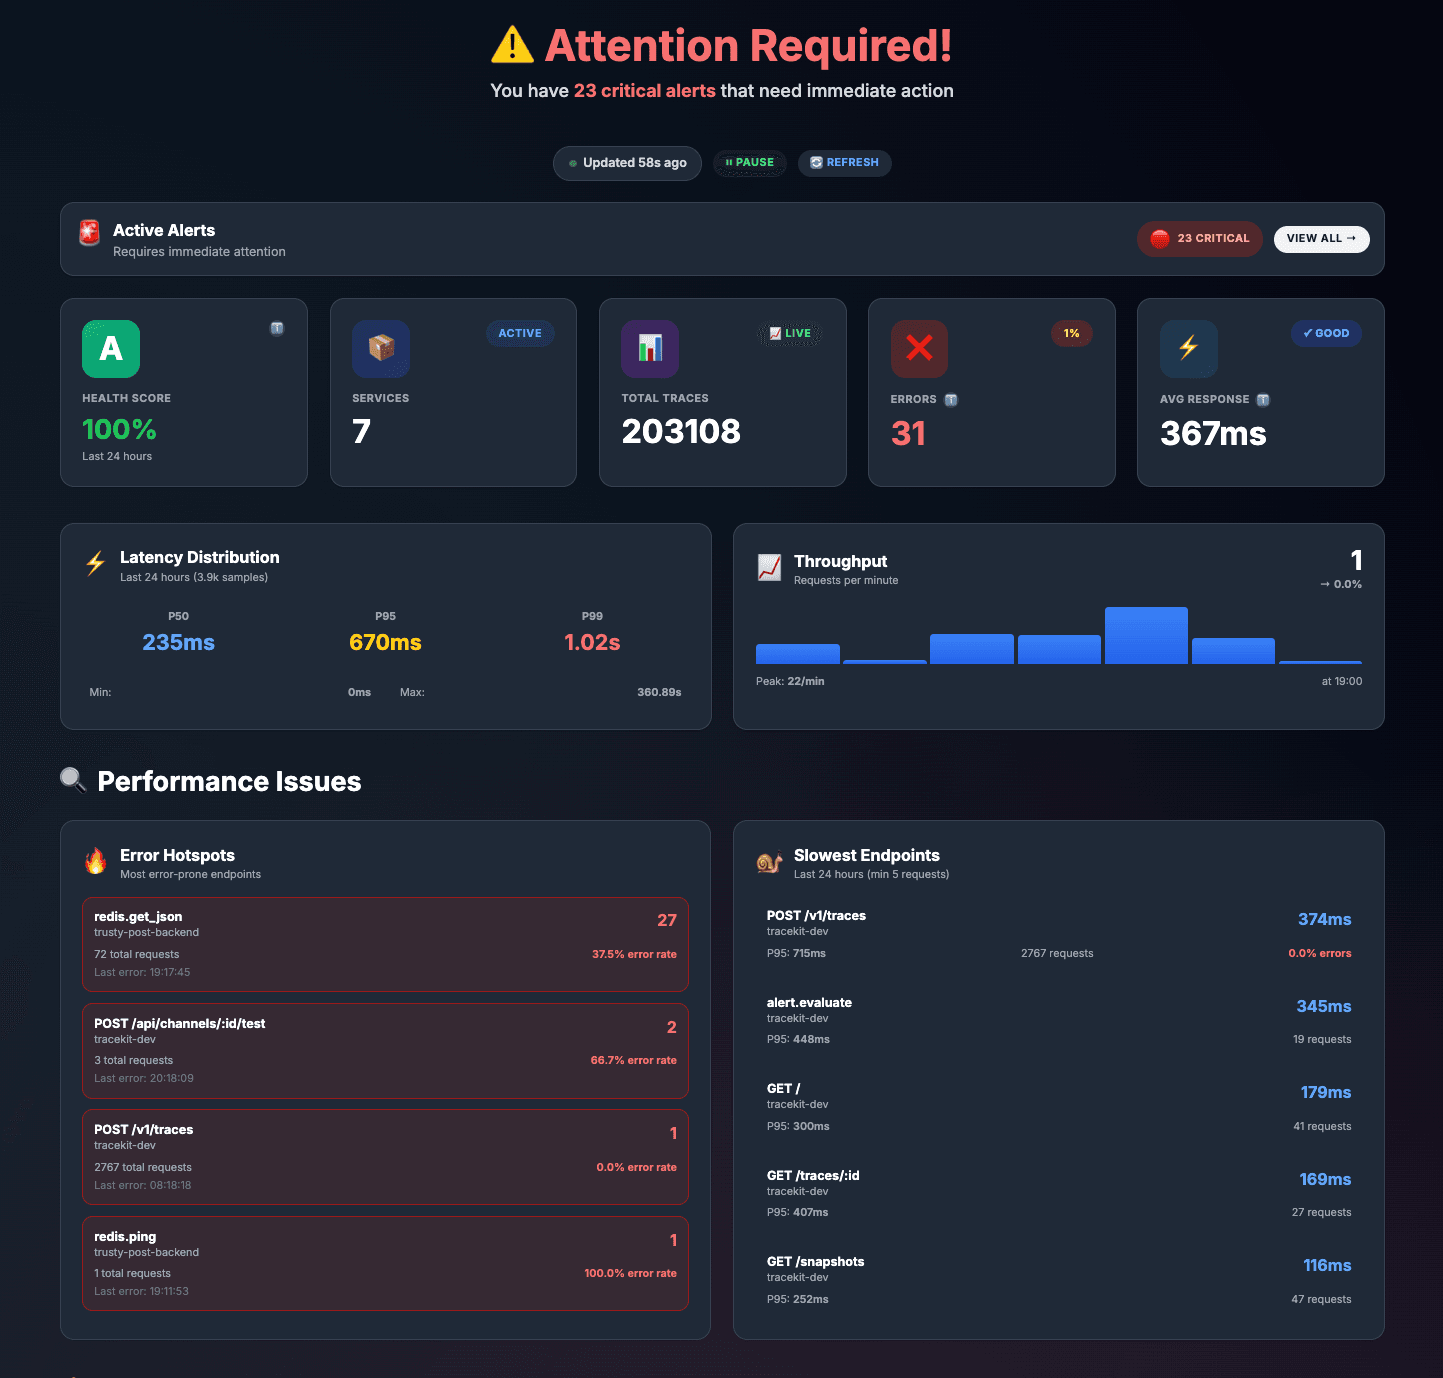
Go observability for production: OpenTelemetry setup for Gin, Echo, gRPC, and GORM. Distributed tracing, metrics, and monitoring for Go services.
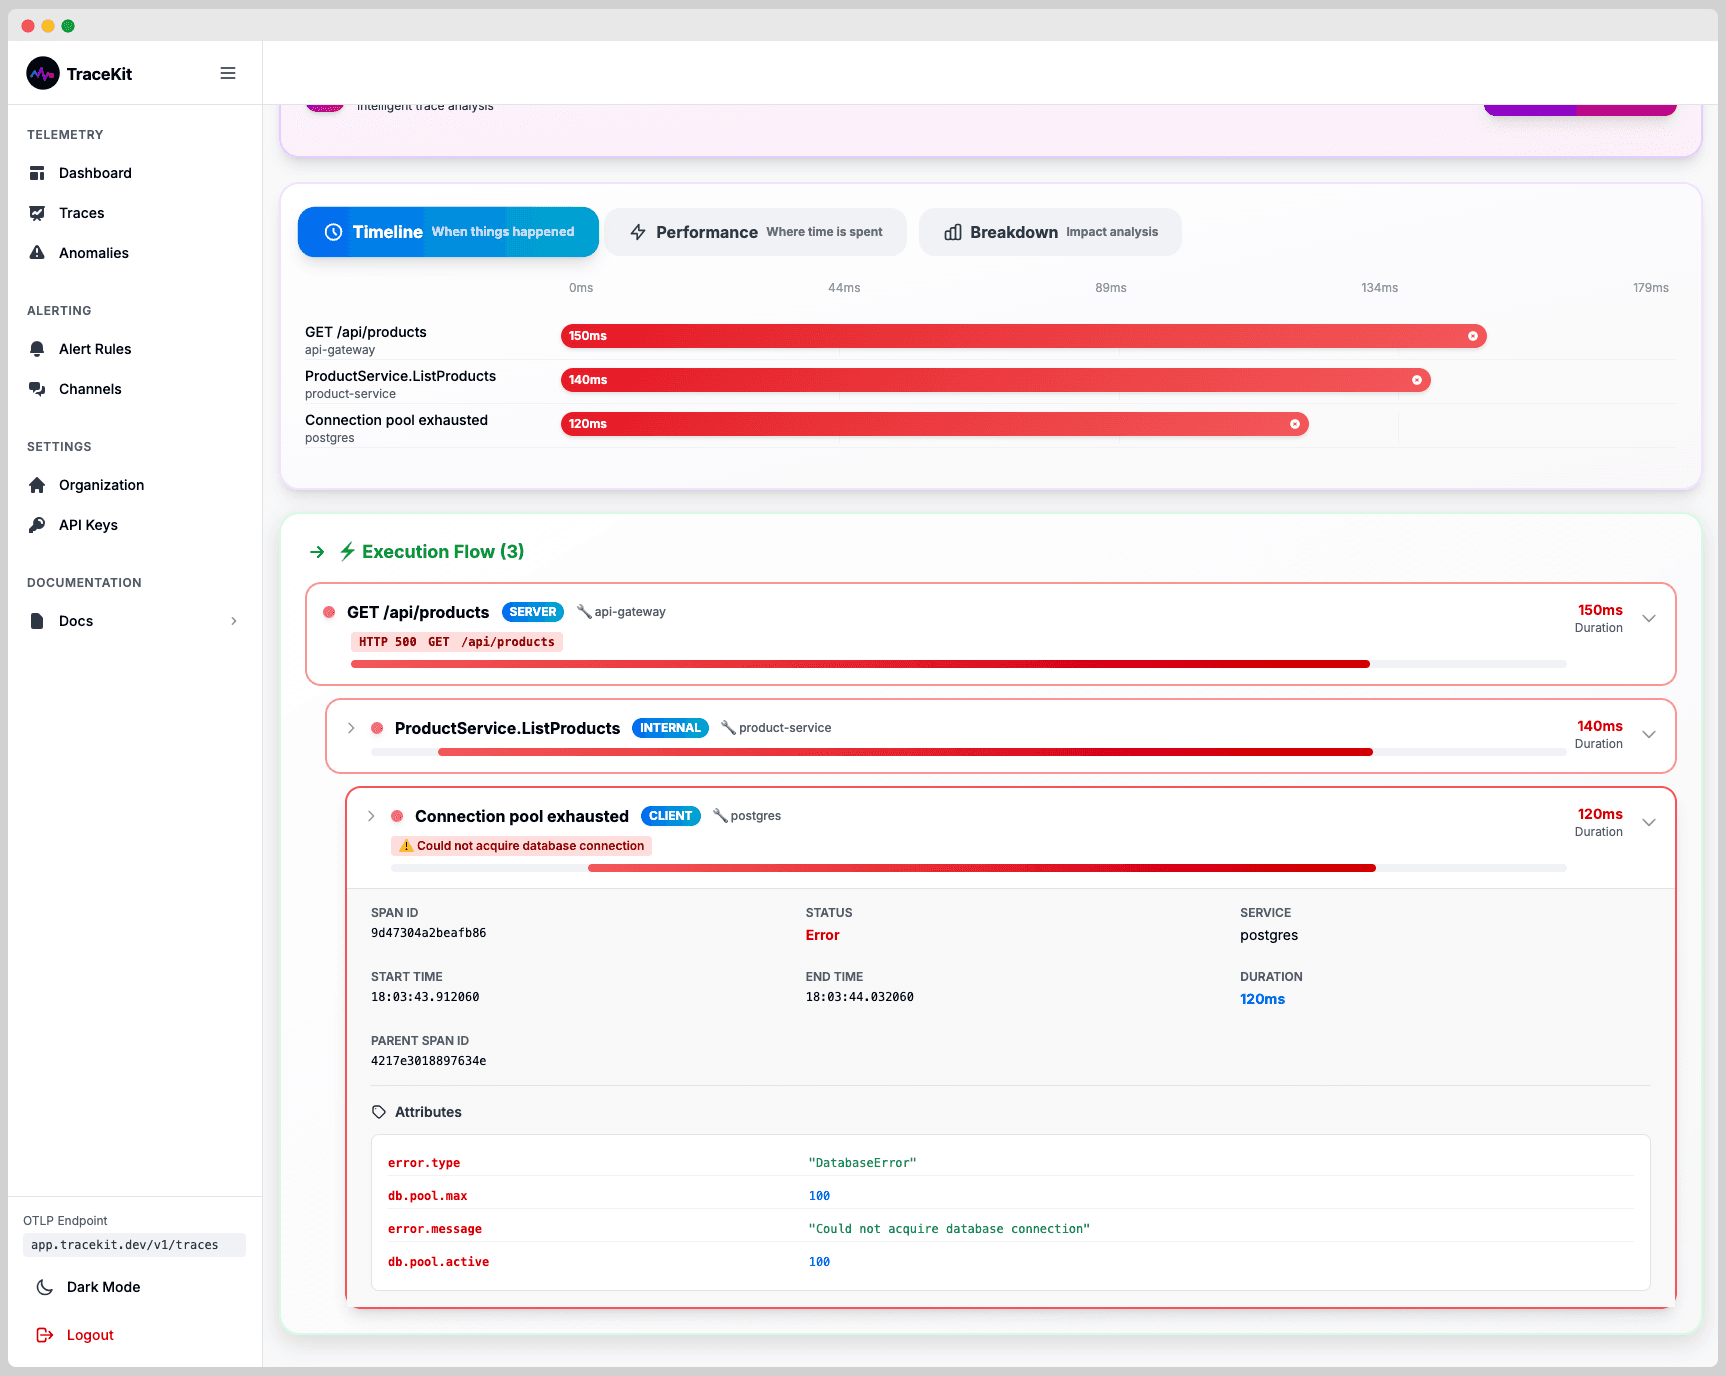
Complete OpenTelemetry setup guide. Install the SDK, configure exporters, and ship your first traces in under 5 minutes. Covers Node.js, Python, Go, and Java.
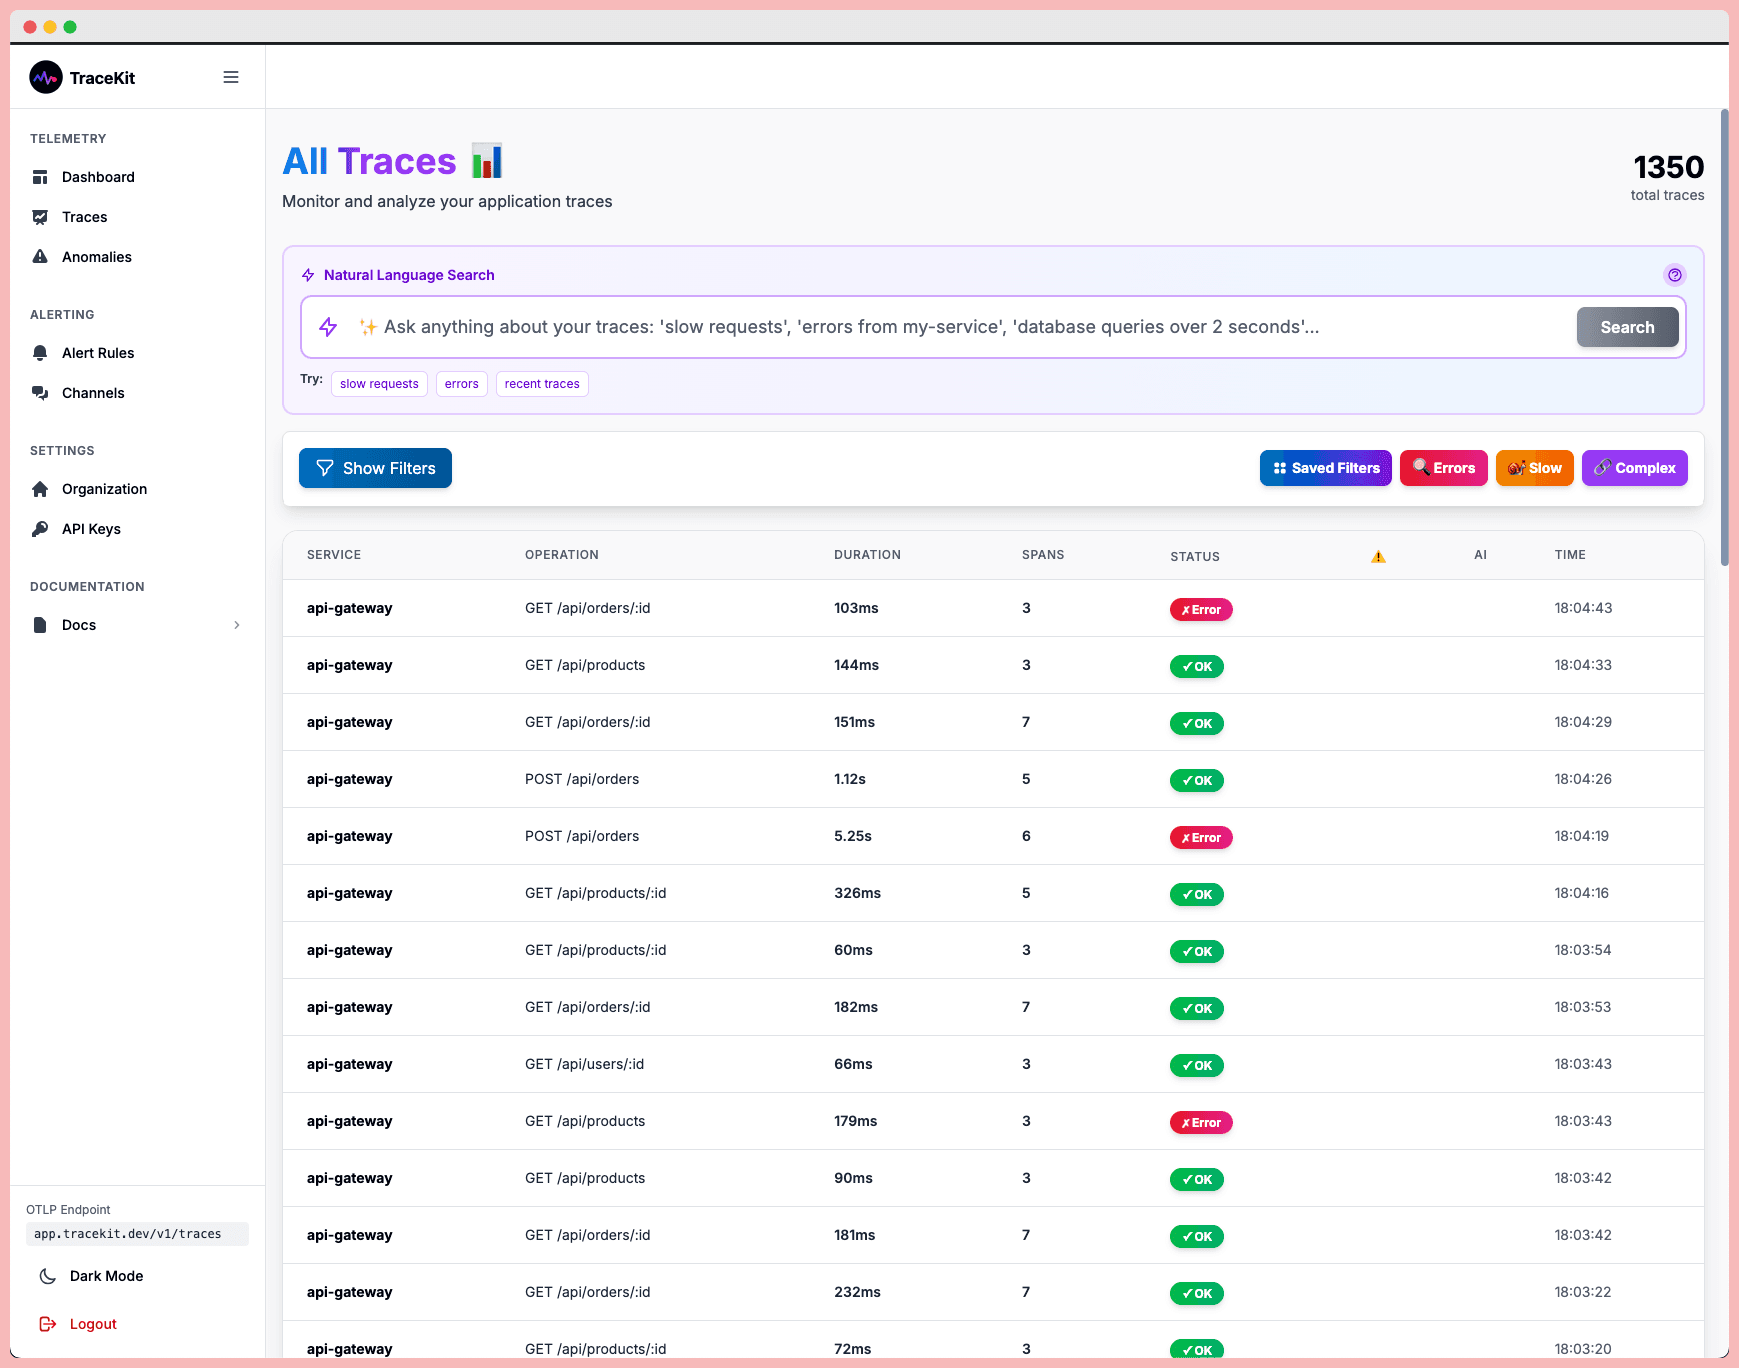
What is observability? Complete guide covering the three pillars (metrics, logs, traces), implementation strategies, and tools for modern software systems.
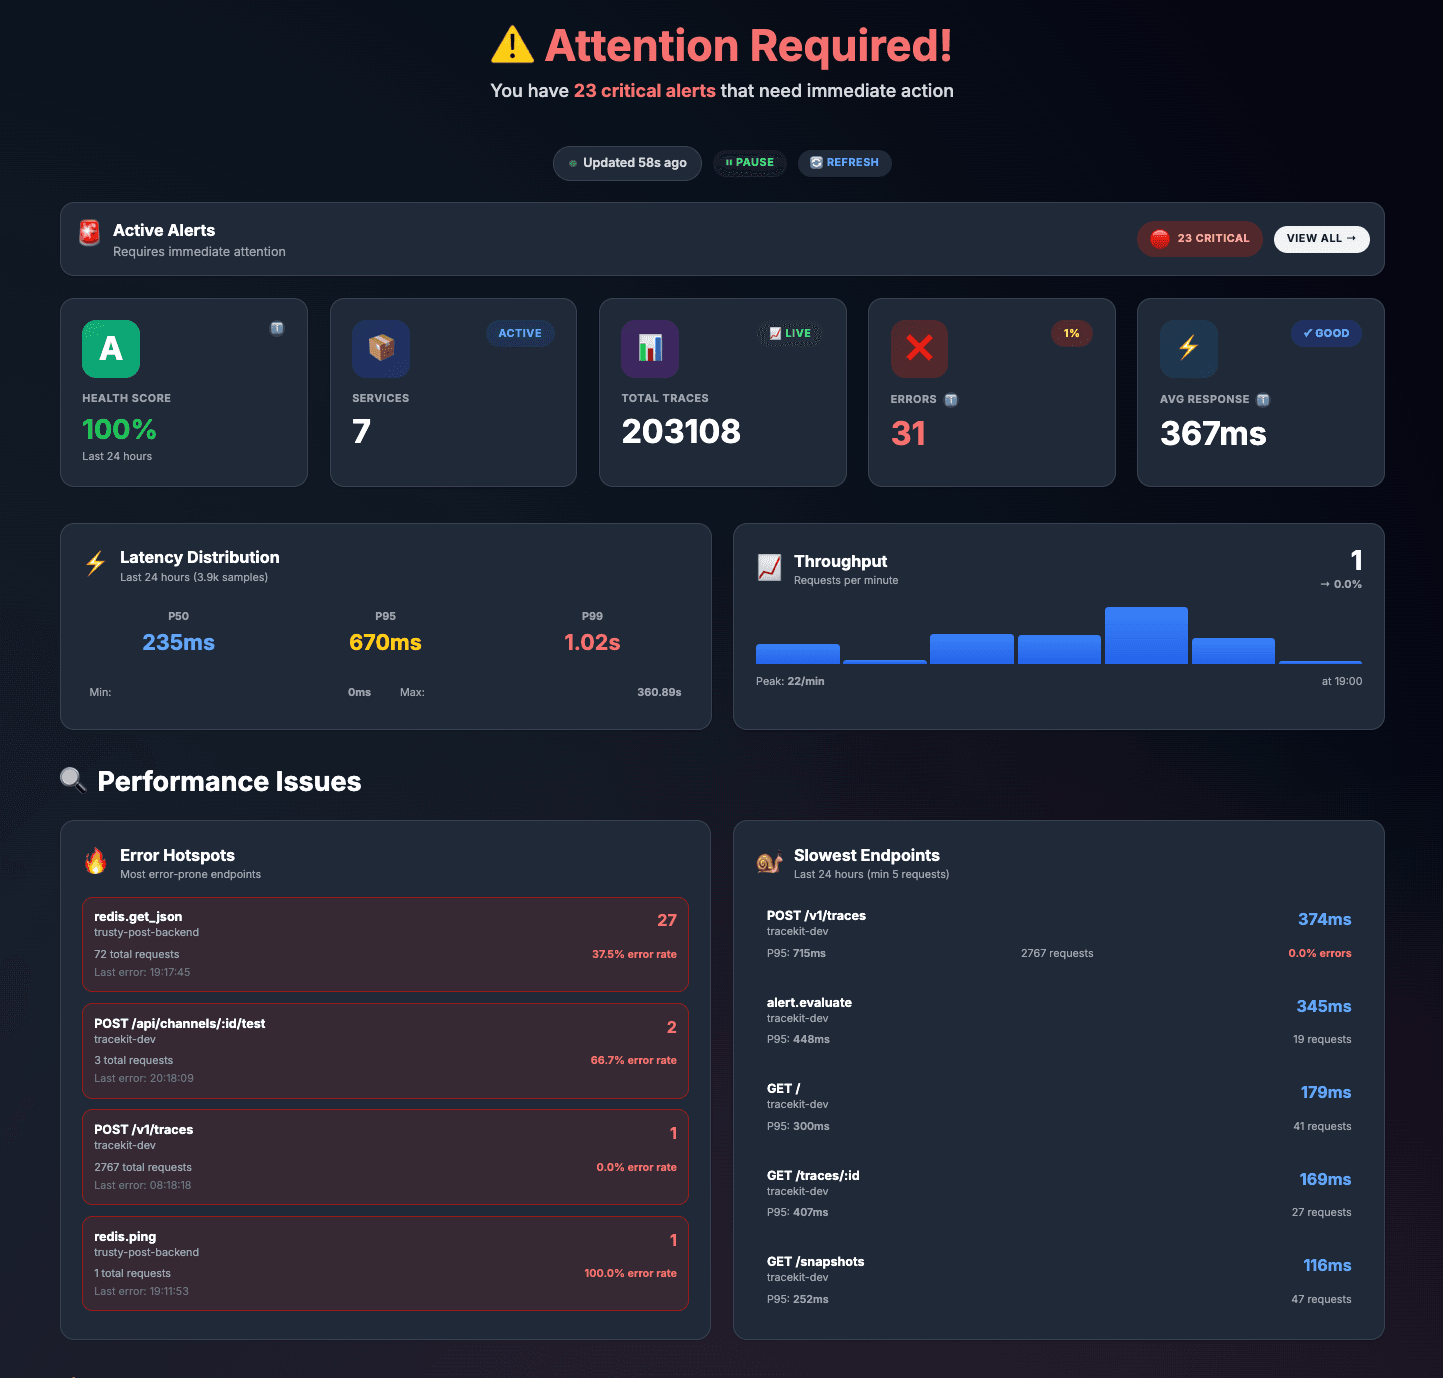
Cut your Datadog bill by 80%. Real migration story: $4,800 to $950/month with side-by-side feature comparison and step-by-step migration guide.
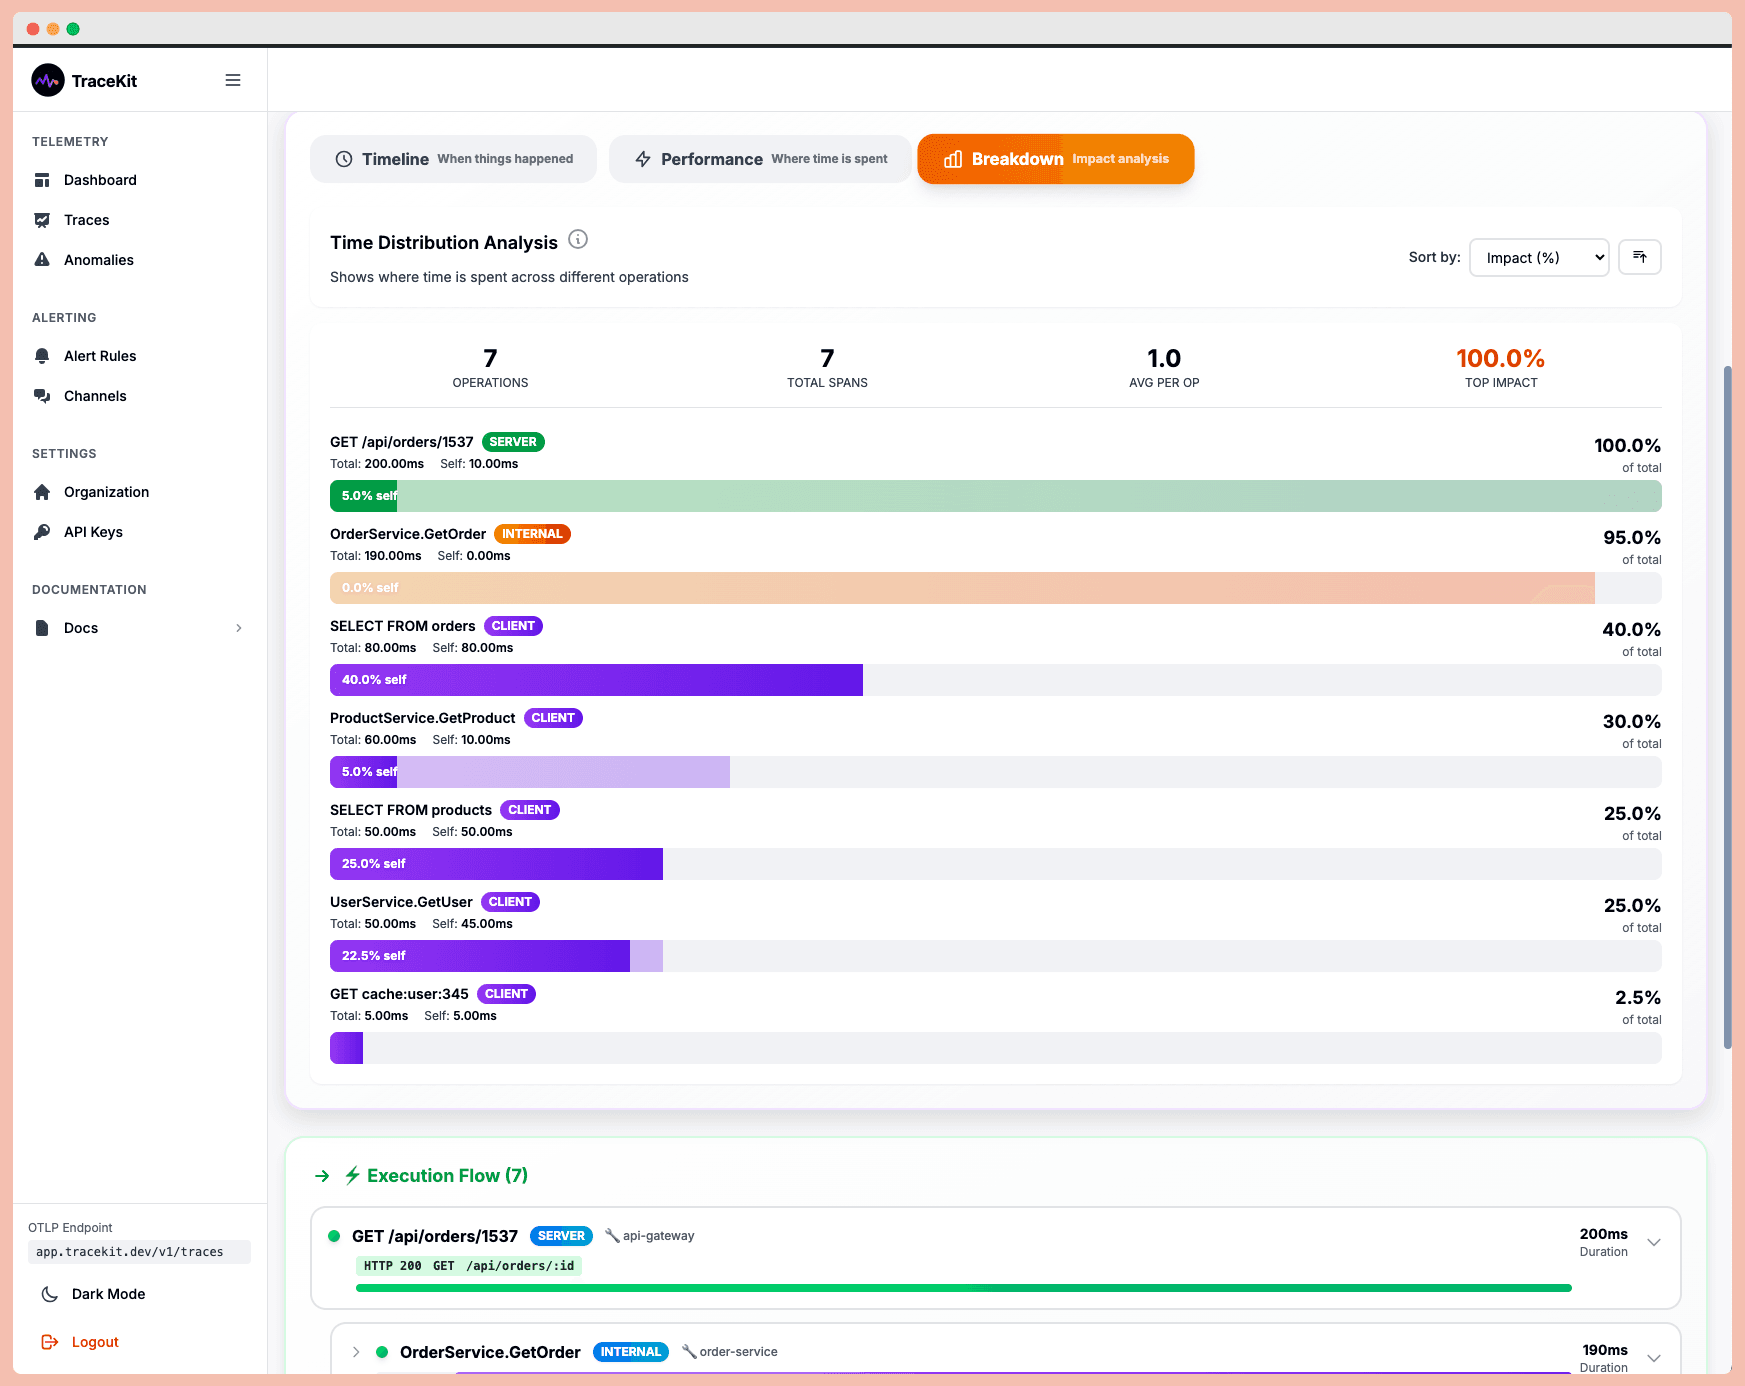
Debug production issues 10x faster with distributed tracing. Track requests across microservices, find bottlenecks, and resolve errors without log diving.