
5 min
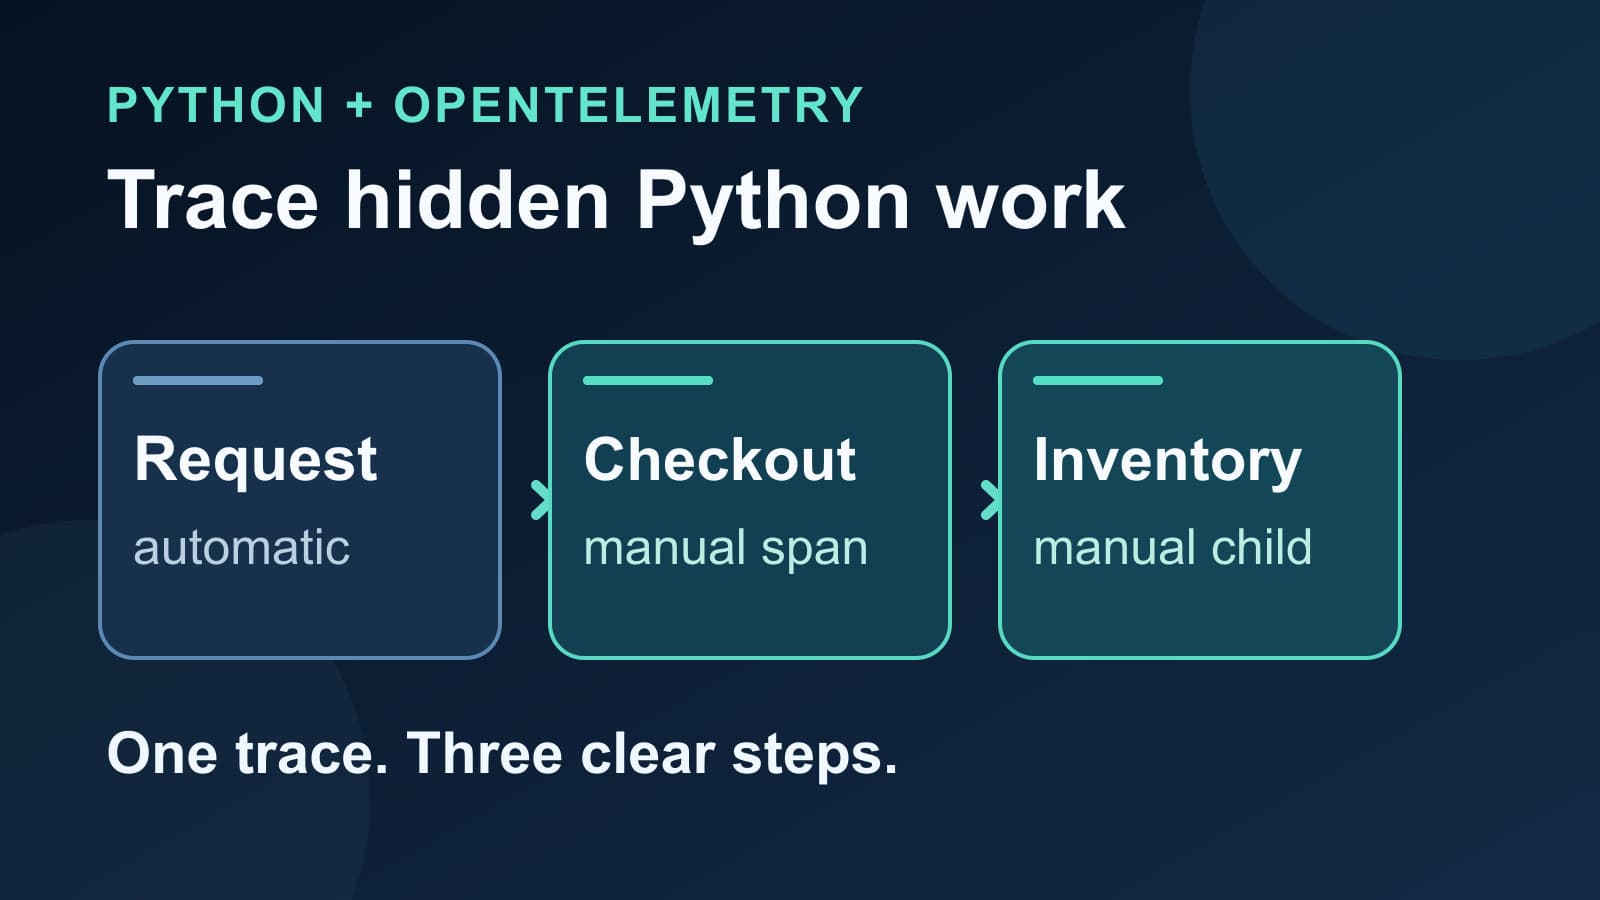
OpenTelemetry Manual Spans in Python Applications
Add OpenTelemetry manual spans to a Python application. See parent-child timing, safe attributes, and a checklist for missing spans.
opentelemetrypython
Add OpenTelemetry manual spans to a Python application. See parent-child timing, safe attributes, and a checklist for missing spans.
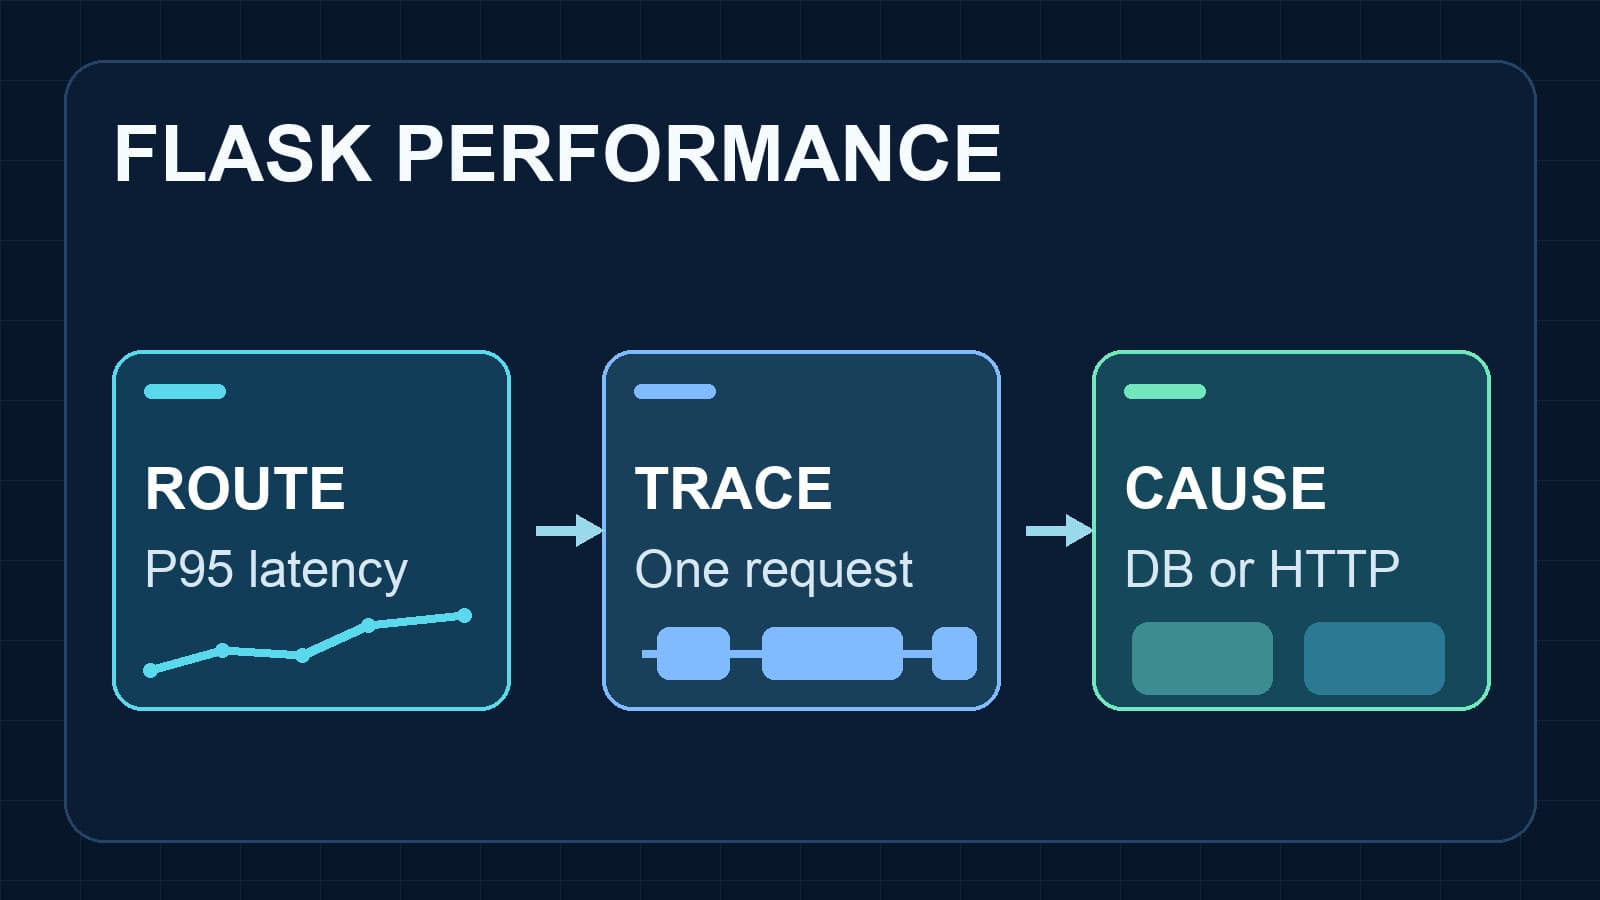
Set up Flask performance monitoring with request metrics and traces. Find slow routes, database calls, and failed exports before users report them.
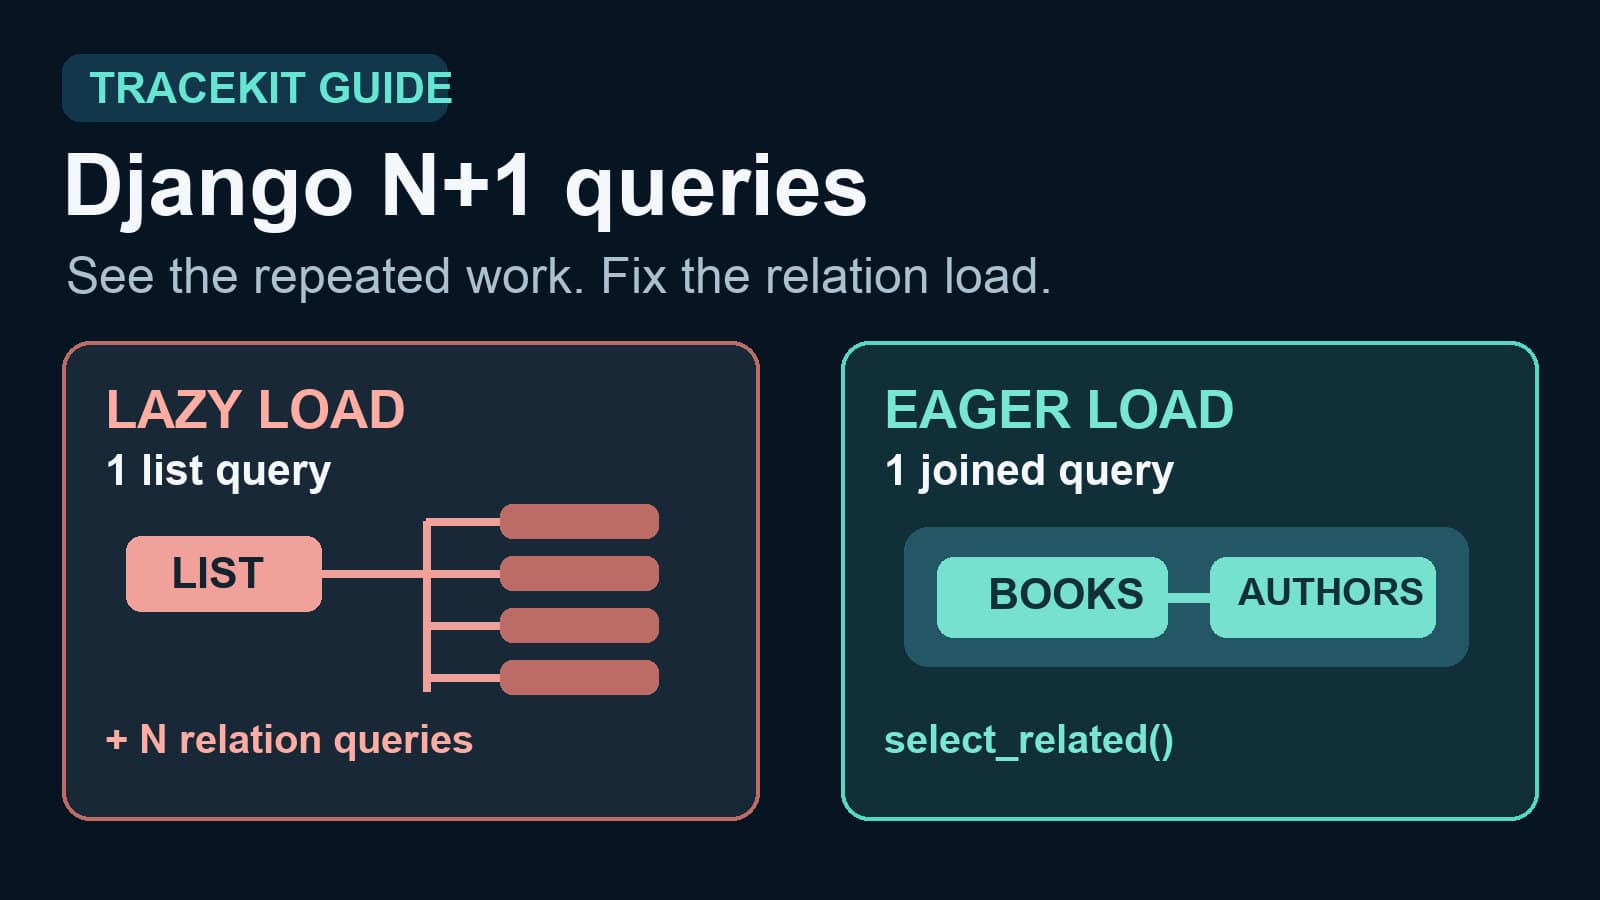
Find Django N+1 queries with query-count tests and request traces. Fix lazy relation loads with select_related or prefetch_related.
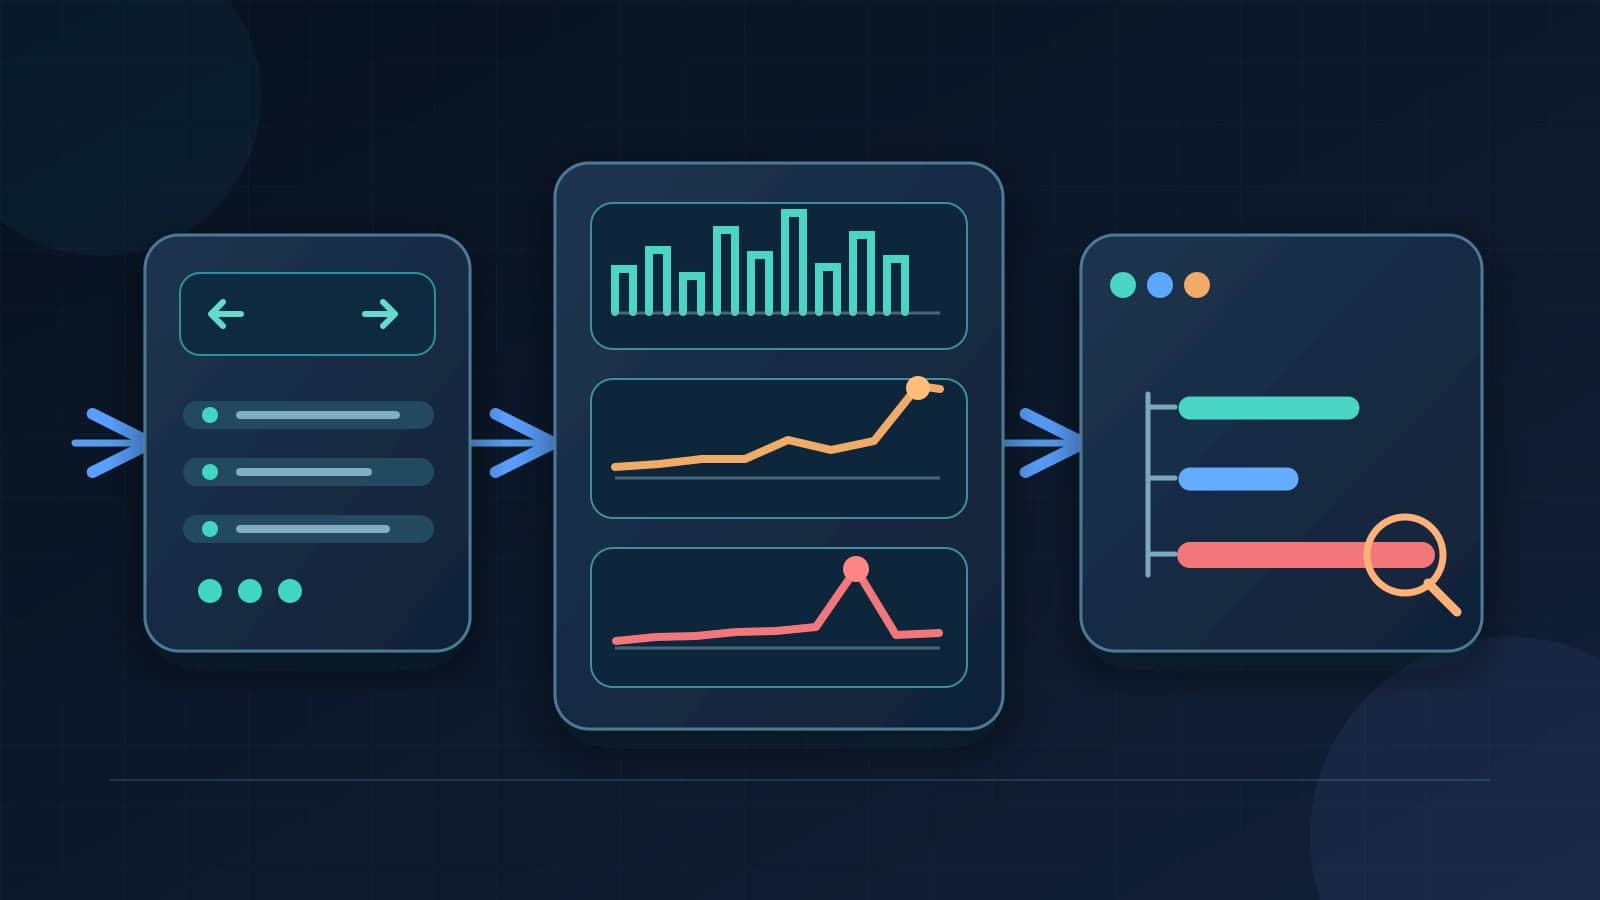
Monitor FastAPI routes with request metrics and OpenTelemetry traces. Check latency, errors, and downstream work before setting alerts.

Set up FastAPI tracing with OpenTelemetry. Connect request, SQLAlchemy, and HTTPX spans, then verify trace context across services.
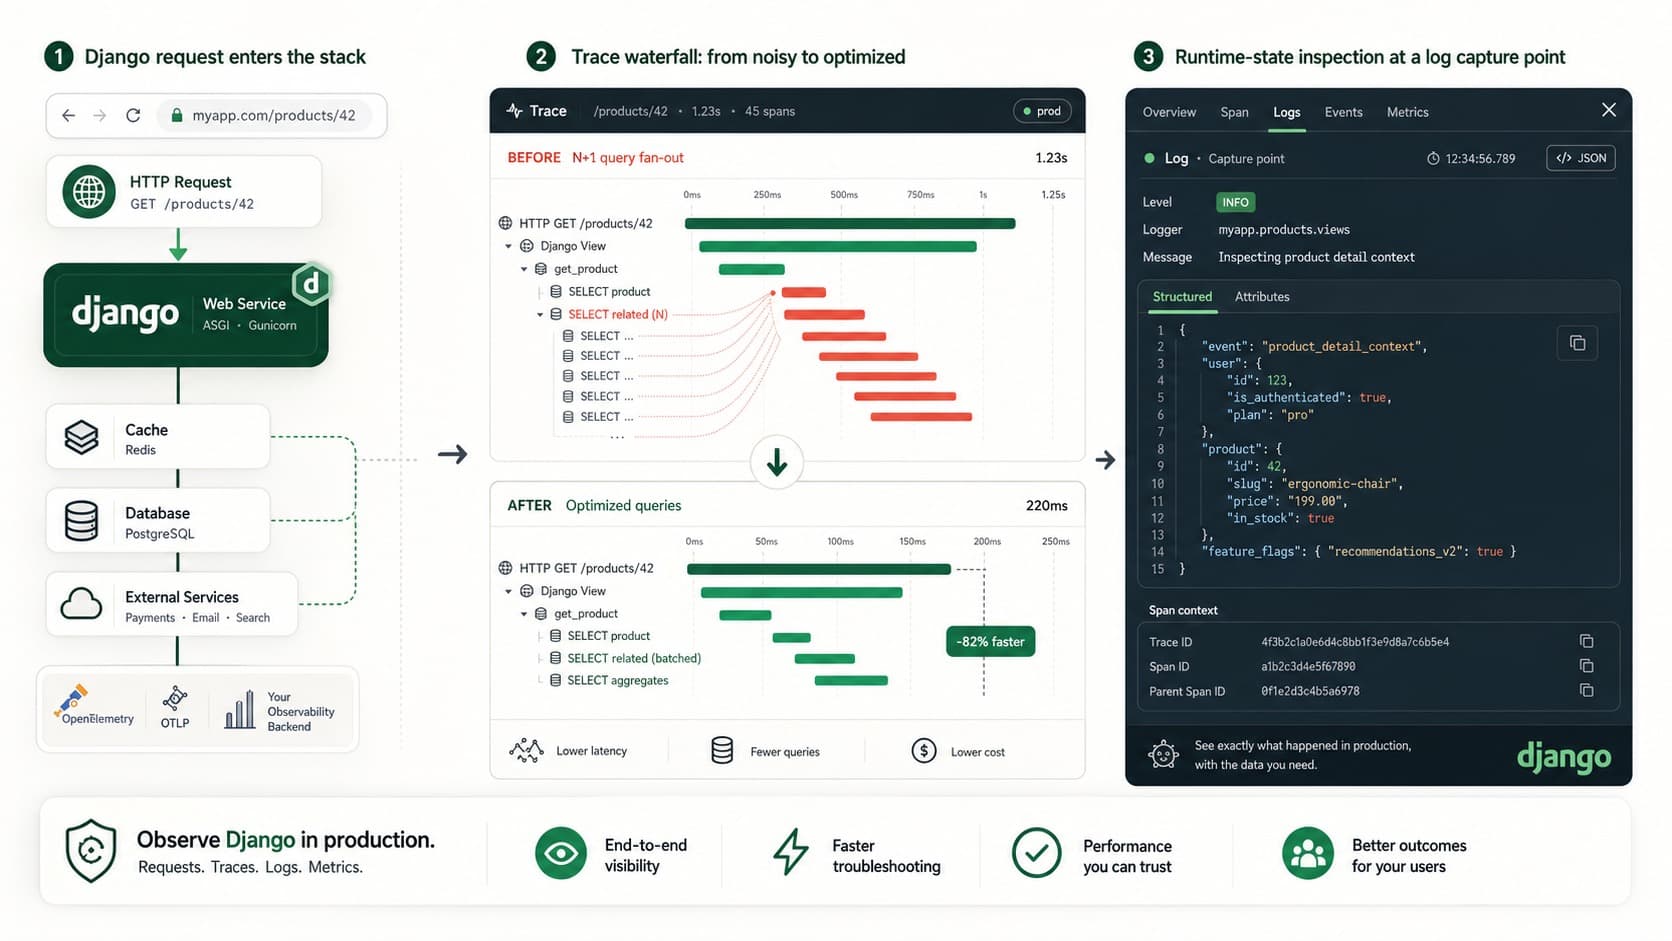
Build Django observability with traces, query visibility, alerts, and dynamic logs so you can debug production issues without guessing.
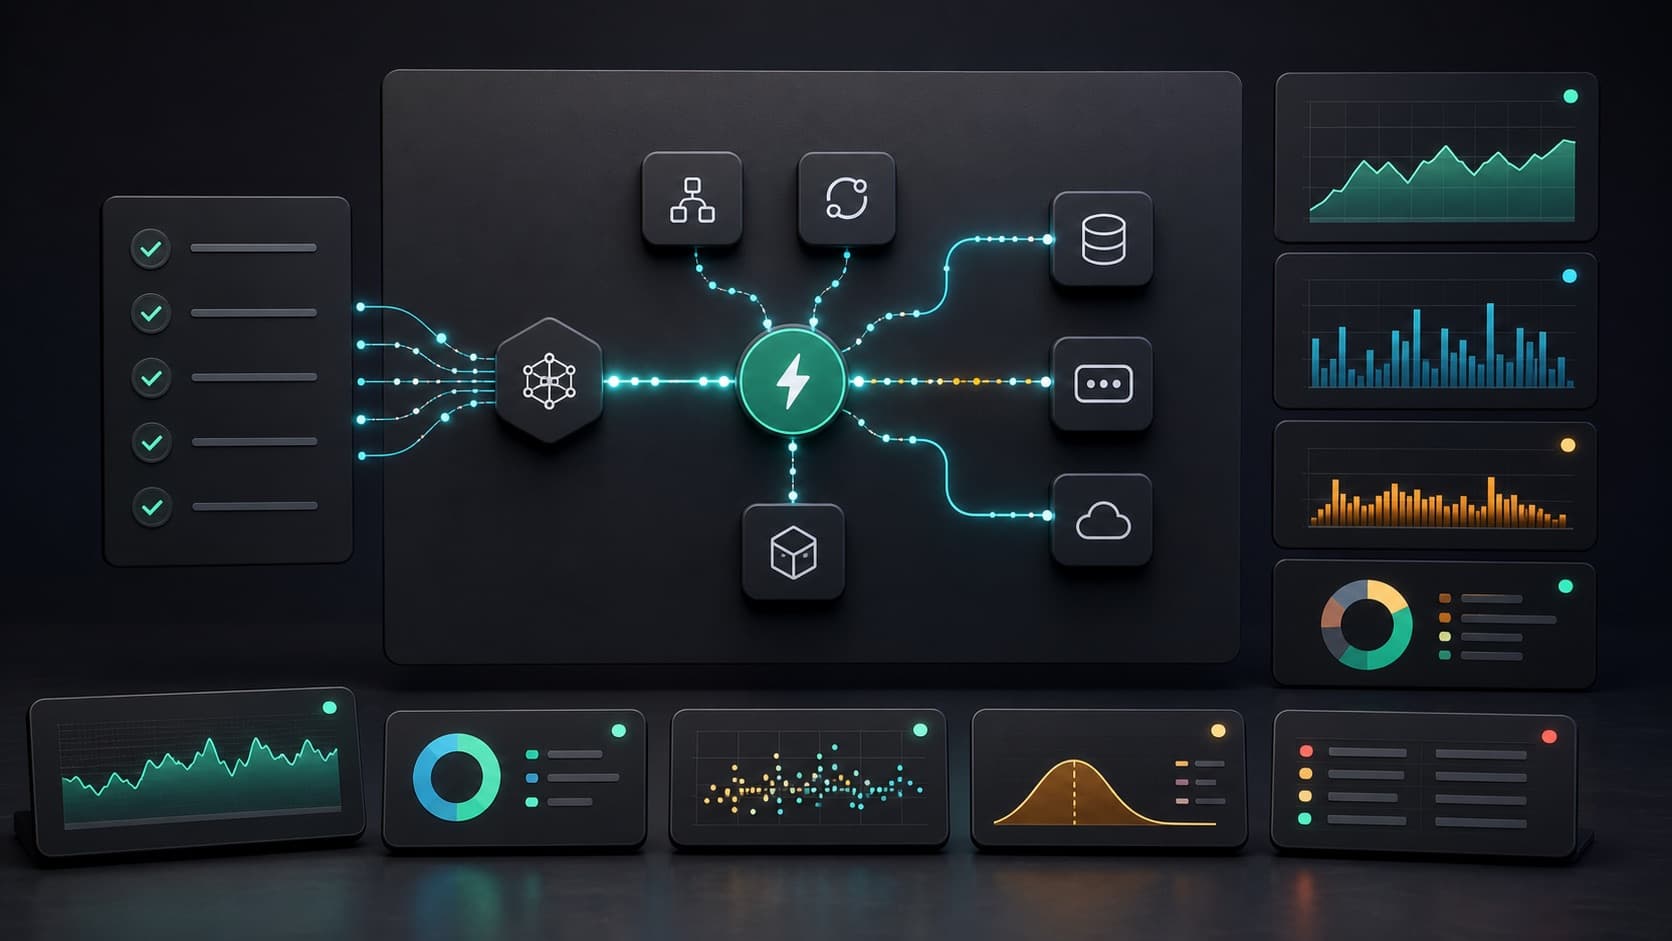
Use this production observability checklist for FastAPI applications to verify request metrics, traces, errors, background tasks, alerts, and releases.

Step-by-step guide to debugging production without redeploying. Set up dynamic logs for PHP, Node.js, Go, and Python in minutes.

Debug Django apps in production without DEBUG=True or redeploying. Use dynamic logs, flame graphs, and distributed tracing to fix issues in real time.
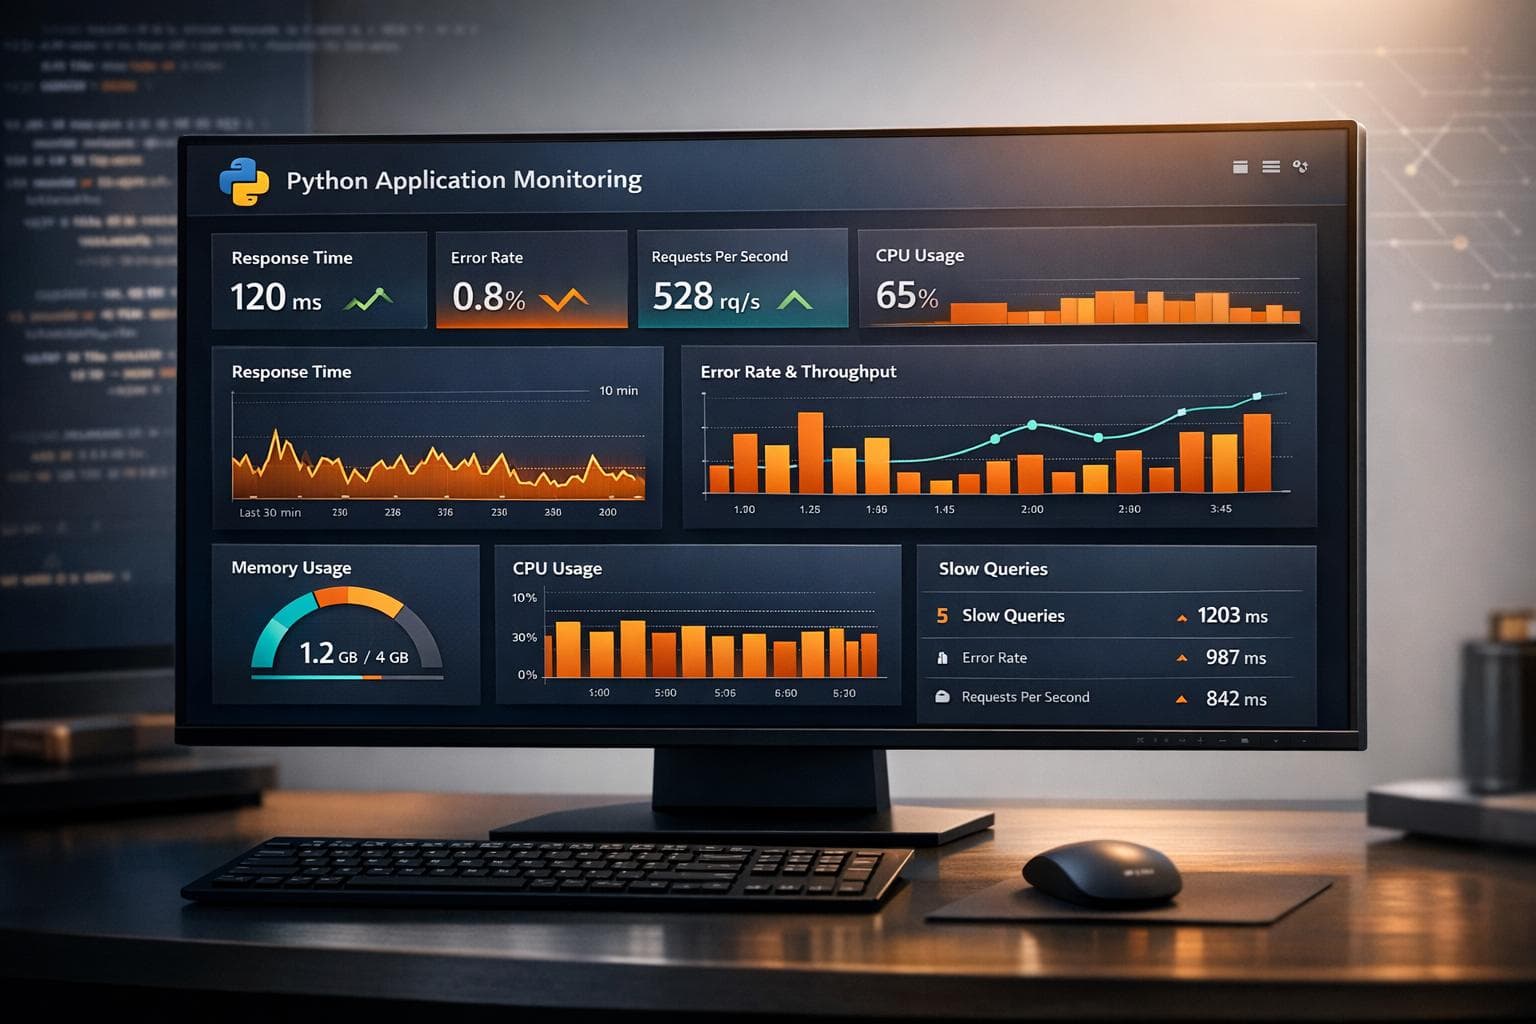
Set up Python application performance monitoring with OpenTelemetry. Measure latency, errors, throughput, and dependency spans across production requests.
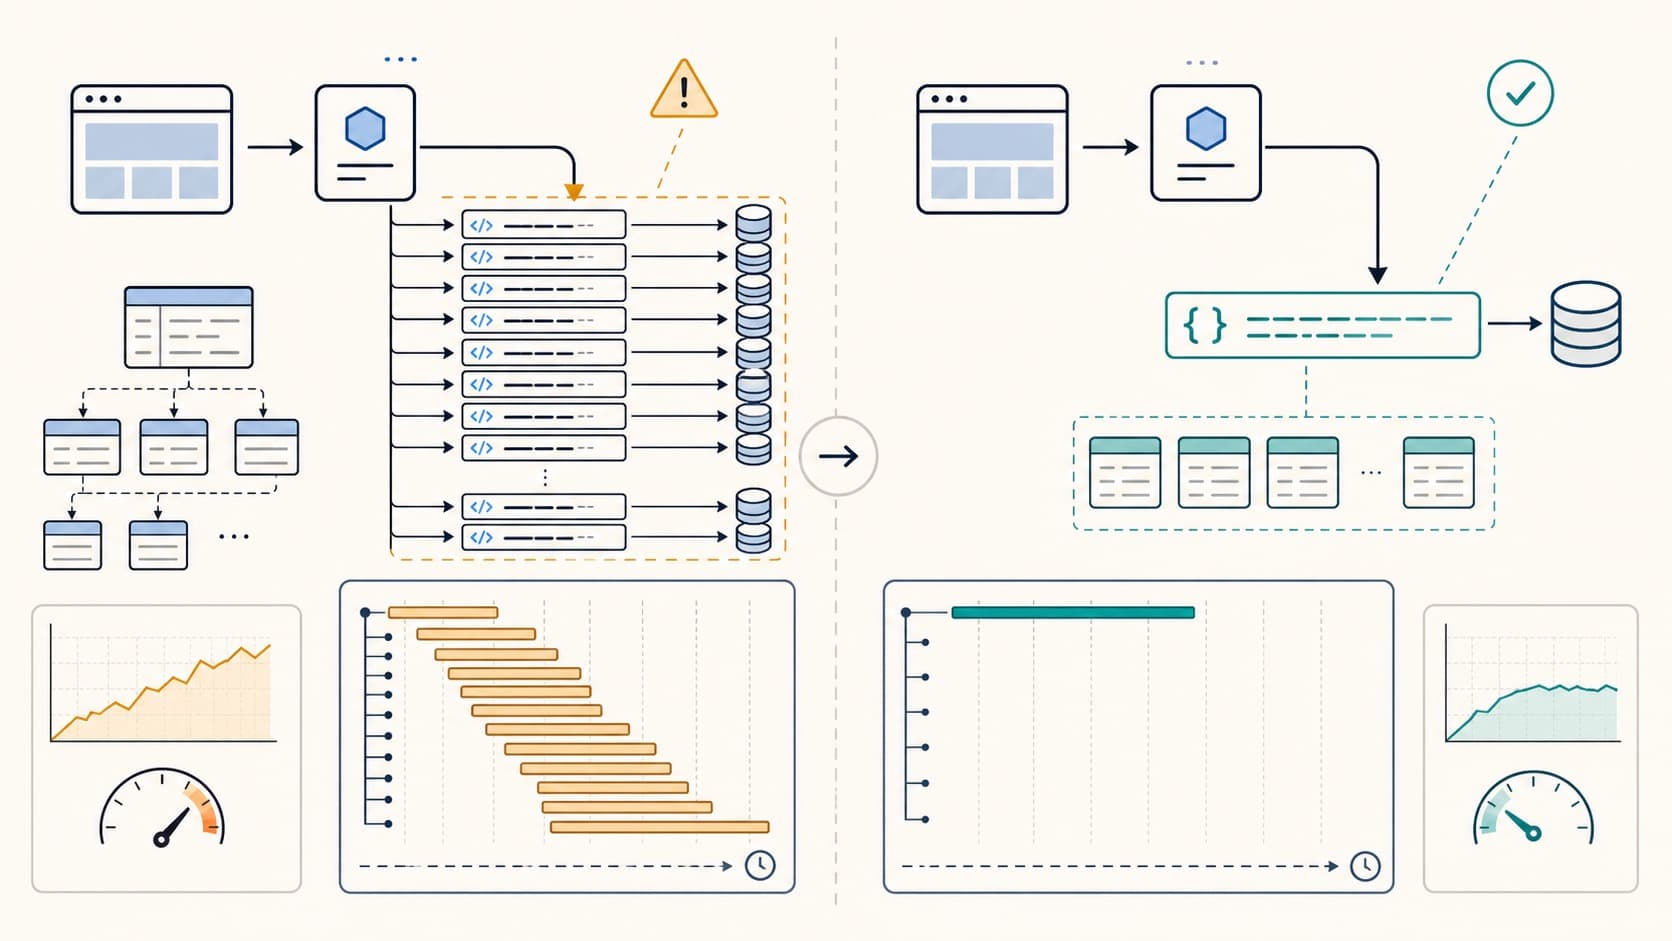
Detect N+1 queries with query counts and traces. Find repeated database calls, fix ORM loading, and verify the result in production.