
Python Application Performance Monitoring with OpenTelemetry
Set up Python application performance monitoring with OpenTelemetry. Measure latency, errors, throughput, and dependency spans across production requests.
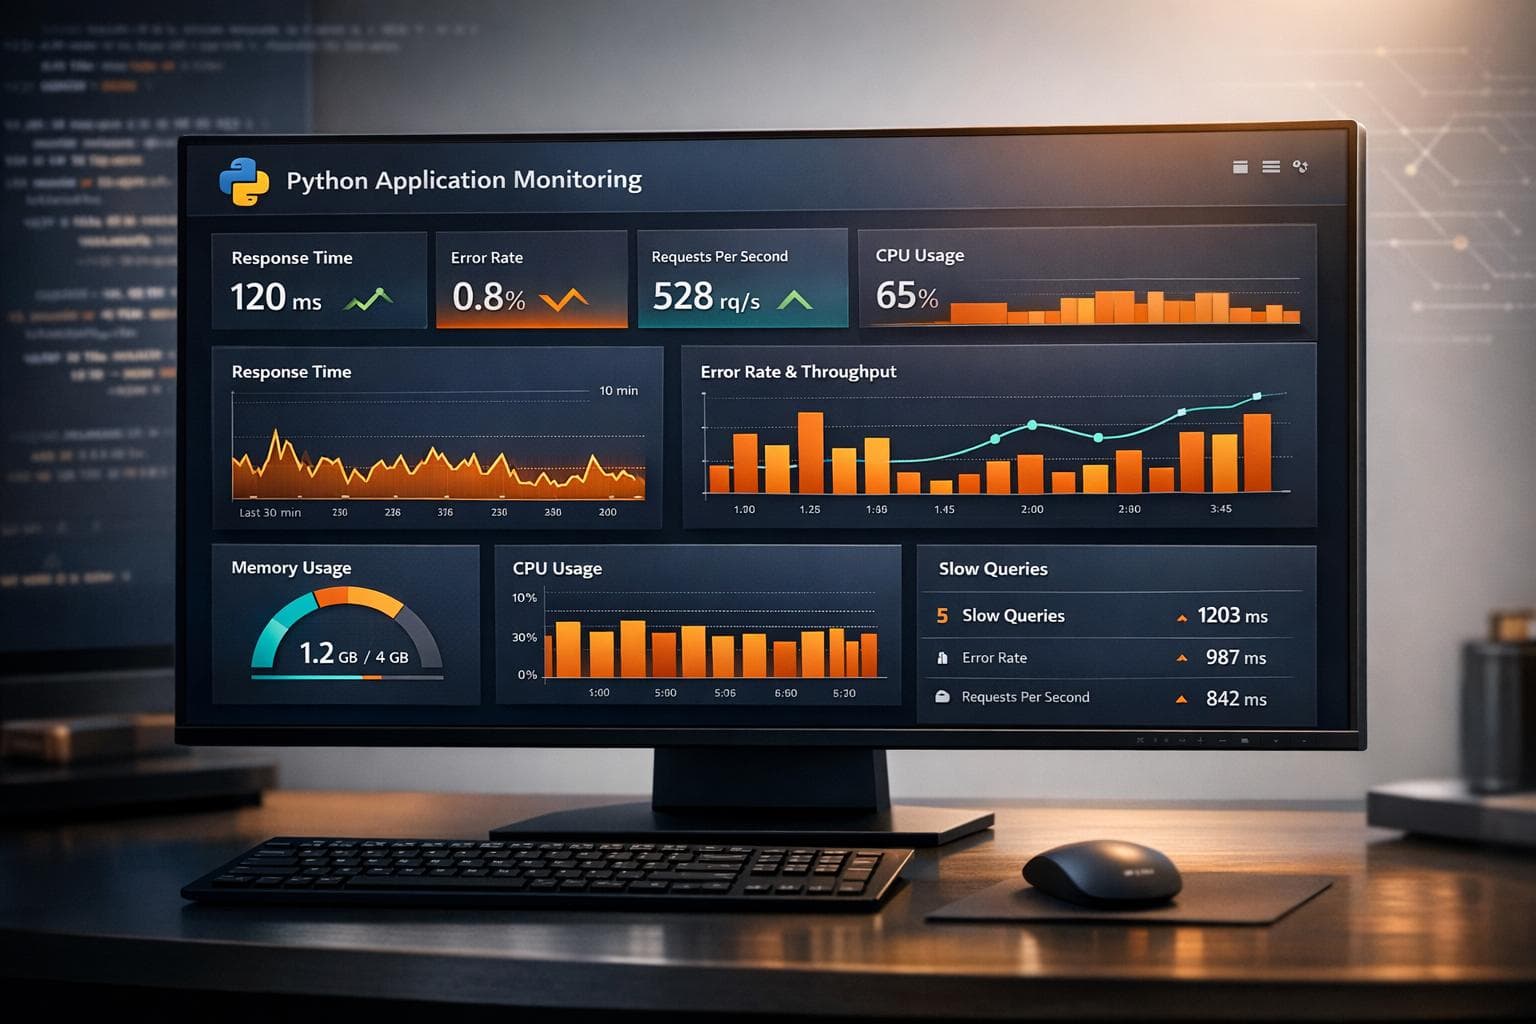
Python application performance monitoring starts with three questions: Which requests are slow, how often do they fail, and where does the time go? Use request metrics to find a problem. Use a trace to inspect one affected request. Start with one service name and one web framework, then verify the request and its dependencies before you add alerts.
This guide covers Django, Flask, and FastAPI with OpenTelemetry. It shows how to measure latency, errors, and throughput, then verify database and outbound HTTP spans. It also covers trace context, sampling, batching, and failed exports. For a worker or scheduled job, instrument its process and define its own operation names.
What Python performance monitoring should measure
| Signal | Question it answers | First check |
|---|---|---|
| Request duration distribution | Which routes became slow, including the tail? | Compare P95 latency by route and deployment. |
| Request rate | Did traffic change before latency rose? | Compare requests per minute with the usual level. |
| Error rate | Are users seeing failures with the slowdown? | Group failed requests by route and error type. |
| Dependency spans | Is time spent in Python code, SQL, or outbound HTTP? | Open a slow trace and compare child span durations. |
| Worker duration and queue depth | Does work continue after the response? | Instrument the worker and measure its backlog separately. |
OpenTelemetry defines http.server.request.duration as an HTTP server duration histogram. Some Python instrumentation still emits older metric names. Check the names and units in your actual backend before you build a dashboard. The HTTP metric conventions and migration notes explain that difference.
A trace describes one request path. A metric shows a distribution across many requests. Neither is a function-level CPU profile. Use a separate profiler when the trace shows time inside Python code but does not identify the expensive function.
Follow one slow Python request
- Find the affected route and time window from request duration and error metrics.
- Open a slow trace from that route. Check its service name, status, and total duration.
- Compare the database and outbound HTTP child spans. Repeated short queries can matter as much as one slow query.
- If most time has no child span, add a manual span around the relevant business operation.
- If work moves to a queue, inspect a separately instrumented worker. Check trace context across the message boundary.
- Compare the same route before and after a deploy. Keep traffic and sampling changes in mind.
This order separates a slow dependency from slow application code. It also gives the investigation a clear stopping point: one measured cause and one change to test.
Python OpenTelemetry setup at a glance
| Step | Action | Proof that it works |
|---|---|---|
| 1 | Install the OpenTelemetry distribution and OTLP exporter | opentelemetry-instrument is available |
| 2 | Install matching framework and library instrumentation | Supported requests create spans |
| 3 | Set the service name, OTLP endpoint, protocol, and headers | The backend accepts exported spans |
| 4 | Start the application through the OpenTelemetry launcher | One real request creates a server span |
| 5 | Check database and outbound HTTP children | The trace shows the full request path |
| 6 | Add manual spans for important hidden work | Business operations appear by name |
| 7 | Tune sampling only after validation | Useful traces remain available during incidents |
The official Python zero-code instrumentation guide uses a Python agent to instrument supported libraries at runtime. “Zero-code” means no source changes for supported libraries. It does not mean every dependency becomes visible automatically.
1. Install OpenTelemetry for your Python application
Create a clean virtual environment. Then install your application before you run the bootstrap command.
python -m venv .venv
source .venv/bin/activate

pip install -r requirements.txt
pip install opentelemetry-distro opentelemetry-exporter-otlp
opentelemetry-bootstrap -a install
opentelemetry-bootstrap -a install checks installed packages and adds matching instrumentation libraries. The official guide uses Flask as one example. You can also review the OpenTelemetry Python registry before deployment.
Run the bootstrap command again after major dependency changes. A new database driver or HTTP client can need another instrumentation package.
Use explicit packages when repeatable builds matter
The bootstrap command is useful during setup. Production builds still need a locked dependency list.
For example, a FastAPI service can declare these packages directly:
opentelemetry-distro
opentelemetry-exporter-otlp
opentelemetry-instrumentation-fastapi
opentelemetry-instrumentation-requests
opentelemetry-instrumentation-sqlalchemy
Use the packages that match your real framework, clients, and database layer. Do not install every available instrumentation package without a reason.
2. Configure service identity and OTLP export
OpenTelemetry uses resource attributes to identify the service that produced telemetry. Set a stable service.name for each deployable service.
export OTEL_SERVICE_NAME="checkout-api"
export OTEL_RESOURCE_ATTRIBUTES="deployment.environment.name=production,service.version=2026.09.11"
export OTEL_TRACES_EXPORTER="otlp"
export OTEL_METRICS_EXPORTER="otlp"
export OTEL_EXPORTER_OTLP_PROTOCOL="http/protobuf"
The OpenTelemetry SDK configuration defines OTEL_SERVICE_NAME and OTEL_RESOURCE_ATTRIBUTES. It also documents the available sampler settings.
If you send traces to Tracekit, point the standard OTLP HTTP exporter at the trace endpoint:
export TRACEKIT_API_KEY="your_api_key_here"
export OTEL_EXPORTER_OTLP_TRACES_ENDPOINT="https://app.tracekit.dev/v1/traces"
export OTEL_EXPORTER_OTLP_METRICS_ENDPOINT="https://app.tracekit.dev/v1/metrics"
export OTEL_EXPORTER_OTLP_HEADERS="X-API-Key=${TRACEKIT_API_KEY}"
Tracekit accepts OTLP traces and metrics. It does not provide generic log ingestion. The integration overview explains direct OTLP export and the optional SDK path. Setting a metrics endpoint does not create every metric by itself. Confirm which metrics your installed instrumentation emits.
Keep the API key in your deployment secret store. Do not commit it to the repository.
3. Start Django, Flask, or FastAPI with instrumentation
The OpenTelemetry launcher must wrap the real production command. Instrumenting only a local development server leaves a deployment gap.
Flask
opentelemetry-instrument gunicorn "app:app"
Django
opentelemetry-instrument gunicorn "project.wsgi:application"
FastAPI
opentelemetry-instrument uvicorn "app:app" --host 0.0.0.0 --port 8000
Replace each module path with your application path. Put the same environment variables in the process that starts the server.
For framework-specific Tracekit setup, use the Python integration guide. The FastAPI production checklist covers middleware, background tasks, and shutdown behavior.
4. Verify one trace before you build dashboards
Send one known request through a real route. Then confirm the resulting trace contains these facts:
- the expected
service.name - one server span for the incoming request
- the route or operation name
- HTTP status and duration
- one database child span, when the route queries a database
- one client child span, when the route calls another service
- an error status and exception event for a controlled failure
The OpenTelemetry Python exporter guide recommends batched export for normal use. It also documents console exporters for local validation.
Use the console exporter when the backend shows no spans:
OTEL_TRACES_EXPORTER=console opentelemetry-instrument uvicorn "app:app"
If spans appear in the console, application instrumentation works. Check the OTLP endpoint, protocol, headers, TLS, and network path next.
If no spans appear, check the launcher command and installed instrumentation packages first.
5. Confirm dependency coverage
A request span shows that traffic reached the application. Child spans explain where the request spent time.
Check these common boundaries:
| Boundary | Expected evidence | Common gap |
|---|---|---|
| SQL database | query or client span under the request | driver instrumentation is missing |
| Outbound HTTP | client span with remote host and duration | HTTP client package is unsupported or not instrumented |
| Redis | client span under the active request | Redis instrumentation is absent |
| Queue producer | publish span with propagated context | message headers do not include trace context |
| Queue worker | consumer span linked to the producer | the worker starts outside the request context |
OpenTelemetry context propagation keeps parent and child work in one trace. The W3C Trace Context specification defines the standard traceparent and tracestate headers.
Do not assume queue context survives automatically. Verify the producer and consumer as separate processes.
For repeated database calls, use the N+1 query detection guide. It explains how query fan-out appears in a trace.
6. Add manual spans for hidden business work
Automatic instrumentation covers framework and library boundaries. It cannot name every important business operation.
Use a manual span around work that needs its own latency or error evidence:
from opentelemetry import trace

tracer = trace.get_tracer(__name__)


def calculate_shipping(cart):
    with tracer.start_as_current_span("checkout.calculate_shipping") as span:
        span.set_attribute("cart.item_count", len(cart.items))
        return shipping_service.quote(cart)
The official Python instrumentation guide covers tracers, spans, attributes, events, and status.
Use low-cardinality attributes for filtering. Do not attach passwords, tokens, full request bodies, or unbounded user input.
7. Set production sampling deliberately
OpenTelemetry uses parentbased_always_on by default in the general SDK configuration. That default is useful during validation. It can be expensive at high traffic.
After you confirm trace quality, set a probability only when traffic requires it:
export OTEL_TRACES_SAMPLER="parentbased_traceidratio"
export OTEL_TRACES_SAMPLER_ARG="0.25"
This example samples 25 percent of new root traces. A parent-based sampler keeps downstream services aligned with the upstream sampling decision.
Sampling changes evidence availability. Measure trace volume and incident needs before you lower the rate.
8. Add alerts after traces are trustworthy
Start with user-impact signals:
- error rate for critical routes
- P95 latency for important requests
- throughput drops for services that should receive steady traffic
- missing telemetry from active services
An alert should lead to a trace or service view that begins the investigation. If it only says “the app is unhealthy,” improve the signal.
Tracekit supports error-rate, latency, and throughput alert rules. See the alerts guide for current options.
Handle workers and CPU-bound code separately
A web request can finish before a Celery task or another worker starts. Run instrumentation in the worker process too. Check whether its message instrumentation propagates trace context. The OpenTelemetry Python propagation guide describes automatic and manual paths.
If a trace has a long application span without a slow dependency, use a profiler in a controlled setting. Python's profiling documentation explains function-level profiling. Do not present a trace waterfall as proof of CPU time inside one function.
Where Tracekit fits
If your Python application already emits OpenTelemetry data, send OTLP traces directly to Tracekit. You do not need another tracing SDK.
Use the Tracekit Python SDK when you need SDK-only features, such as dynamic logs. Dynamic logs use bounded capture points to collect runtime state without redeploying. They are separate from log ingestion.
Choose one tracing setup owner per process. A full OpenTelemetry distribution and another tracer provider can create duplicate or missing spans.
| Need | Start here |
|---|---|
| Existing OpenTelemetry setup | OTLP direct integration |
| Tracekit Python SDK | Python integration guide |
| Runtime state | Dynamic logs |
| Trace investigation | Distributed tracing |
| Exporter configuration | OTel config generator |
Python OpenTelemetry production checklist
- The application starts through
opentelemetry-instrumentor an equivalent code-based setup. - Each deployable process has a stable
service.name. - The OTLP endpoint, protocol, and authentication header match the backend.
- Request duration, rate, and error metrics use the names and units emitted by this instrumentation.
- One real request creates a server span.
- Database and outbound HTTP work appears as child spans.
- Controlled errors record useful status and exception evidence.
- Queue producers and consumers preserve trace context.
- Each worker process starts its own instrumentation and reports its own duration or backlog.
- Manual spans name important hidden business work.
- Sampling keeps enough traces for incident work.
- API keys and sensitive values stay outside telemetry and source control.
The first goal is not a large dashboard. The first goal is one complete, useful trace from a real Python request.
Related Posts
FastAPI Monitoring with OpenTelemetry in Production
Monitor FastAPI routes with request metrics and OpenTelemetry traces. Check latency, errors, and downstream work before setting alerts.

FastAPI Tracing with OpenTelemetry: A Practical Setup
Set up FastAPI tracing with OpenTelemetry. Connect request, SQLAlchemy, and HTTPX spans, then verify trace context across services.
PHP Observability Checklist for Production Apps
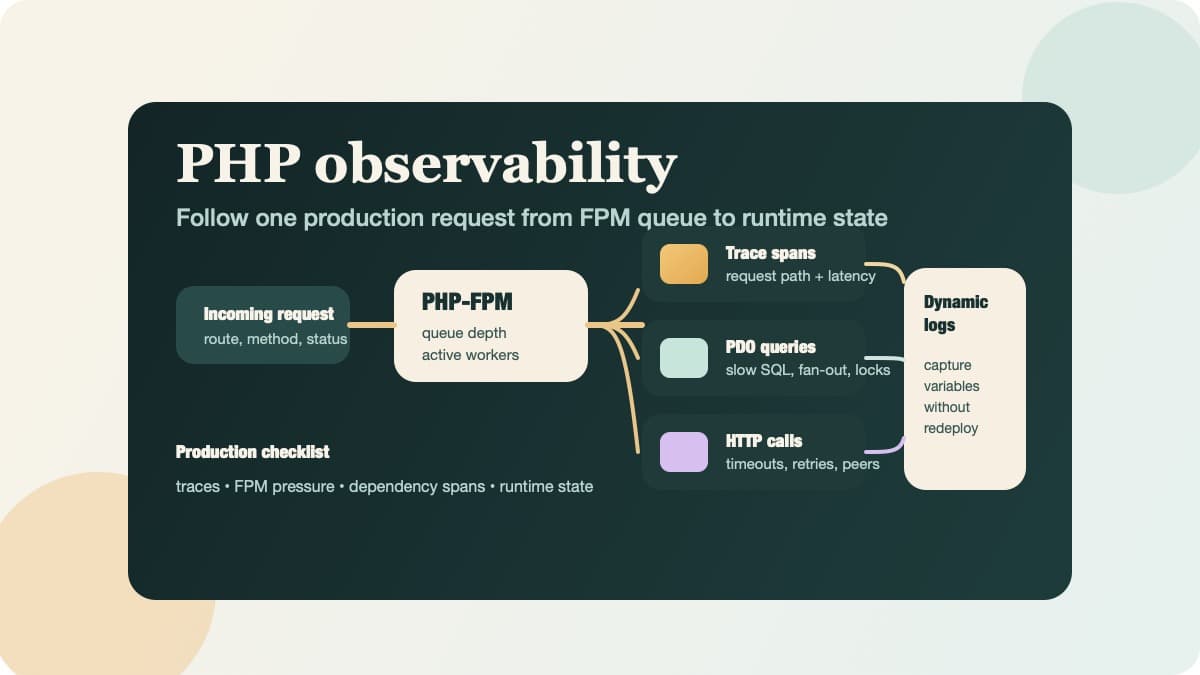
Use this PHP observability checklist to trace requests, surface PDO and HTTP bottlenecks, and inspect runtime state without redeploying.