
Vite Source Maps for Error Tracking
Set up Vite source maps for error tracking so production stack traces point to real files, lines, and functions instead of minified bundles.
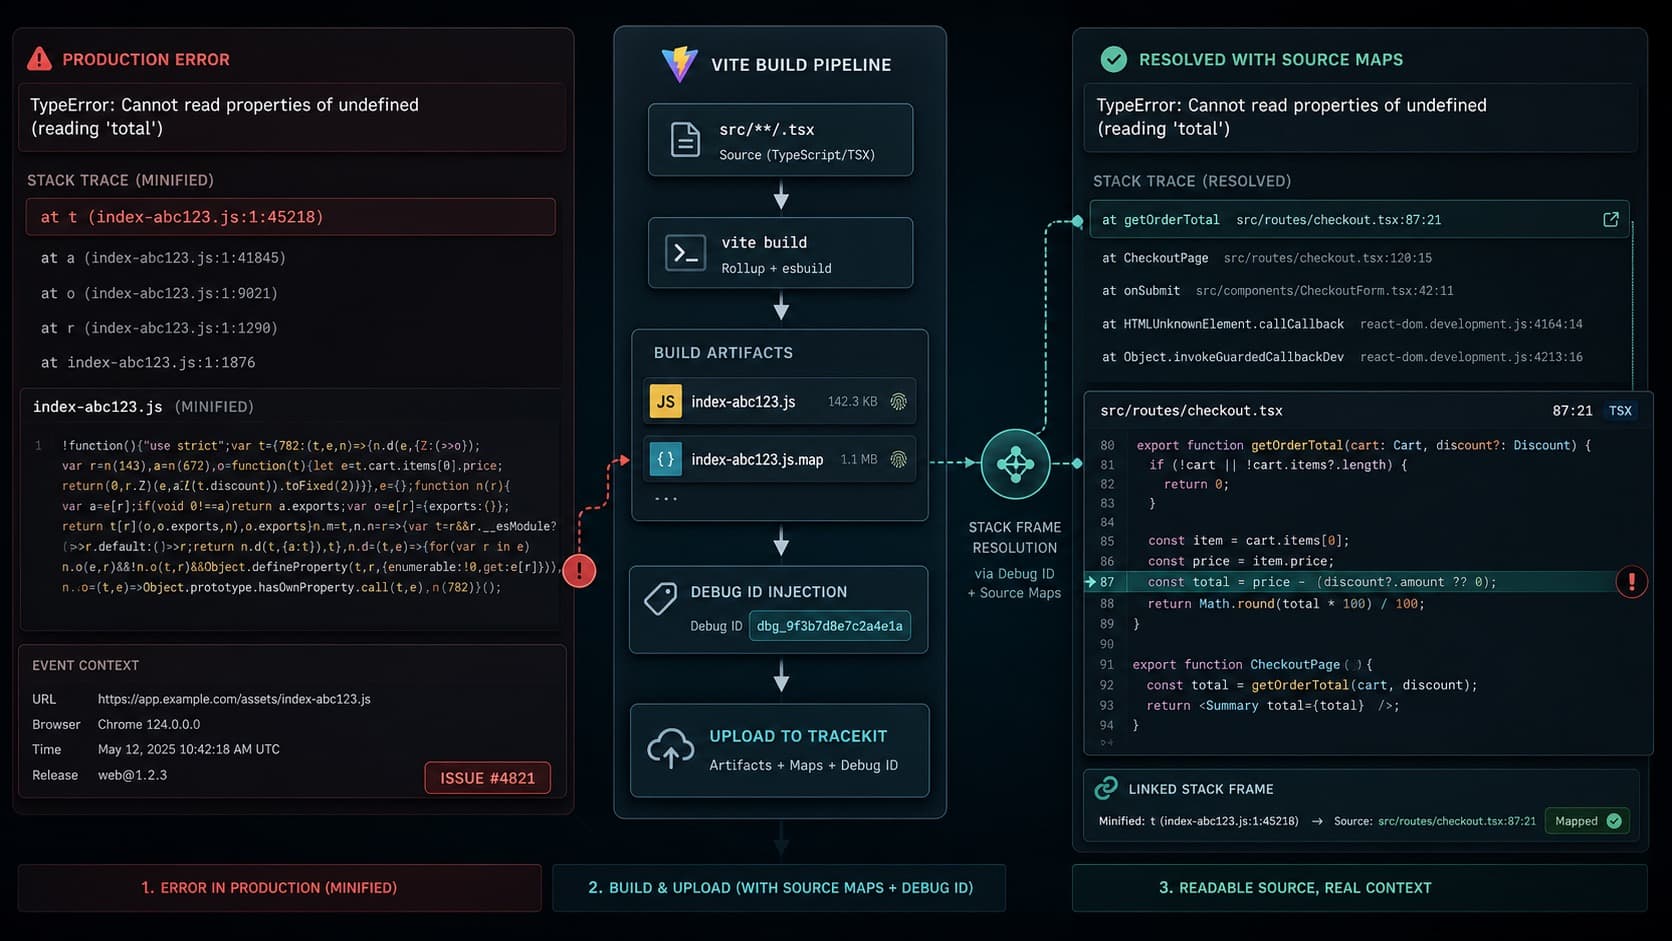
If your Vite app throws a production error and the stack trace points to assets/index-abc123.js:1:45218, you do not have a JavaScript debugging workflow yet. You have a compressed clue. Vite source maps are what turn that clue back into the original file, line number, and function name so an error tracker can show code you can actually fix.
This guide covers the practical setup for Vite source maps for error tracking with Tracekit: how to generate maps during build, how to upload them with the Vite plugin or CLI, how debug IDs make symbolication more reliable, and why teams still end up with minified traces even after they think they turned source maps on.
Tracekit already documents the underlying pieces in the source maps docs, browser SDK docs, and frontend overview. This post is the workflow-focused version for the exact production problem developers search for.
Why Vite Source Maps Matter for Error Tracking
Vite ships optimized production bundles. That is good for users and bad for incident response. The browser runs minified JavaScript, so your error tracker sees line and column numbers in generated files unless you upload matching source maps.
The official Vite build options docs expose this directly through build.sourcemap. The important part is not "source maps exist." The important part is "the same build artifacts you deploy can be matched back to original source."
For error tracking, that changes the debugging loop:
| Without source maps | With source maps |
|---|---|
assets/index-abc123.js:1:45218 | src/routes/checkout.tsx:87:13 |
| Minified function names | Real function names |
| Hard to tell which deploy caused it | Release-aware issue tied to the build |
| Manual guessing in bundles | Click straight into the failing code |
If you also use Tracekit error tracking, source maps make browser issues much easier to correlate with releases, session replay, and browser-to-backend trace context.
The Core Setup
There are four pieces that have to line up:
- Vite must emit
.js.mapfiles during production build. - Tracekit must upload those maps from the same build output.
- Your browser SDK should send a release value when you use release-aware workflows.
- The deployed JavaScript must match the artifacts you uploaded.
Miss any one of those and you are back to minified stack traces.
1. Generate Production Source Maps in Vite
Start with Vite itself:
// vite.config.ts
import { defineConfig } from 'vite';
import { tracekitVitePlugin } from '@tracekit/vite-plugin';

export default defineConfig({
  build: {
    sourcemap: true,
  },
  plugins: [
    tracekitVitePlugin(),
  ],
});
That build.sourcemap line is the first release gate. Tracekit's own docs require it, and the Tracekit Vite plugin code only uploads files it discovers as .js.map output. No emitted maps means nothing gets uploaded.
If you prefer not to keep sourceMappingURL comments in the bundled JavaScript, Vite also supports build.sourcemap: 'hidden' in its official docs. That can be a useful variant when your deployment pipeline uploads maps to Tracekit but does not want those comments exposed in served assets. If you choose that route, verify your CI still preserves the emitted .js.map files long enough to upload them.
2. Upload the Maps With the Tracekit Vite Plugin
For most Vite apps, the simplest path is the build plugin:
npm install -D @tracekit/vite-plugin
// vite.config.ts
import { defineConfig } from 'vite';
import { tracekitVitePlugin } from '@tracekit/vite-plugin';

export default defineConfig({
  build: {
    sourcemap: true,
  },
  plugins: [
    tracekitVitePlugin({
      authToken: process.env.TRACEKIT_AUTH_TOKEN,
      release: process.env.RELEASE_VERSION,
      strict: true,
    }),
  ],
});
From the current Tracekit Vite plugin implementation, the production behavior is:
- It looks for
.js.mapfiles in the Vite output directory. - It generates a UUID debug ID for each JavaScript file and matching source map.
- It injects that debug ID into both files.
- It uploads the source map to
POST /api/sourcemaps. - It only runs when
CI=true.
That last point is easy to miss. If you test locally with npm run build and expect uploads to happen automatically, they will not unless your environment sets CI=true. That is intentional. The plugin is built for CI/CD release workflows, not local builds.
3. Initialize the Browser SDK With a Release
Tracekit's Browser SDK supports a release field. Use it if you want release tracking and cleaner source-map resolution during deploy triage.
// src/main.ts
import { init } from '@tracekit/browser';

init({
  apiKey: import.meta.env.VITE_TRACEKIT_API_KEY,
  release: import.meta.env.VITE_APP_VERSION,
  environment: 'production',
});
Then pass the same value during upload:
tracekitVitePlugin({
  authToken: process.env.TRACEKIT_AUTH_TOKEN,
  release: process.env.RELEASE_VERSION,
})
And make those values match in CI:
RELEASE_VERSION=web@$(git rev-parse --short HEAD)
VITE_APP_VERSION=$RELEASE_VERSION
If you skip explicit releases, Tracekit can still use debug IDs for symbolication. But once you care about regressions, deploy attribution, or cleaning up source maps by release, consistency matters.
4. Use the CLI When the Plugin Is Not the Right Fit
If your pipeline cannot use the Vite plugin, use the CLI after building:
npm run build
tracekit sourcemaps upload ./dist --release "$RELEASE_VERSION"
This path is documented in the CLI docs and source maps docs. It is useful when:
- you use a custom deployment system
- you need separate build and upload steps
- you want to control exactly when uploads happen
- you are testing the upload path before adopting the plugin
The CLI also handles debug ID injection during upload, so you do not need a separate "inject" command.
A Practical CI Example
For a Vite app deployed from GitHub Actions, the release flow should look roughly like this:
- name: Install dependencies
  run: npm ci

- name: Build web app
  env:
    CI: "true"
    RELEASE_VERSION: web@${{ github.sha }}
    VITE_APP_VERSION: web@${{ github.sha }}
    TRACEKIT_AUTH_TOKEN: ${{ secrets.TRACEKIT_AUTH_TOKEN }}
  run: npm run build
With the plugin configured, that single build step emits the source maps, injects debug IDs, and uploads them. If you prefer the CLI route, split it into separate build and upload steps.
Why Debug IDs Matter
Older source-map workflows depended heavily on filenames, path prefixes, or public map hosting. That breaks down quickly once you add cache-busted assets, CDNs, post-processing, or multiple deploy environments.
Tracekit's current source-map workflow uses debug IDs instead. The docs describe the flow clearly:
- A unique debug ID is injected into the built JavaScript file.
- The same ID is written into the matching
.js.map. - The browser SDK reads debug IDs from loaded scripts.
- Tracekit matches the incoming error to the uploaded source map by debug ID.
That design is aligned with the ECMA-426 source map standard and mirrors the direction other vendors have taken with debug-ID-based symbolication.
The practical benefit is simple: matching becomes tied to the actual transformed artifact, not to a fragile filename convention.
The 5 Most Common Reasons Vite Errors Stay Minified
These are the failure modes I would check first.
1. build.sourcemap was never enabled
This is the most common one. The upload plugin does not generate source maps for you. Vite has to emit them first.
2. The upload ran against different artifacts than the deploy
If you build once, upload once, then rebuild before deploy, the debug IDs and asset hashes can drift. Upload the exact build output you ship.
3. The Vite plugin never ran in CI
Tracekit's Vite plugin checks process.env.CI !== "true" and exits on local builds. If your CI provider does not set CI=true, or you override it, uploads will silently stop.
4. The release value is inconsistent
If your browser SDK uses web@abc123 and your upload uses 1.0.0, you have made deploy triage harder than it needs to be. Pick one release format and use it everywhere.
5. You exposed or deleted the maps at the wrong time
If you do not want public source-map access, do not rely on public hosting as your primary workflow. Upload the maps to Tracekit first. After that, keep them private in CI artifacts or remove them from the deploy payload, depending on how your hosting platform works.
Recommended Tracekit Setup for Vite Teams
For most teams, this is the practical baseline:
| Need | Recommended setup |
|---|---|
| Browser error capture | @tracekit/browser |
| Automatic source-map upload | @tracekit/vite-plugin |
| Release-aware debugging | release in SDK init plus matching upload release |
| CI fallback | tracekit sourcemaps upload |
| Frontend investigation | session replay, error tracking, and source maps together |
That stack gives you readable browser stack traces without turning your deployment workflow into a maze of path rewrites and manual artifact matching.
Quick Vite Source Maps Checklist
- Enable
build.sourcemapinvite.config.ts. - Install
@tracekit/vite-pluginor add the CLI upload step. - Make
TRACEKIT_AUTH_TOKENavailable in CI. - Upload source maps from the exact build artifacts you deploy.
- Set a stable browser SDK
releasevalue if you use release tracking. - Confirm the upload succeeded before shipping the deploy.
- Avoid relying on public
.maphosting unless that is an explicit choice.
Final Takeaway
Vite source maps for error tracking are not a nice-to-have. They are the difference between a 5-minute fix and an hour spent reading minified bundles under pressure.
If you are already using Vite, the shortest reliable path is:
- enable
build.sourcemap - add
@tracekit/vite-plugin - set
CI=trueandTRACEKIT_AUTH_TOKENin your pipeline - keep your
releasevalue consistent
Once that is in place, Tracekit can resolve production browser errors back to the code your team actually wrote.
Related Posts
Sentry Go SDK Advanced Configuration Guide
Configure the Sentry Go SDK for trace sampling, releases, environments, breadcrumbs, event filtering, request scope, and reliable delivery.

Sentry vs TraceKit: Error Tracking vs Full Debugging
Sentry vs TraceKit compared: error tracking vs full production debugging. Feature-by-feature comparison with pricing, setup time, and use case guidance.

How to Debug User Behavior in Production Apps
Debug user behavior in production apps with session replay, frontend errors, backend traces, privacy controls, and targeted runtime state.