
5 min
Monitoring and Alerting with Node.js: A Practical Setup
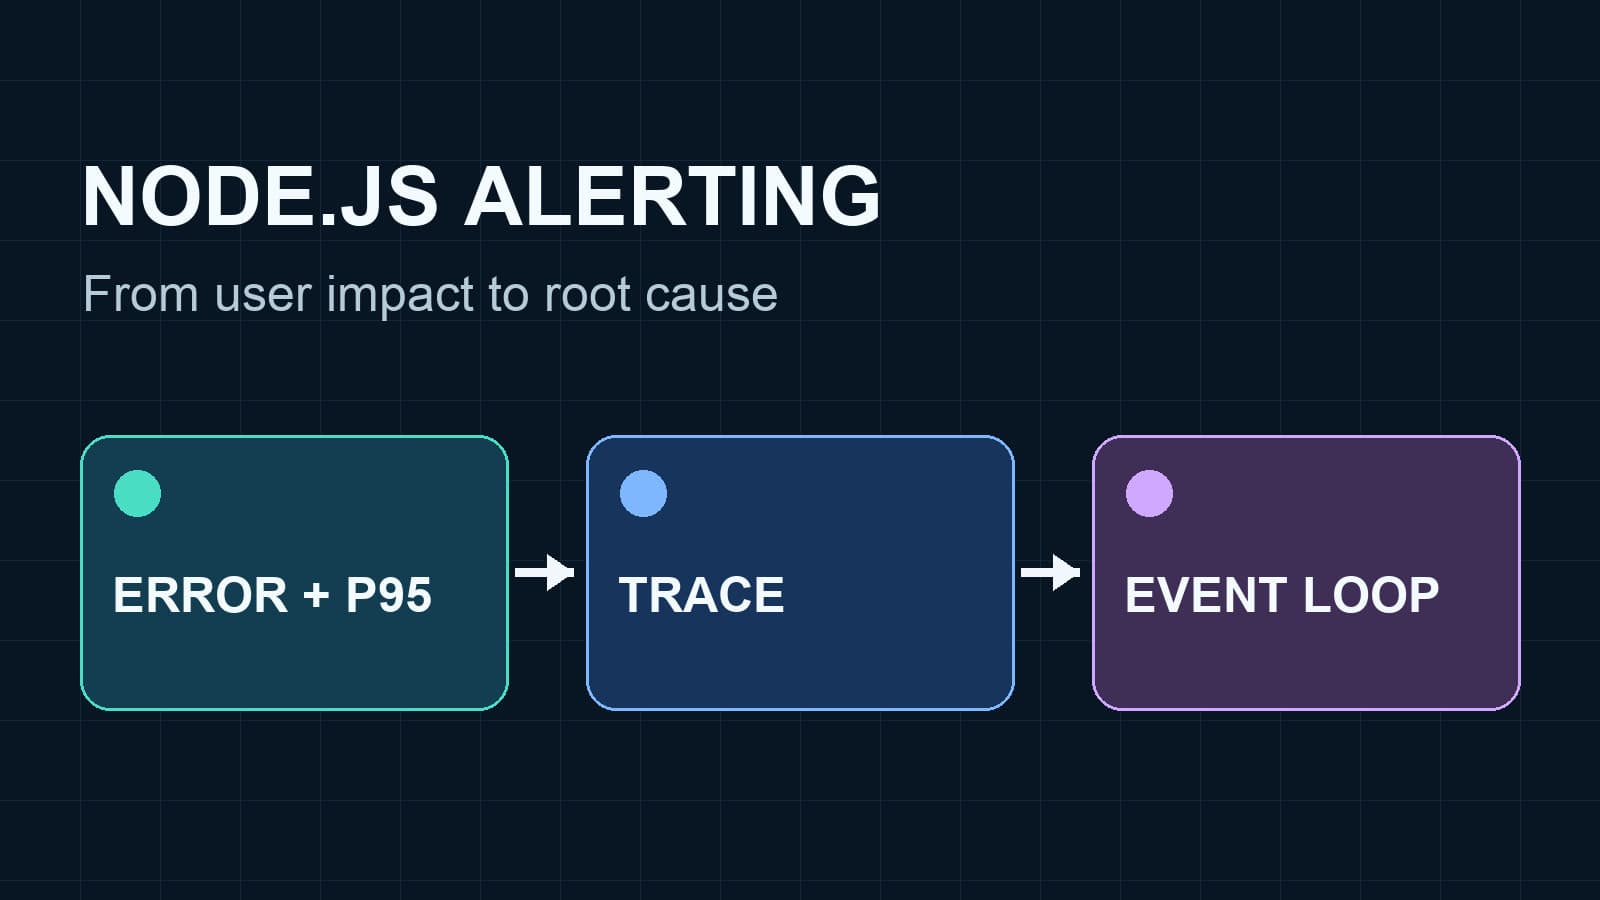
Set up Node.js monitoring and alerting around errors, slow requests, traffic, and event loop health without creating noisy pages.
nodejsalerting
Set up Node.js monitoring and alerting around errors, slow requests, traffic, and event loop health without creating noisy pages.
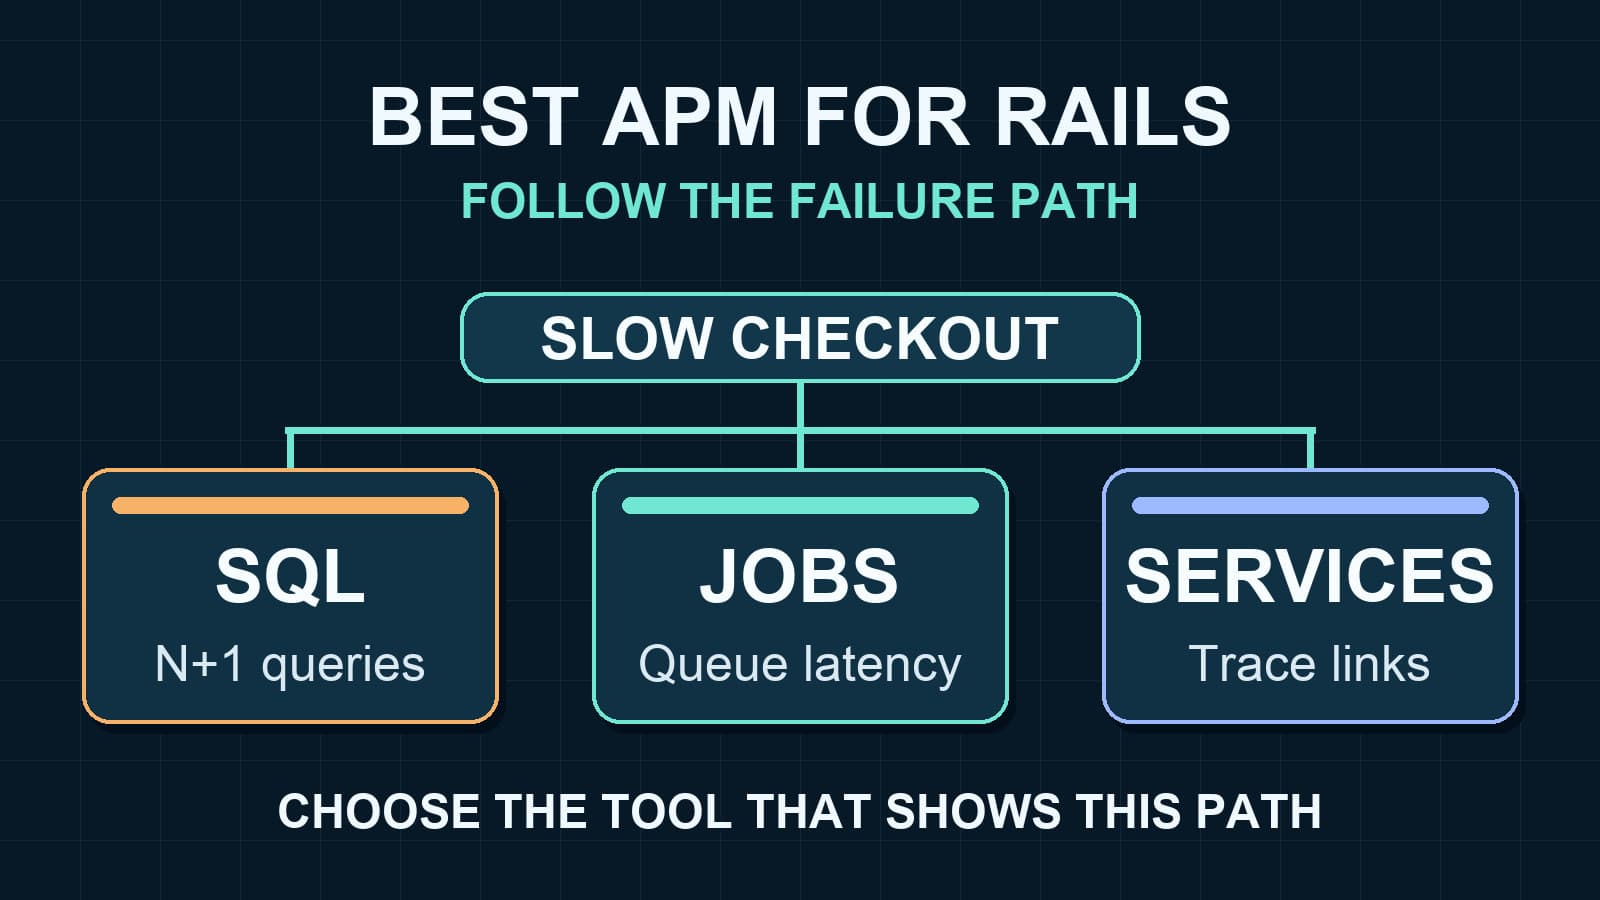
Compare Rails APM tools for slow SQL, jobs, requests, and cross-service traces. Use a short trial to choose the evidence your team needs.
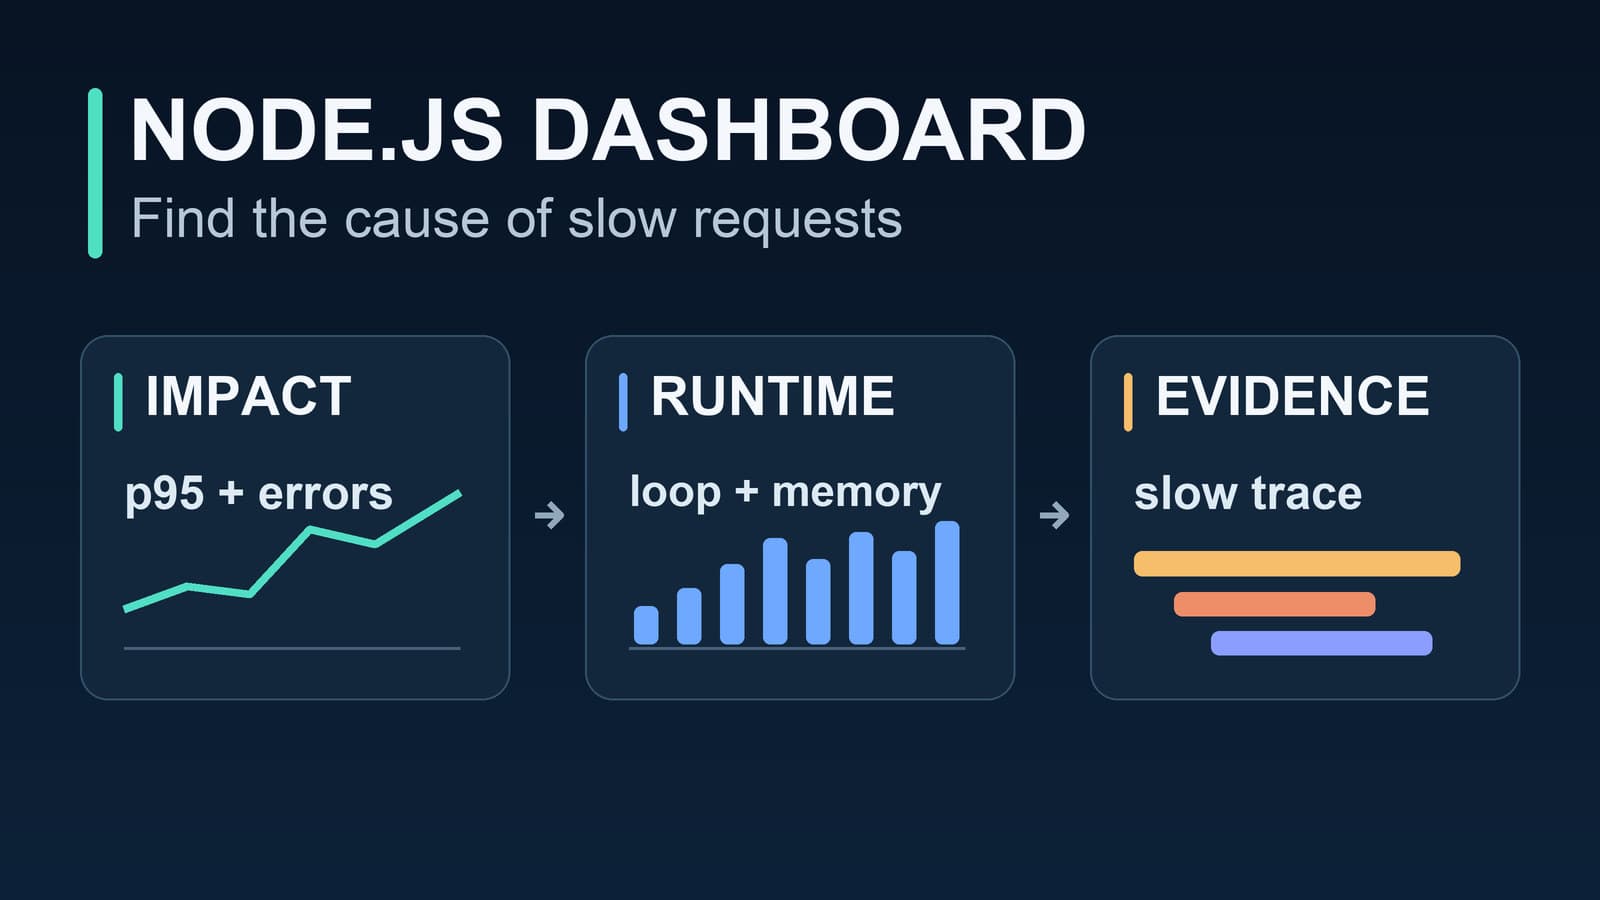
Build a Node.js monitoring dashboard with eight panels that connect request impact, event loop health, memory, and slow traces.
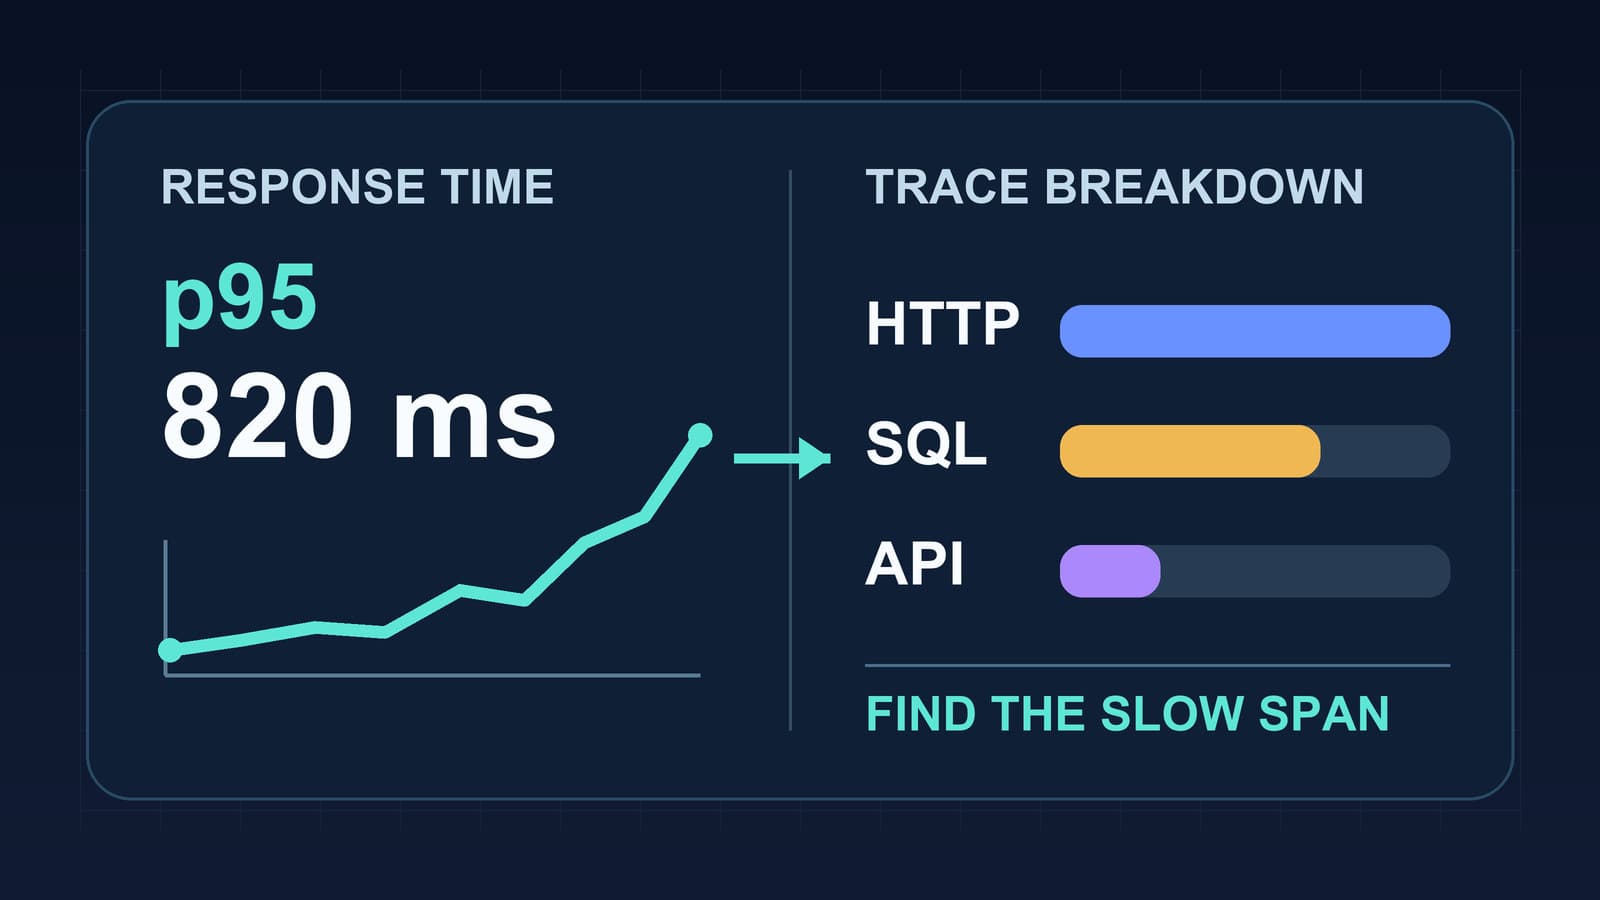
Measure Node.js response time by route, read p95 latency with traces, and separate event loop delays from database and API waits.
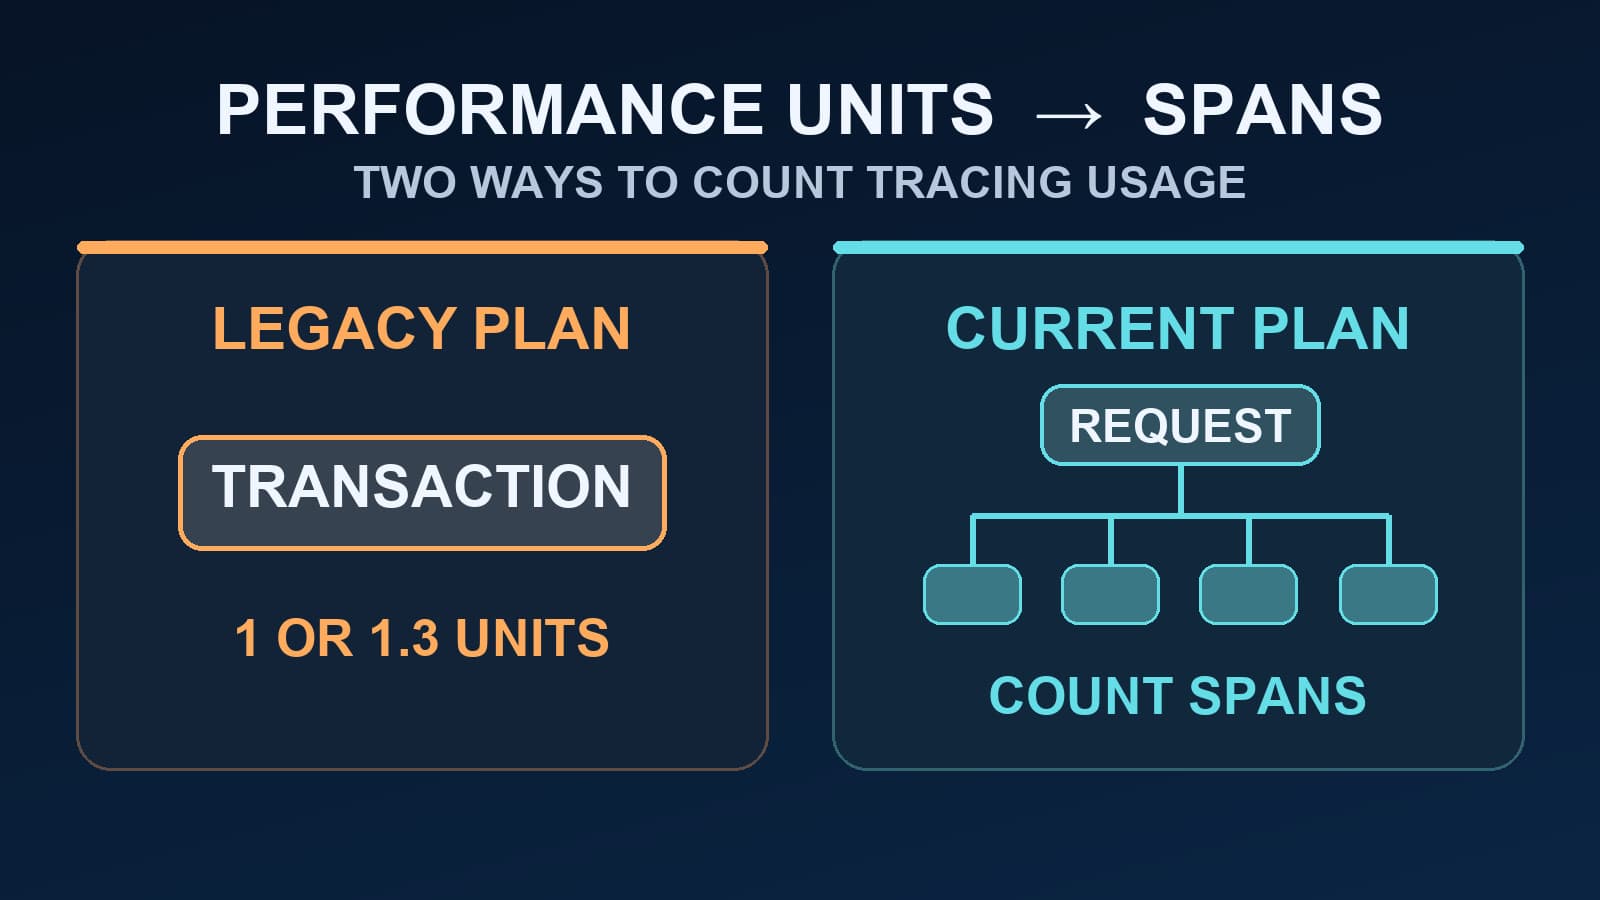
Learn when Sentry performance units still apply, how legacy transactions were counted, and why current span quotas need a different estimate.
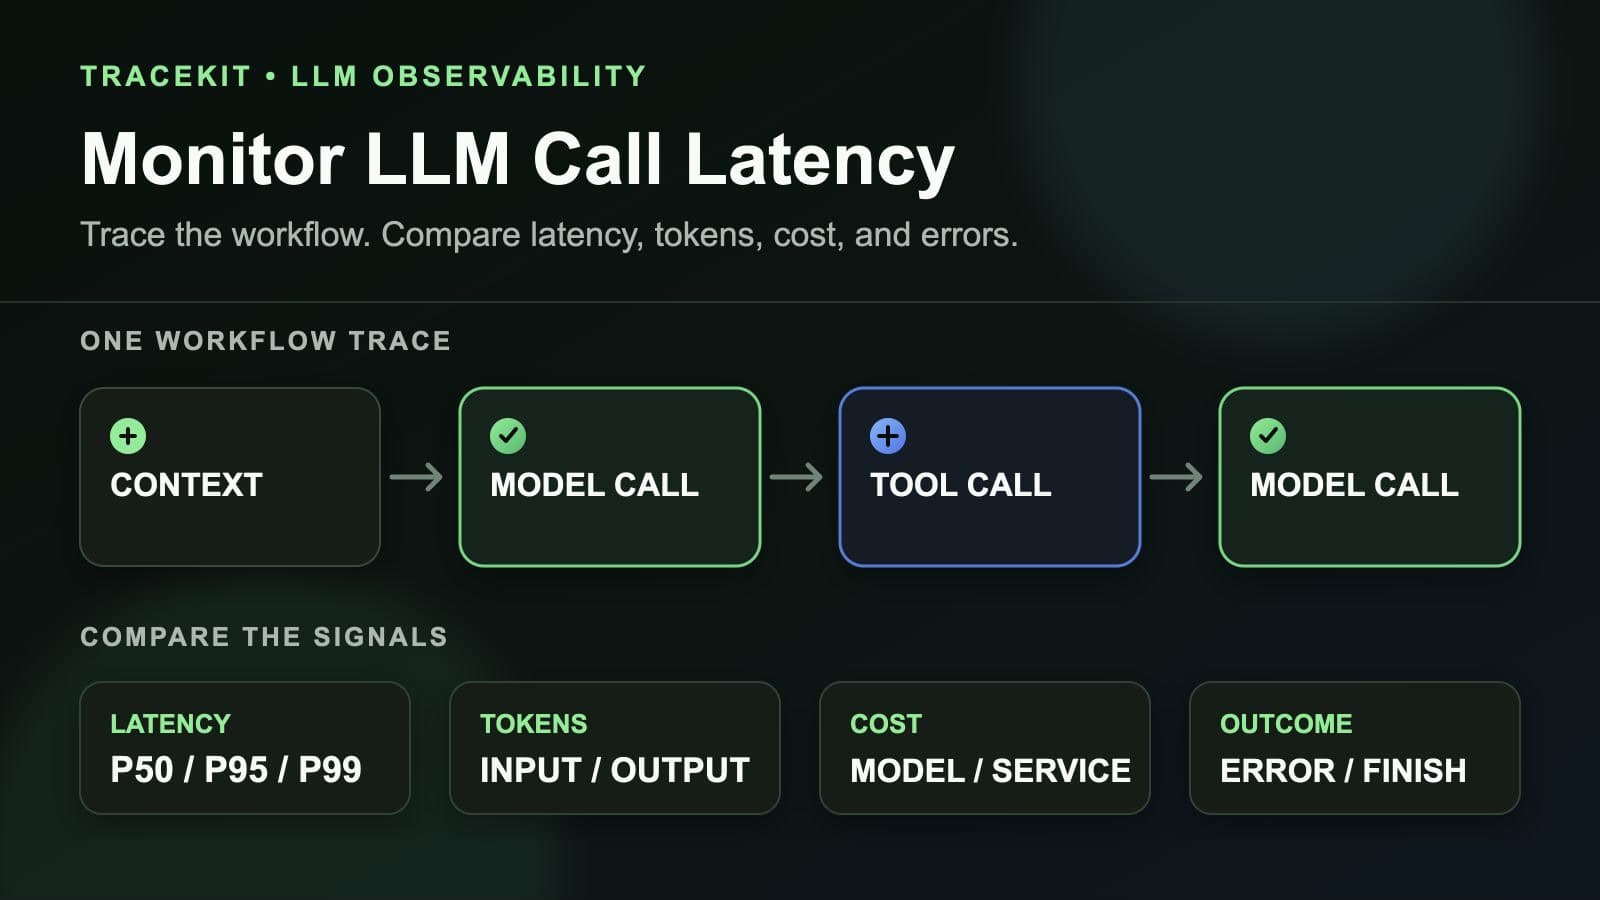
Monitor LLM call latency in production workflows with traces, model percentiles, token usage, costs, errors, and workflow context.
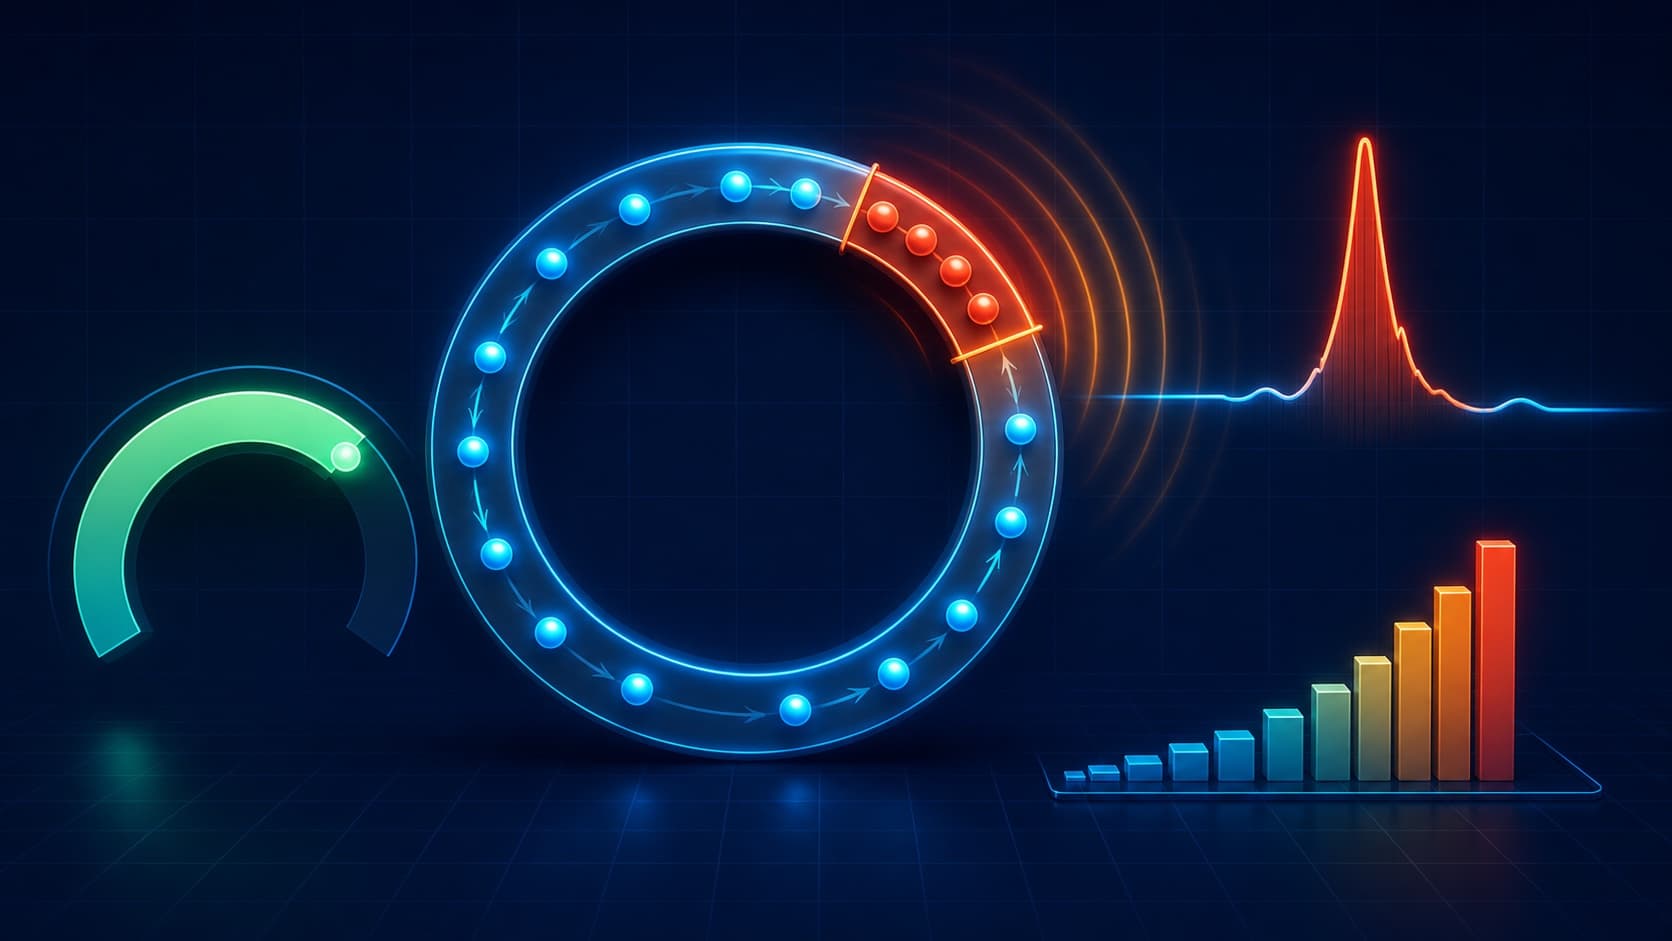
Use Node.js monitorEventLoopDelay and eventLoopUtilization to measure event-loop lag, export useful metrics, and debug blocking production code.
Your API threw a 500 at 3 AM. A systematic approach to diagnose, trace, and fix production API errors without the panic and guesswork.
Get production visibility without the Datadog bill. Free-tier APM setup with OpenTelemetry for freelancers and small teams who need traces, not invoices.
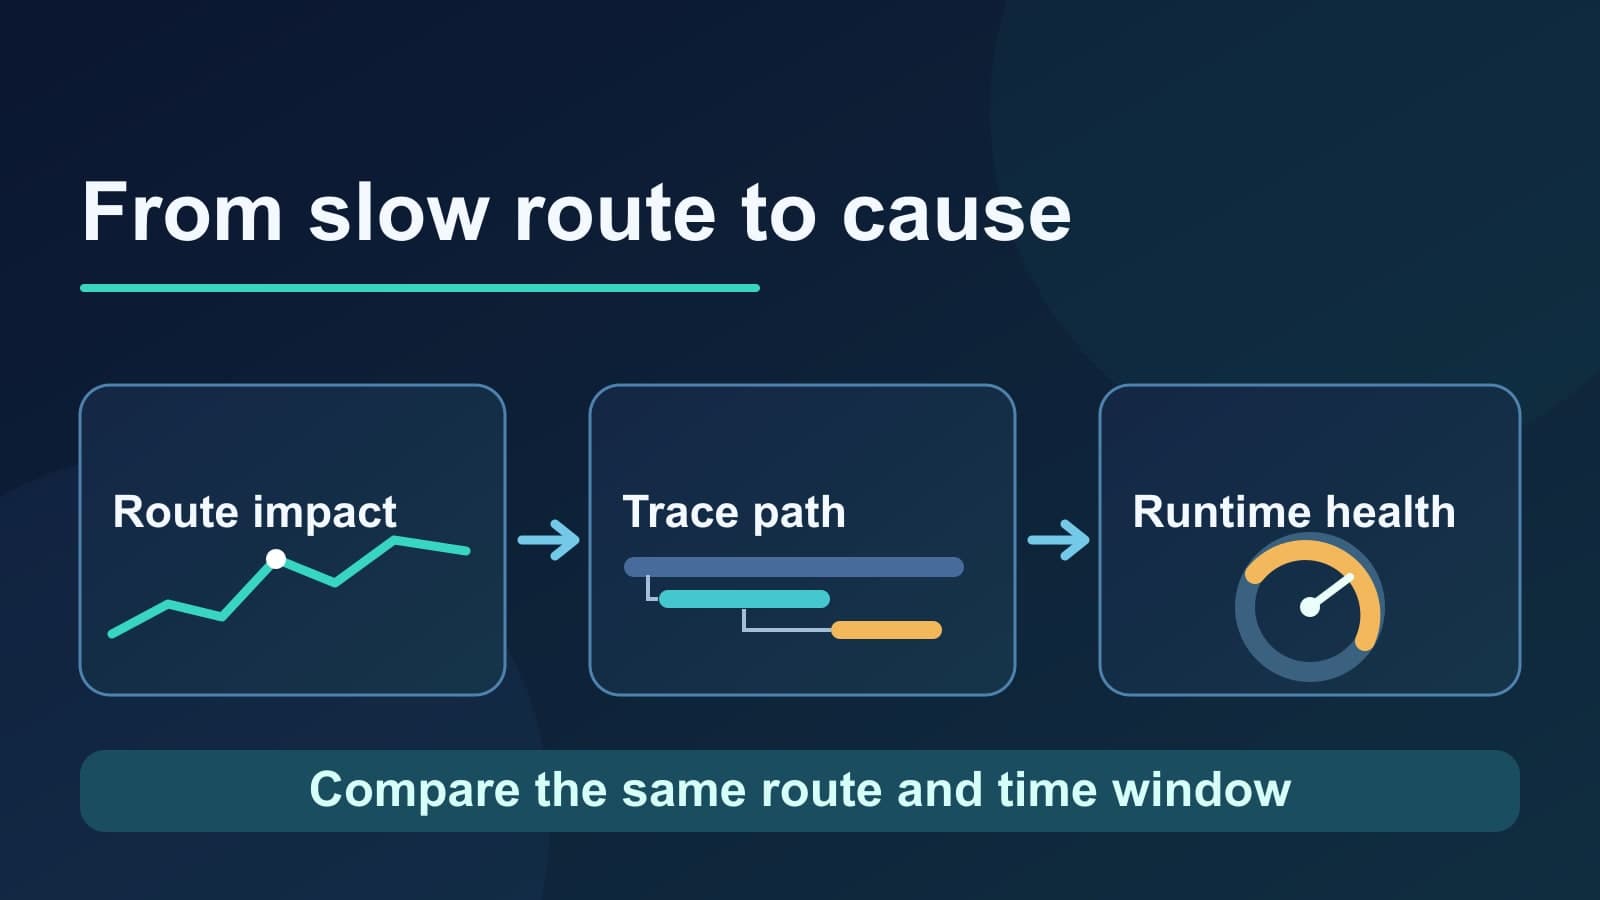
Set up Node.js application performance monitoring with route latency, event loop metrics, traces, and a clear test for missing coverage.
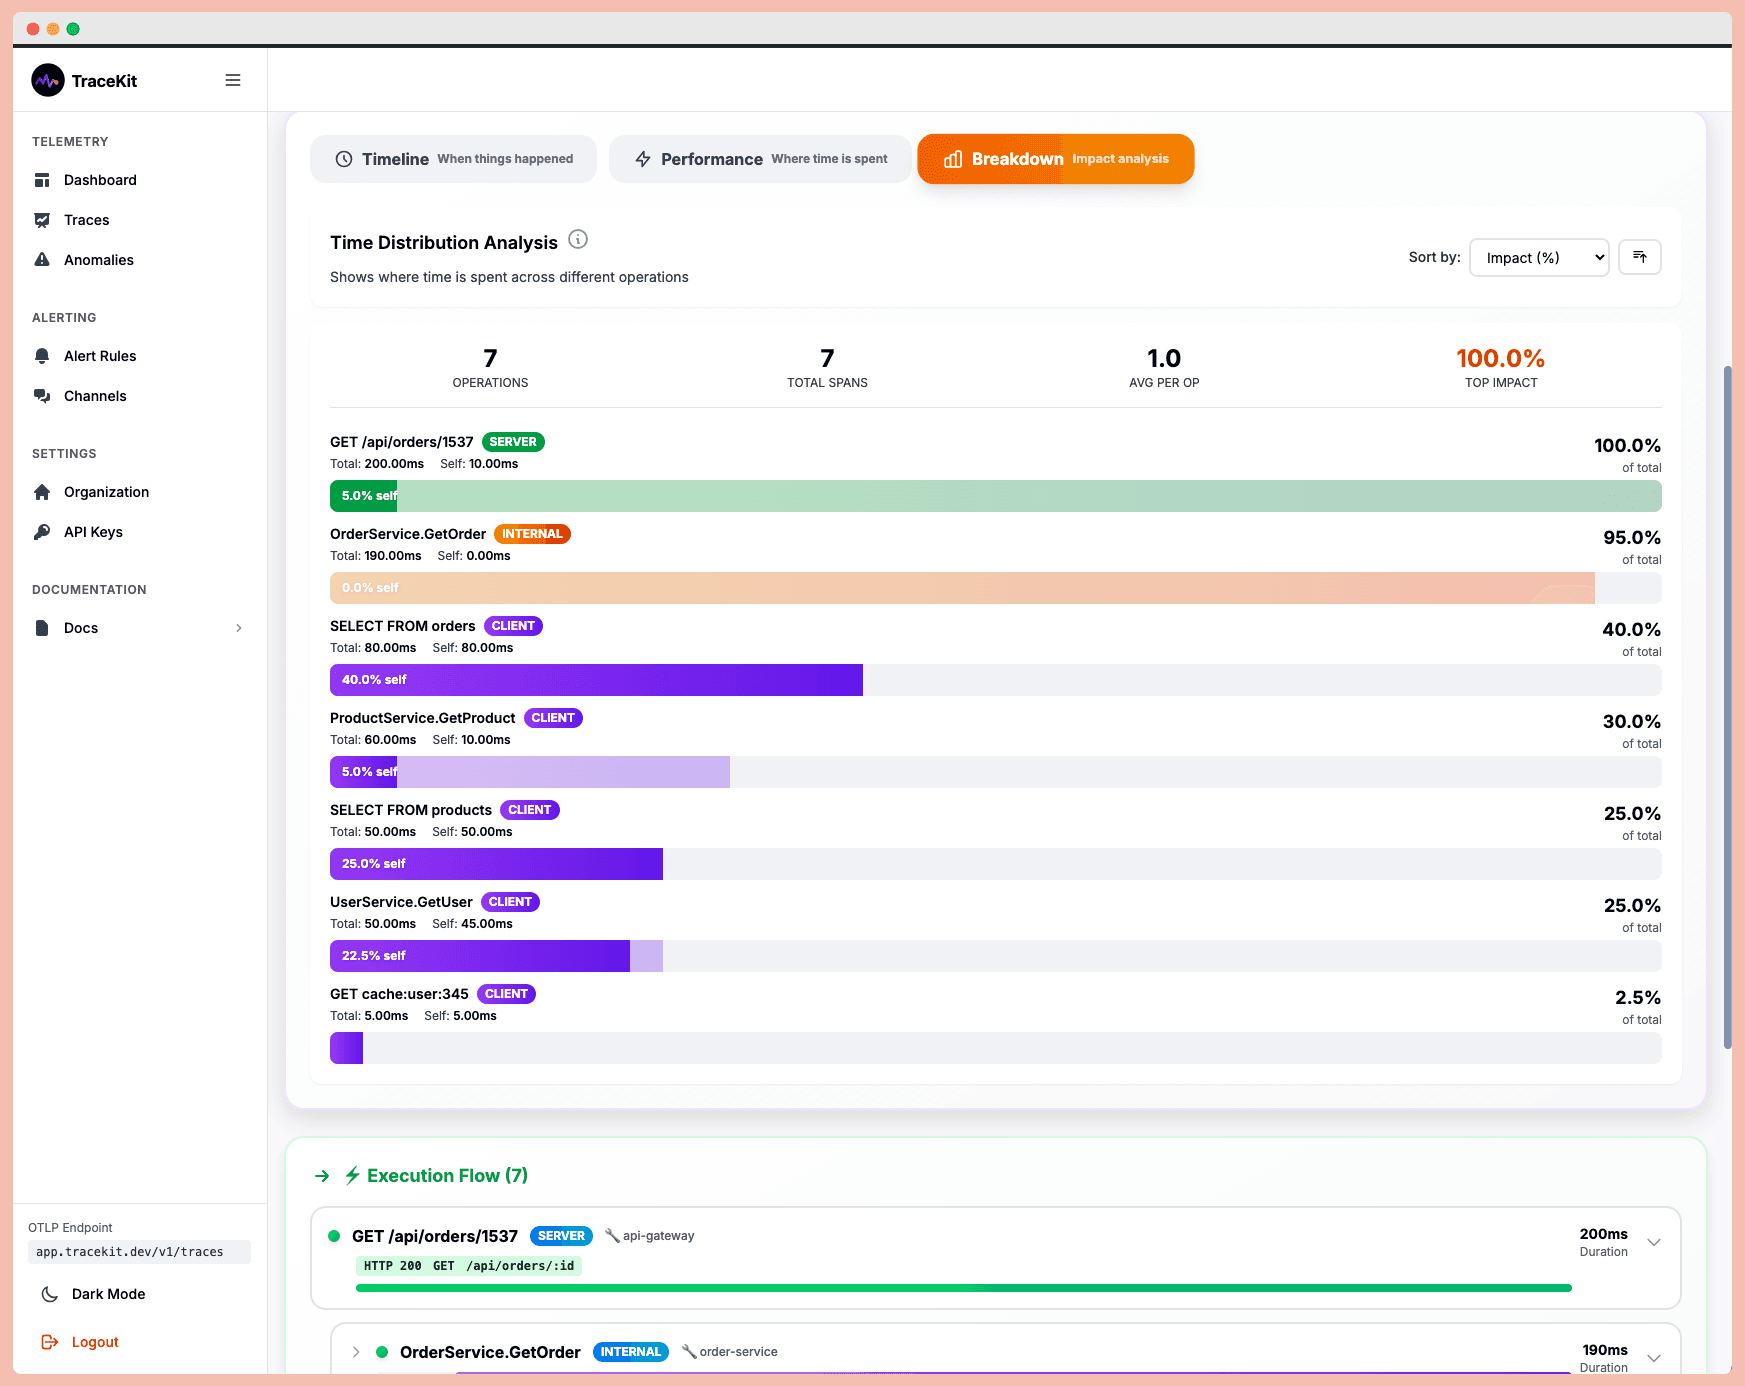
Debug production issues 10x faster with distributed tracing. Track requests across microservices, find bottlenecks, and resolve errors without log diving.