
Node.js Application Performance Monitoring Guide
Use Node.js application performance monitoring to connect request traces, event loop health, dependencies, releases, and runtime state.
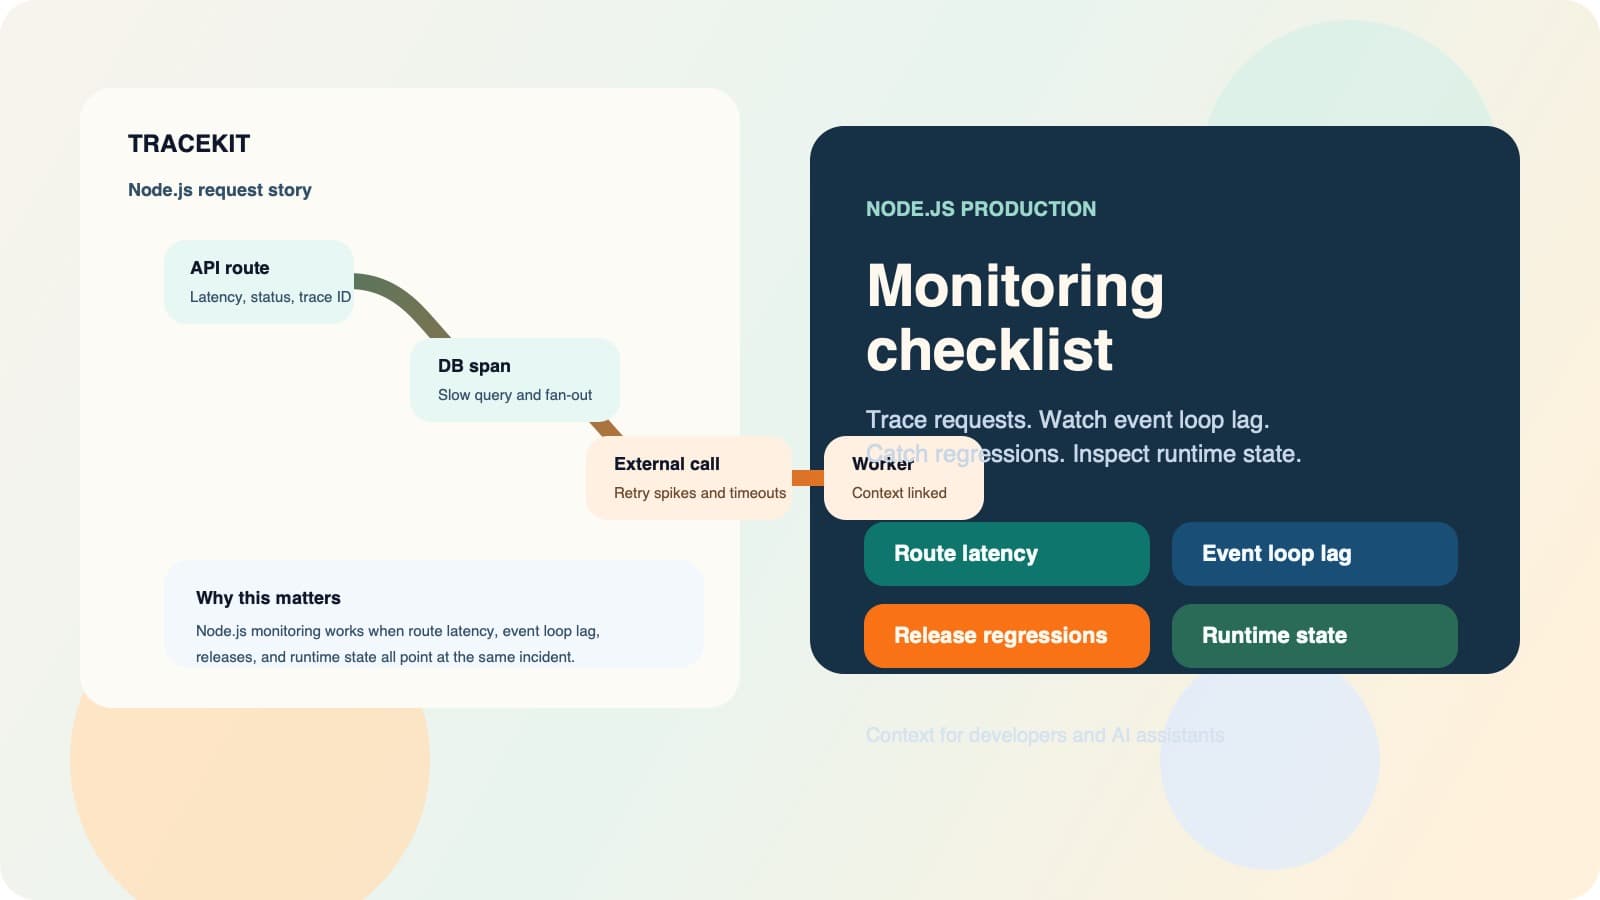
Node.js application performance monitoring should connect a slow request to its route, event loop health, database work, outbound calls, release, and runtime state. A response-time chart alone cannot show which part failed. A complete setup gives the responder a short path from symptom to cause.
This guide gives you a production checklist for Node.js APM. It covers request traces, event loop delay, memory, async work, releases, alerts, and targeted runtime inspection. It also explains when to use metrics, traces, or a CPU profile.
What Node.js Application Performance Monitoring Must Answer
A useful APM setup should answer these questions during an incident:
| Production question | First signal | Evidence you need next |
|---|---|---|
| Which route is slow? | Route p95 or p99 latency | A slow trace from that route |
| Is Node.js blocked? | Event loop delay and utilization | CPU profile or synchronous code path |
| Is a dependency slow? | Database or client span duration | Query, target service, status, and retry count |
| Did a deploy cause this? | Release marker and error change | First bad release and affected traces |
| Does one input trigger it? | Trace attributes and grouped failures | Safe runtime state from the failing path |
| Is async work disconnected? | Missing queue or worker spans | Propagated context or an explicit span link |
The core rule is simple. Start with a user-facing symptom. Then follow one connected request through the system.
1. Start Tracing Before Application Imports
Node.js instrumentation often patches modules when they load. If your HTTP, database, or framework modules load first, the tracer can miss them.
Use a small preload file for instrumentation:
// instrumentation.ts
import * as tracekit from '@tracekit/node-apm'

export const client = tracekit.init({
  apiKey: process.env.TRACEKIT_API_KEY!,
  serviceName: 'checkout-api',
  enableCodeMonitoring: true,
})
Use a bootstrap file that loads instrumentation before the application entry point:
// bootstrap.ts
import './instrumentation.js'

await import('./server.js')
Start the compiled bootstrap file:
node ./dist/bootstrap.js
Then add the Tracekit middleware before your routes:
import express from 'express'
import * as tracekit from '@tracekit/node-apm'

const app = express()
app.use(tracekit.middleware())

app.get('/orders/:id', async (req, res) => {
  res.json(await loadOrder(req.params.id))
})
The current Node.js and TypeScript guide documents incoming HTTP, outgoing HTTP, PostgreSQL, MySQL, MongoDB, and Redis instrumentation. Confirm each important dependency appears in a trace before you trust the setup.
OpenTelemetry recommends the same early-loading pattern for instrumentation libraries. Its JavaScript instrumentation guide also explains why ESM applications need a loader or preload hook.
Verify the first trace
Send one request that calls a database and another service. Check these items:
- The server span uses a stable route name, such as
GET /orders/:id. - The trace includes database and outbound HTTP child spans.
- The status and duration match the request.
- The downstream service uses the same trace ID.
- The service name and environment separate production from test data.
Do this test after every instrumentation change. A clean dashboard can hide missing spans.
2. Monitor the Event Loop as a Distribution
Node.js handles many requests on one event loop. Long synchronous work can delay unrelated requests, even when average CPU looks acceptable.
Track both event loop delay and event loop utilization:
- Event loop delay shows how late scheduled work runs.
- Event loop utilization shows the share of time the loop stays active.
- Route latency shows whether users feel the effect.
The official Node.js perf_hooks API provides monitorEventLoopDelay() and performance.eventLoopUtilization(). Delay values use nanoseconds, so convert them before export.
The current Tracekit Node SDK exposes counter, gauge, and histogram metrics. This example records a one-minute interval:
import { monitorEventLoopDelay, performance } from 'node:perf_hooks'
import { client } from './instrumentation.js'

const delay = monitorEventLoopDelay({ resolution: 20 })
const delayP95 = client.histogram('nodejs.event_loop.delay', { unit: 'ms' })
const utilization = client.gauge('nodejs.event_loop.utilization')

let previous = performance.eventLoopUtilization()
delay.enable()

setInterval(() => {
  const current = performance.eventLoopUtilization(previous)
  previous = performance.eventLoopUtilization()

  delayP95.record(Number(delay.percentile(95)) / 1e6)
  utilization.set(current.utilization)
  delay.reset()
}, 60_000).unref()
Do not use one universal alert threshold. Establish a normal range for each service and workload. Then alert on sustained changes that align with user-facing latency.
For a deeper event loop method, use the Node.js monitorEventLoopDelay and eventLoopUtilization guide.
3. Use Metrics, Traces, and Profiles for Different Questions
These signals do different jobs. Do not expect one signal to replace the others.
| Signal | Best question | Example |
|---|---|---|
| Metric | Is the problem broad or sustained? | Route p99 rose after 14:00 |
| Trace | Which operation consumed the time? | One SQL span used 780 ms |
| CPU profile | Which functions used CPU? | JSON transformation dominated samples |
| Heap profile | What keeps memory alive? | Cached objects remain after requests |
| Dynamic log | Which runtime value selected the bad path? | One tenant flag enabled extra retries |
Tracekit displays timed trace spans. It does not currently collect continuous CPU profiles. Use Node.js profiling tools when trace timing points to CPU work inside one span. The official Node.js profiling guide explains the built-in V8 profiler.
This distinction prevents a common error. A wide trace span shows elapsed time. It does not prove which function used CPU during that time.
4. Connect Database and Outbound Work to Routes
A service-wide database chart can show a problem. It cannot show which route caused it.
For each important route, inspect:
- database span duration and operation
- repeated queries inside one request
- outbound target, status, and duration
- retry attempts and backoff time
- cache misses that create extra work
- total child-span time compared with server-span time
If one route creates 101 similar queries, investigate an N+1 pattern. The N+1 query regression guide shows how to compare trace shape across releases.
If an outbound call dominates the trace, check whether retries happen inside the same request. A successful final status can hide several slow failed attempts.
5. Preserve Context Across Async Boundaries
Node.js APM often breaks at queues, workers, and scheduled jobs. The API request ends, but the actual work continues elsewhere.
Review every boundary:
| Boundary | Context to carry | Measurements to add |
|---|---|---|
| Queue producer and consumer | W3C trace context or an explicit span link | Queue wait, job duration, retries, failure |
| Worker thread | Trace or job identifier | Worker duration, CPU work, memory, error |
| Scheduled task | Stable service and job names | Run duration, missed run, release |
| Outbound retry | Parent context and attempt number | Attempt duration, backoff, final status |
OpenTelemetry instrumentation can propagate context automatically for supported libraries. Manual work is still necessary for unsupported transports or custom payloads. The official OpenTelemetry propagation guide shows how connected services share trace context.
For NestJS, the NestJS tracing guide separates HTTP interceptor coverage from queue and worker instrumentation.
6. Link Errors and Releases to the Same Request
When error rate rises, the responder needs more than an exception message. The investigation should connect these items:
- The grouped failure.
- A representative trace.
- The affected route and dependency.
- The first release that shows the change.
- The owner who can act.
Attach service.version and environment metadata when your deployment process provides them. Keep trace IDs in normal application logs. Tracekit is not a general log-ingestion service, so continue to use your logger for baseline logs.
A useful structured log entry can include:
{
  "level": "error",
  "service": "checkout-api",
  "route": "/orders/:id",
  "trace_id": "7b8f...",
  "span_id": "2a91...",
  "release": "2026.09.16",
  "error_type": "payment_provider_timeout"
}
Trace-linked logs and release markers reduce the time spent asking whether two symptoms belong to the same incident.
7. Inspect Runtime State Only Where Evidence Points
Traces can show the slow path without showing the input that selected it. You might still need a feature flag, tenant setting, payload size, cache key, or retry count.
Tracekit dynamic logs add bounded capture points to the suspicious path. They capture runtime state without a redeploy. They do not pause the process and do not replace normal application logs.
The Node SDK uses the internal method name captureSnapshot():
await client.captureSnapshot('checkout-validation', {
  orderId,
  tenantId,
  itemCount: items.length,
  paymentProvider,
})
Use dynamic logs after traces narrow the search area. Capture only the values needed for the current question. Keep secrets and personal data out of capture payloads.
Read the dynamic logs documentation for setup and safety controls.
8. Alert on User Impact
Start with alerts that describe a user problem:
- sustained p95 or p99 latency by route
- 5xx rate by route
- dependency failures or timeouts
- a sudden traffic loss on an expected route
- a release-linked regression
- sustained event loop delay with matching route latency
Avoid an isolated event loop alert with no request impact. A short spike can be harmless. A useful alert includes the affected route, trace set, dependency, and release.
The Tracekit alert rules guide explains alert configuration. The release tracking guide explains release-aware triage.
A 15-Minute Node.js APM Investigation
Use this order when production latency rises:
- Select the affected route and time window.
- Compare p95 and p99 with request rate and error rate.
- Open one slow trace from the same window.
- Find the longest child span or unexplained server time.
- Compare event loop delay and utilization.
- Check the database, outbound calls, and retries.
- Compare the first bad interval with recent releases.
- Use a CPU profile if the trace points to local CPU work.
- Add a dynamic log if one runtime value remains unknown.
- Record the cause and add a regression check.
This order keeps the investigation evidence-led. It also prevents broad log searches before you know which request matters.
Production Readiness Checklist
- Instrumentation loads before framework, HTTP client, and database modules.
- Important routes create stable server span names.
- Database and outbound calls appear as child spans.
- Queue and worker paths preserve or link context.
- Route p95 and p99 are available.
- Event loop delay and utilization are measured.
- Memory and process restarts are visible.
- Logs include trace IDs where needed.
- Release metadata reaches traces and grouped failures.
- Alerts identify a route, dependency, or release.
- Dynamic logs are available for targeted runtime inspection.
- Sensitive fields stay masked or excluded.
Where Tracekit Fits
Tracekit connects request traces, metrics, grouped failures, releases, alerts, and dynamic logs. This combination helps a small team move from a slow-route alert to evidence from the same request.
Start with the Node.js integration guide. Then verify one complete production-like request. The goal is not more telemetry. The goal is a connected answer to the production question.
Related Posts
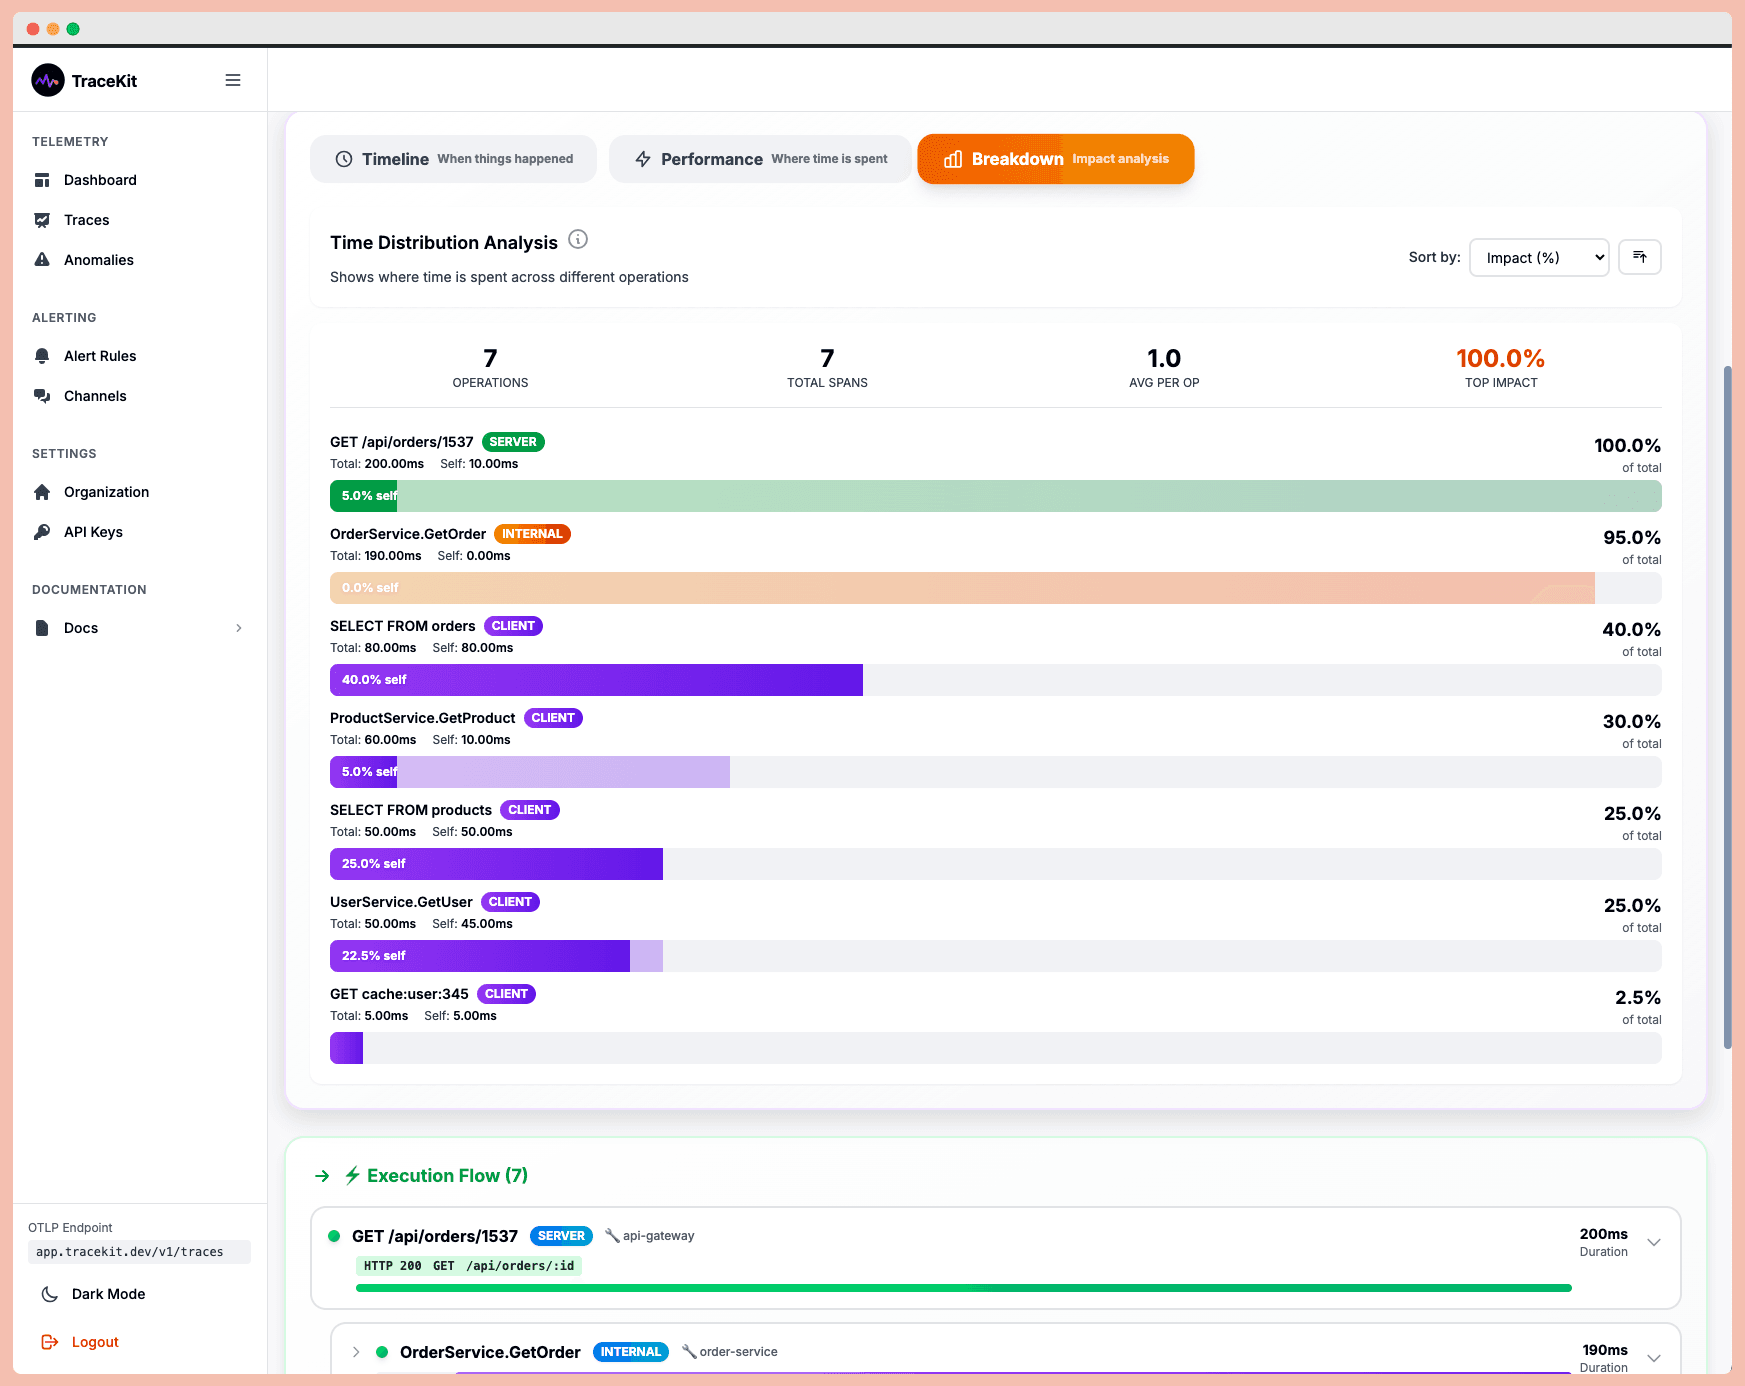
Debug Production Issues 10x Faster with Tracing
Debug production issues 10x faster with distributed tracing. Track requests across microservices, find bottlenecks, and resolve errors without log diving.
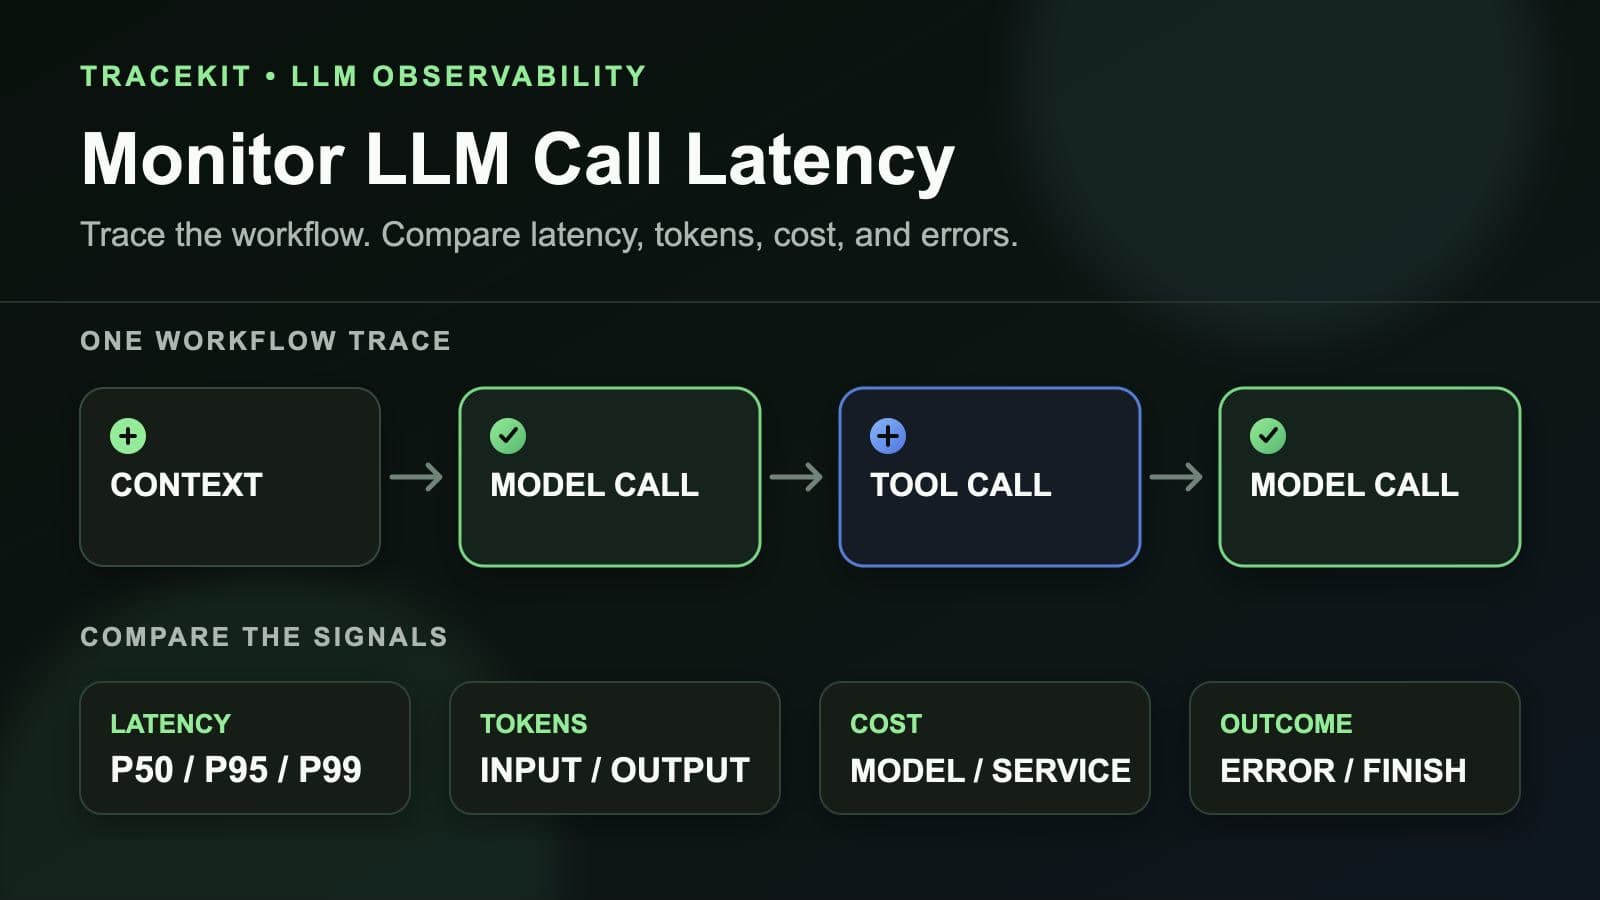
How to Monitor LLM Call Latency in Production Workflows
Monitor LLM call latency in production workflows with traces, model percentiles, token usage, costs, errors, and workflow context.
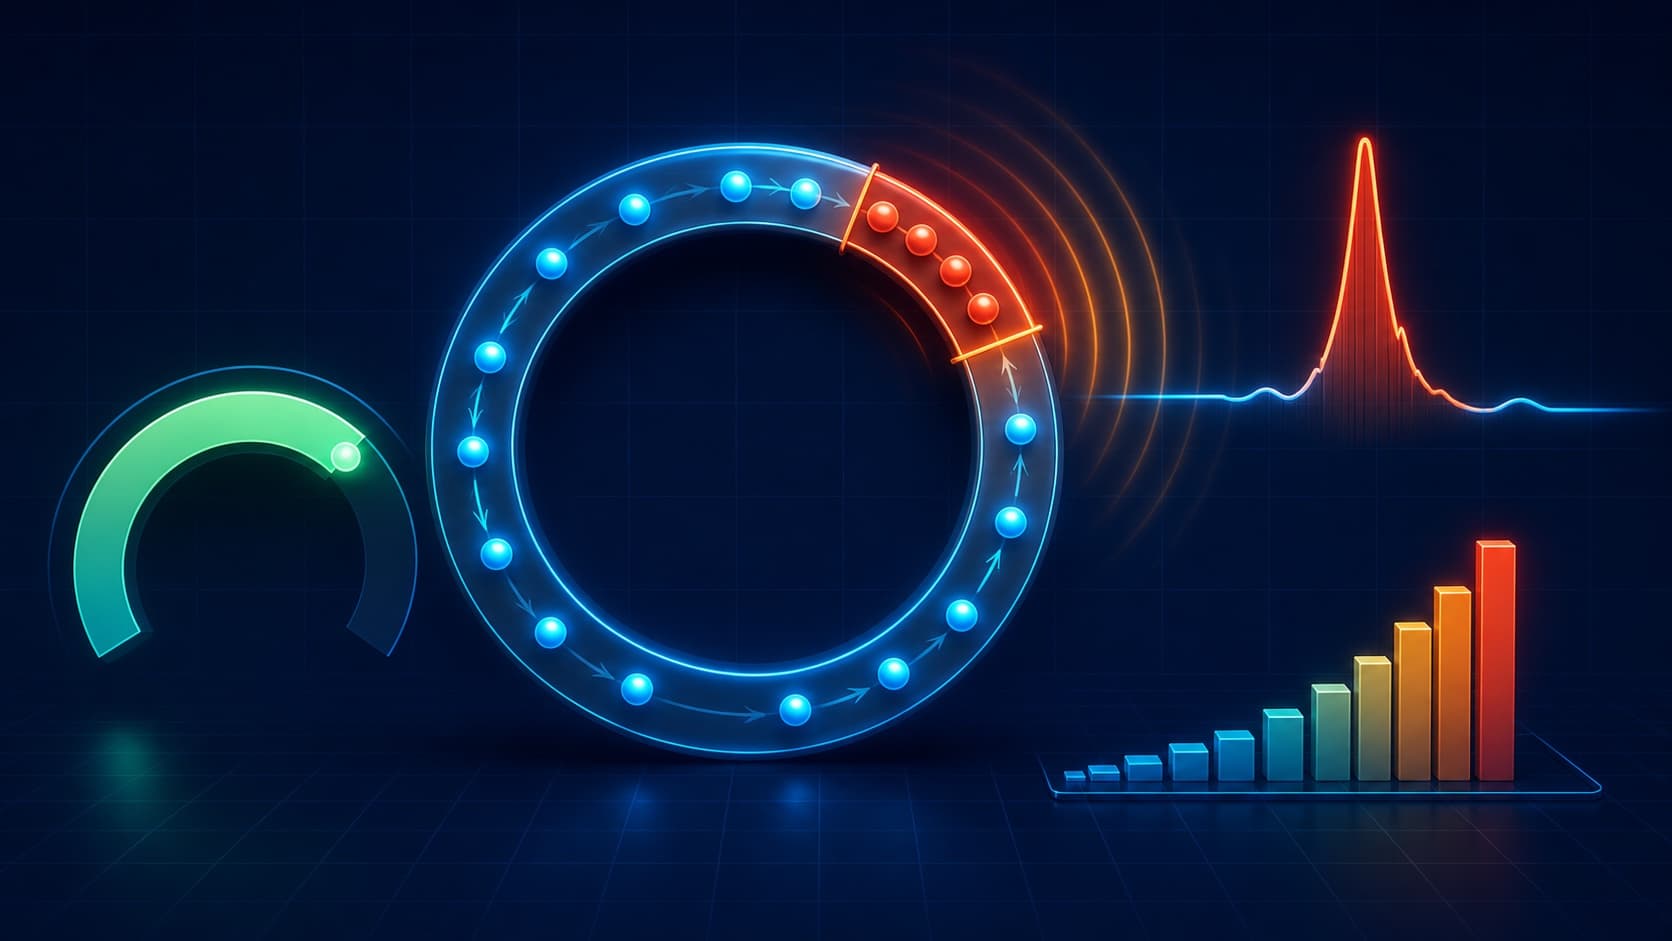
Node.js monitorEventLoopDelay and eventLoopUtilization
Use Node.js monitorEventLoopDelay and eventLoopUtilization to measure event-loop lag, export useful metrics, and debug blocking production code.