
Best APM for Rails: Choose by Failure Path
Compare Rails APM tools for slow SQL, jobs, requests, and cross-service traces. Use a short trial to choose the evidence your team needs.
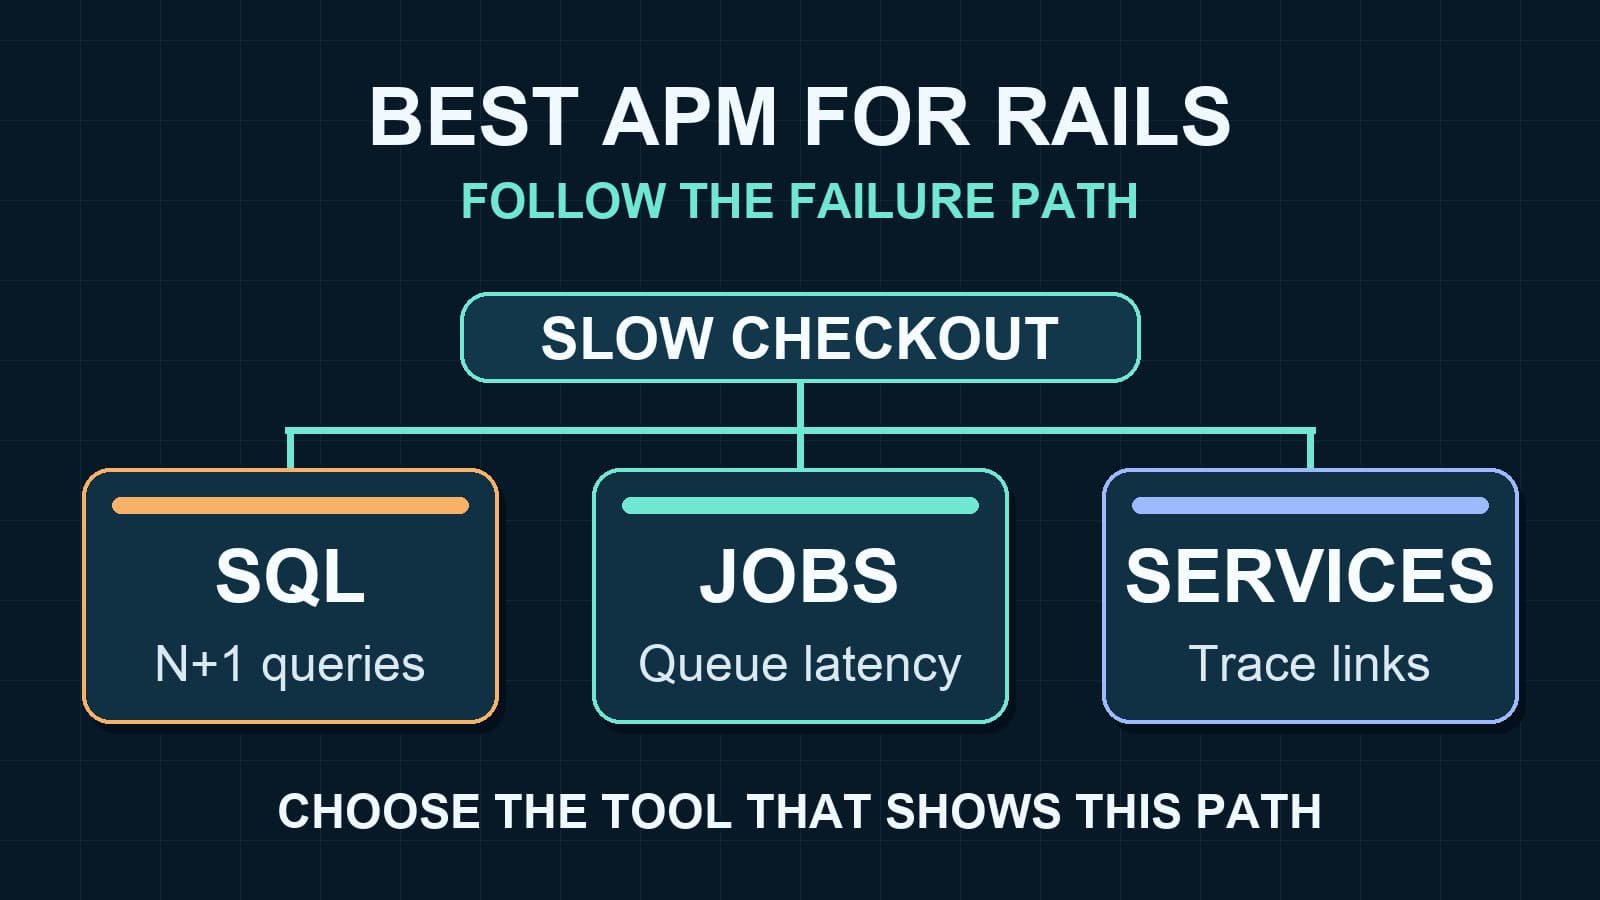
The best APM for Rails depends on where a failure hides. A slow checkout might spend time in ActiveRecord, wait for a Sidekiq job, or call another service. A tool list cannot tell you which path matters in your application. This guide compares five options, then gives you a test you can run before choosing one.
Start with the failure path
Pick one important Rails action. Follow its work through the database, jobs, and external calls. Ask these questions before you compare dashboards:
| Path | Evidence to request from an APM trial | Failure you might miss |
|---|---|---|
| Web request | Route latency, error status, and one request trace | Averages hide a slow tail. |
| ActiveRecord | Query time, repeated query pattern, and call site | An N+1 query grows with each record. |
| Background job | Queue wait, run time, retries, and failure | The HTTP request succeeds while the job fails. |
| Other service | A connected trace across process boundaries | One service looks healthy while another blocks the work. |
Rails offers eager loading and strict loading to help prevent lazy query patterns. Sidekiq exposes queue latency separately from job run time. A useful APM trial must show the evidence that matches your failure path.
Five Rails APM options and their best fit
This comparison uses each vendor's published documentation. It does not claim that every integration works in every application. Test your Rails version, job adapter, database driver, and deployment setup.
| Option | Try it first when | Verify in your trial |
|---|---|---|
| Scout Monitoring | ActiveRecord N+1 queries or memory growth dominate your incidents. | Find the repeated query and its code location in a real controller or job. |
| AppSignal | Your team wants Rails performance, errors, metrics, and host signals in one service. | Confirm that the request, error, and job views answer the same incident question. |
| Skylight | Your main task is finding which Rails endpoint or event uses time. | Check its endpoint breakdown and enable job instrumentation if jobs matter. |
| New Relic | You need Rails APM beside broader service and operations data. | Check the Ruby agent's transaction traces and the complete cost for your data. |
| Tracekit | You need OpenTelemetry traces across services, with selected runtime state during debugging. | Confirm the actual Rails, database, job, and cross-service spans in your deployment. |
There is no universal winner. Scout documents automatic ActiveRecord N+1 detection and memory analysis. Skylight focuses on Rails performance paths. AppSignal publishes a wider Ruby operations feature set. New Relic publishes a Rails quickstart with transaction tracing and service maps. Tracekit fits teams that want trace context across services and targeted dynamic logs.
These are starting points, not measured rankings. Check each vendor's current terms, data limits, and plan details before you buy. Do not compare an entry price with another tool's full data bill.
What Tracekit can and cannot show by default
Tracekit's Ruby integration guide describes Rails setup and a Rack request path. The current Ruby SDK Railtie adds Rack middleware. That middleware creates a server span and records request duration, status, and errors. The SDK also has a metrics API and an explicit method for dynamic logs.
The Ruby gem declares HTTP and Net::HTTP instrumentation dependencies. Its Rails, ActiveRecord, and Sidekiq instrumentation loads only when those optional libraries are present. Do not assume the gem alone provides every child span. Check a real trace after setup. Add and configure the needed OpenTelemetry instrumentation when your application needs more coverage.
Tracekit does not claim automatic Rails N+1 diagnosis in this comparison. A trace with repeated database spans can help you investigate the pattern when database instrumentation is active. The Rails N+1 guide shows how to confirm it in code. Dynamic logs capture selected runtime state; they are not general log ingestion.
OpenTelemetry's Ruby instrumentation guide lists Rails and other library integrations. Its Ruby status page lists traces as stable, while metrics and logs remain in development. Verify the exact libraries and signals you use. Also check trace context when a request hands work to a job or another service.
Run one fair comparison in your application
Use the same checkout action for each tool. This makes the result easier to judge than five separate demo screens.
- Send a normal request and a slow request through the same Rails route. Record p50 and p95 latency.
- Trigger a repeated ActiveRecord query in a safe test environment. Find the query count and code location.
- Enqueue a job, then make one job attempt fail. Check queue wait, run time, retries, and error details.
- Call one downstream service. Check whether the trace keeps its parent link across the call.
- Open one incident from the alert or error view. Count the steps needed to reach the cause.
- Estimate the bill at your normal traffic and retention settings. Include jobs, traces, metrics, and other enabled data.
Record each result as shown, needs setup, or not shown. Ask the vendor about a gap only after you check its documented setup. Keep secrets and customer payloads out of test attributes and dynamic log captures.
| Decision question | A strong answer looks like |
|---|---|
| Which request got slower? | The tool shows the route and the slow tail, not only a service average. |
| Why did SQL time rise? | You can reach a query pattern and the calling code. |
| Did the job finish? | Queue wait and job execution have separate evidence. |
| Where did the trace stop? | You can see a missing or broken process handoff. |
| What changed in code? | A release or commit gives the team a testable lead. |
Choose the smallest useful coverage
Choose Scout first when automatic N+1 and memory findings are central to your Rails work. Choose Skylight when endpoint profiling is the main task. Trial AppSignal or New Relic when your team needs a broader operations view. Trial Tracekit when Rails is one service in a wider request path and runtime state can shorten debugging.
You can start with vendor-neutral OpenTelemetry Ruby instrumentation when portability matters. Instrument one request, one query, and one job before you expand coverage. Use the Tracekit distributed tracing guide if you want to inspect those traces in Tracekit. Keep the tool that answers your real incident questions with the least work.
Related Posts
Your API Just Threw a 500. Here's How to Actually Fix It.
Your API threw a 500 at 3 AM. A systematic approach to diagnose, trace, and fix production API errors without the panic and guesswork.
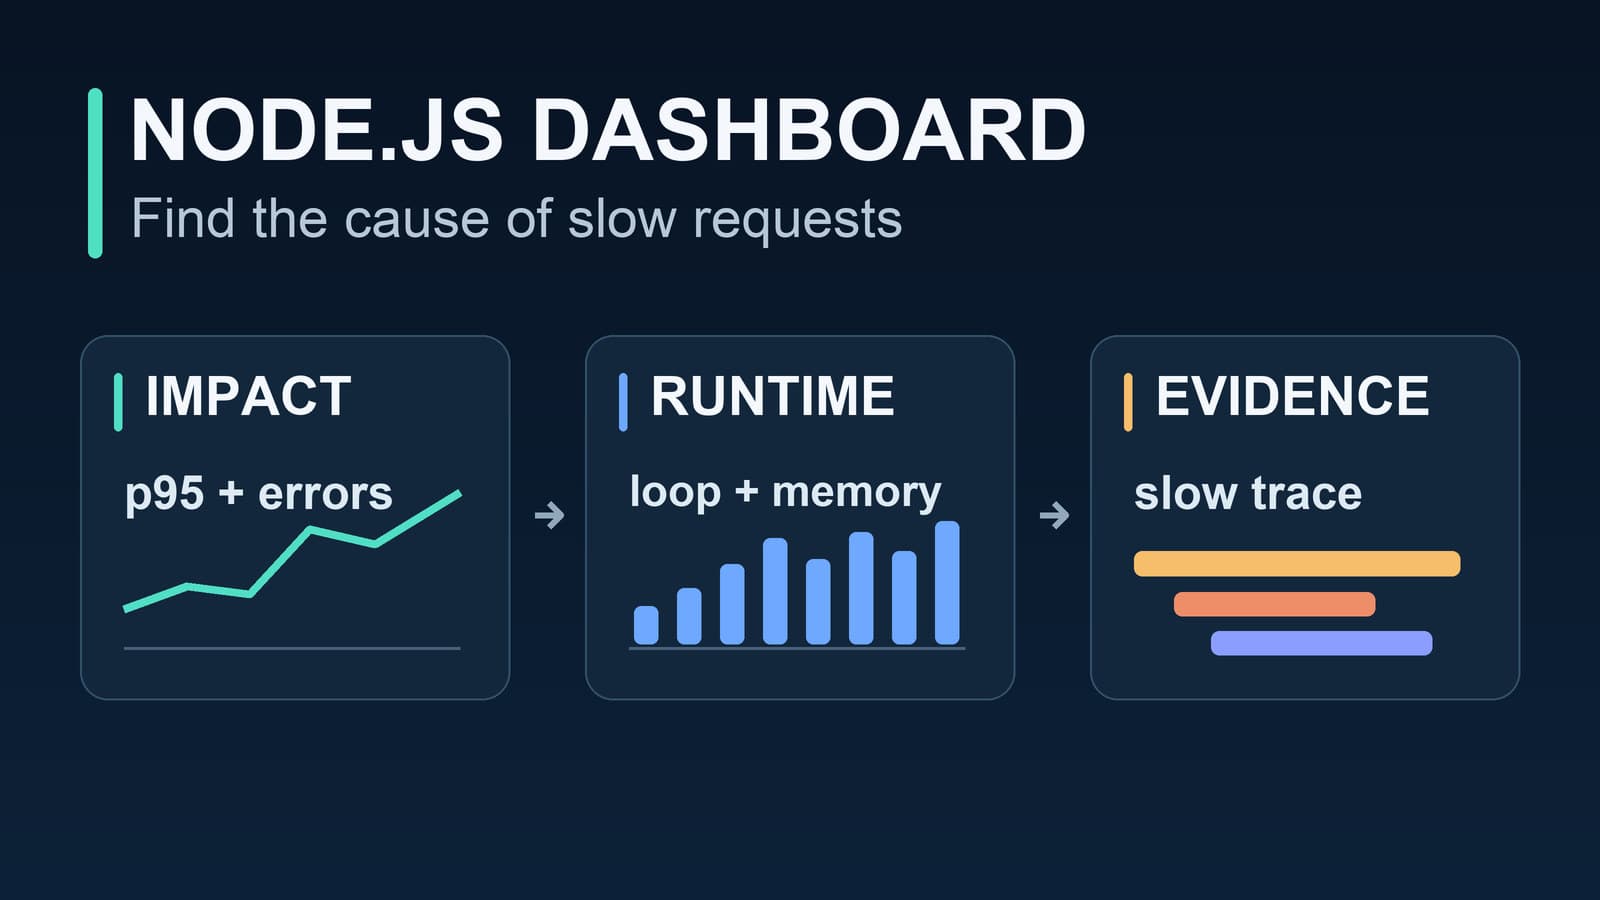
Node.js Monitoring Dashboard: 8 Production Panels
Build a Node.js monitoring dashboard with eight panels that connect request impact, event loop health, memory, and slow traces.
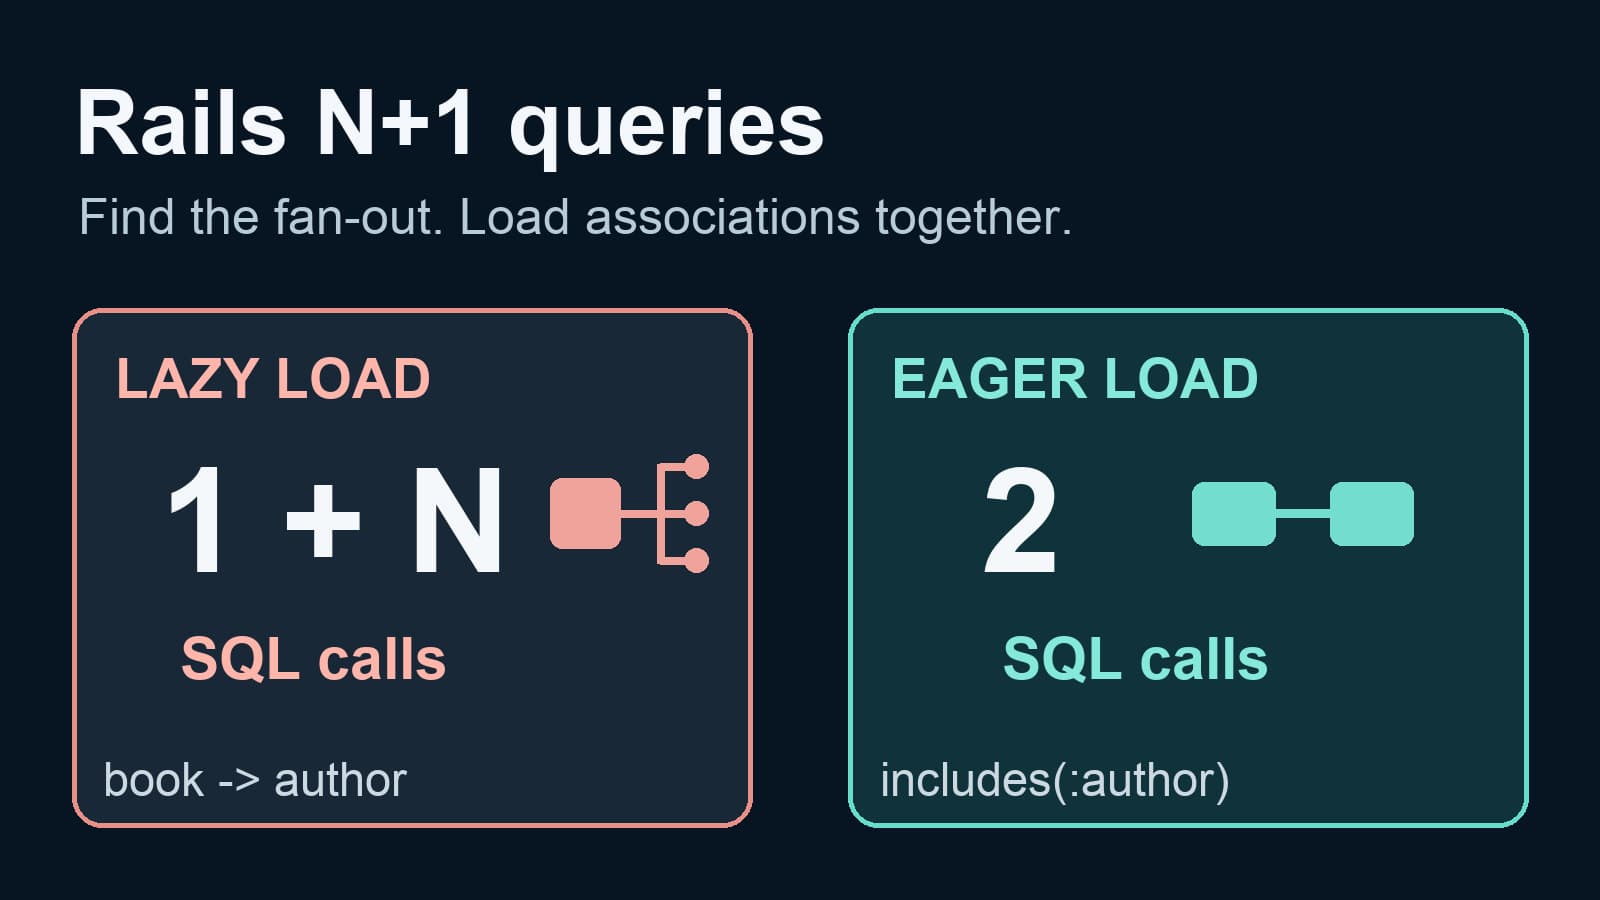
Rails N+1 Query Detection: Find and Fix Lazy Loads
Detect Rails N+1 queries with SQL notifications and strict loading. Fix lazy associations with includes, then verify the request trace.