
4 min
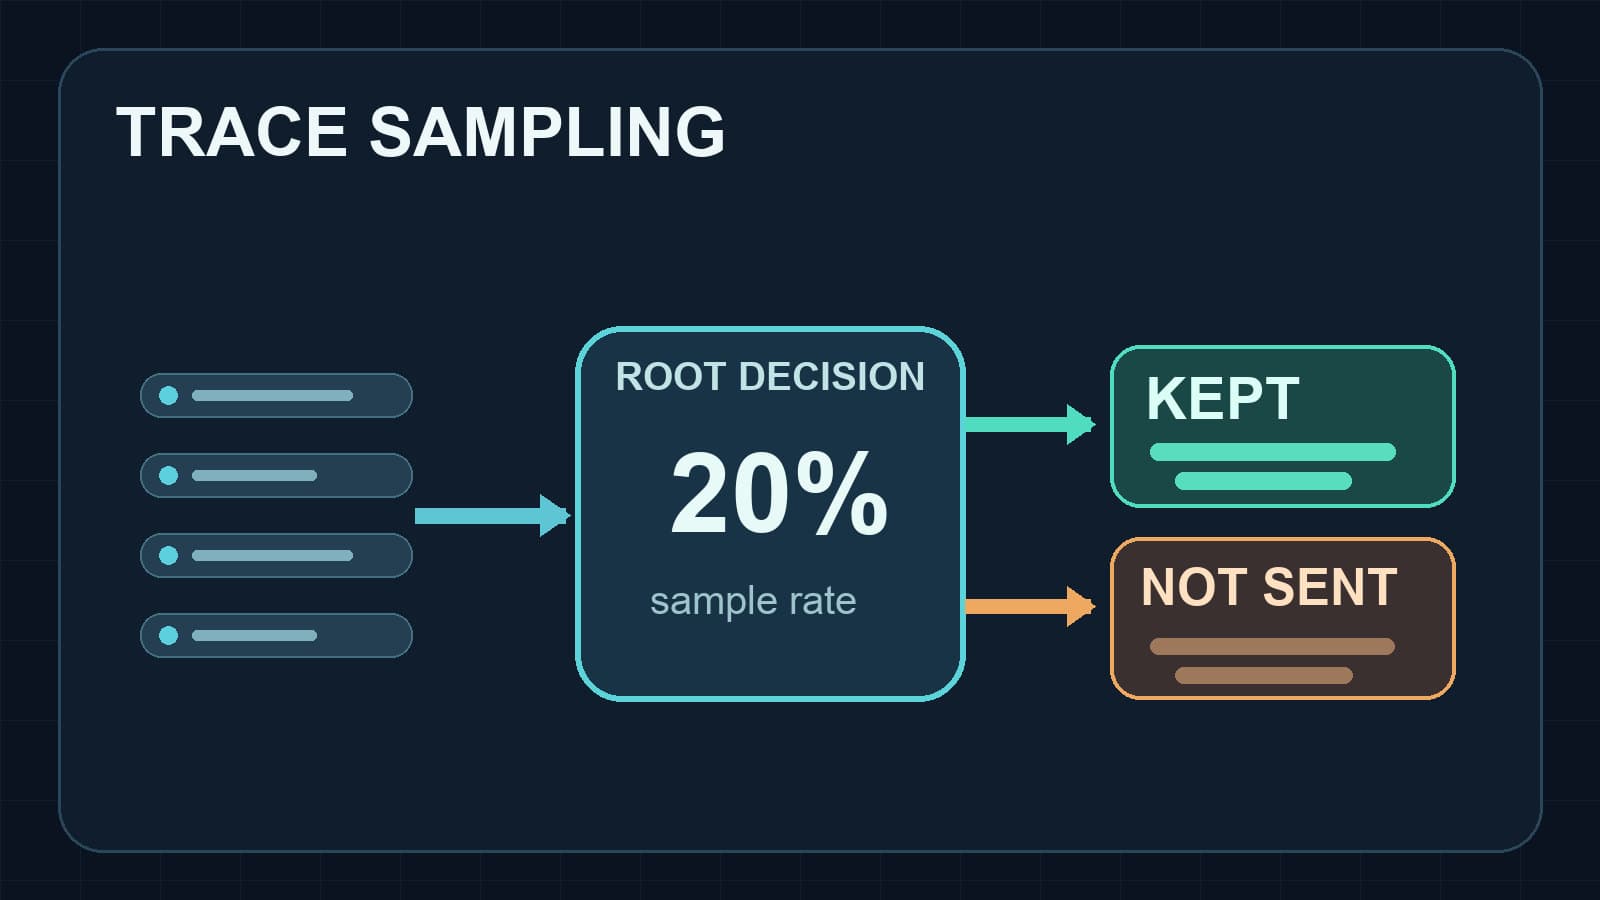
DD_TRACE_SAMPLE_RATE in Node.js: A Practical Guide
Set DD_TRACE_SAMPLE_RATE in Node.js, understand rate limits and sampling rules, and verify which distributed traces reach Datadog.
nodejsdistributed-tracing
Set DD_TRACE_SAMPLE_RATE in Node.js, understand rate limits and sampling rules, and verify which distributed traces reach Datadog.
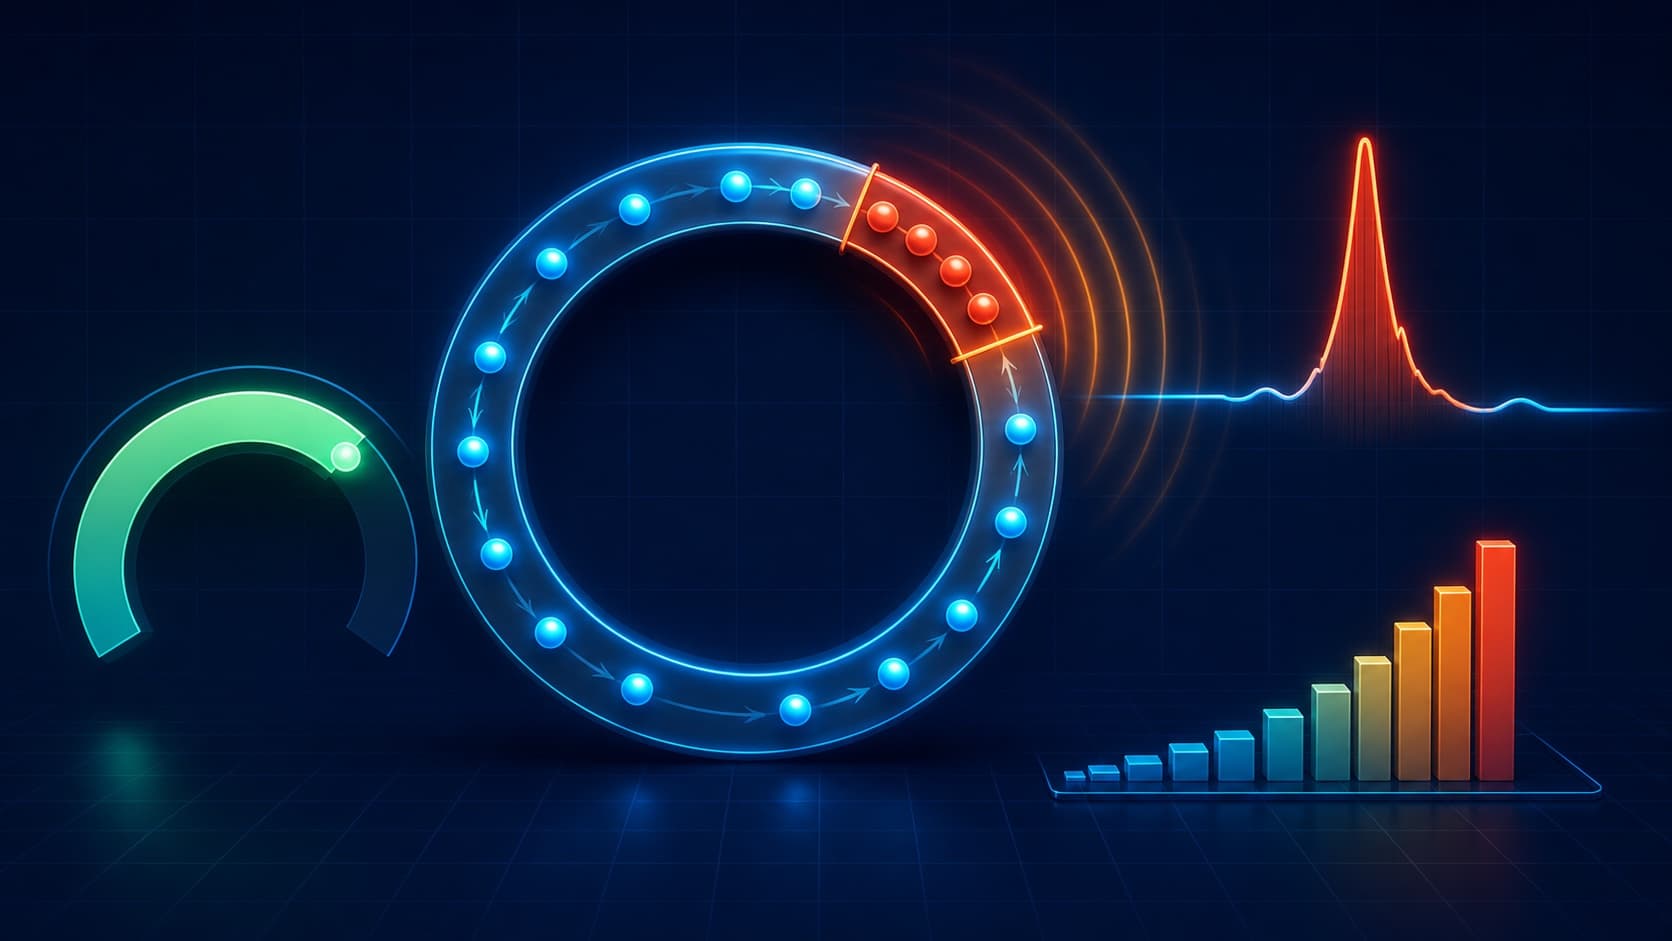
Use Node.js monitorEventLoopDelay and eventLoopUtilization to measure event-loop lag, export useful metrics, and debug blocking production code.
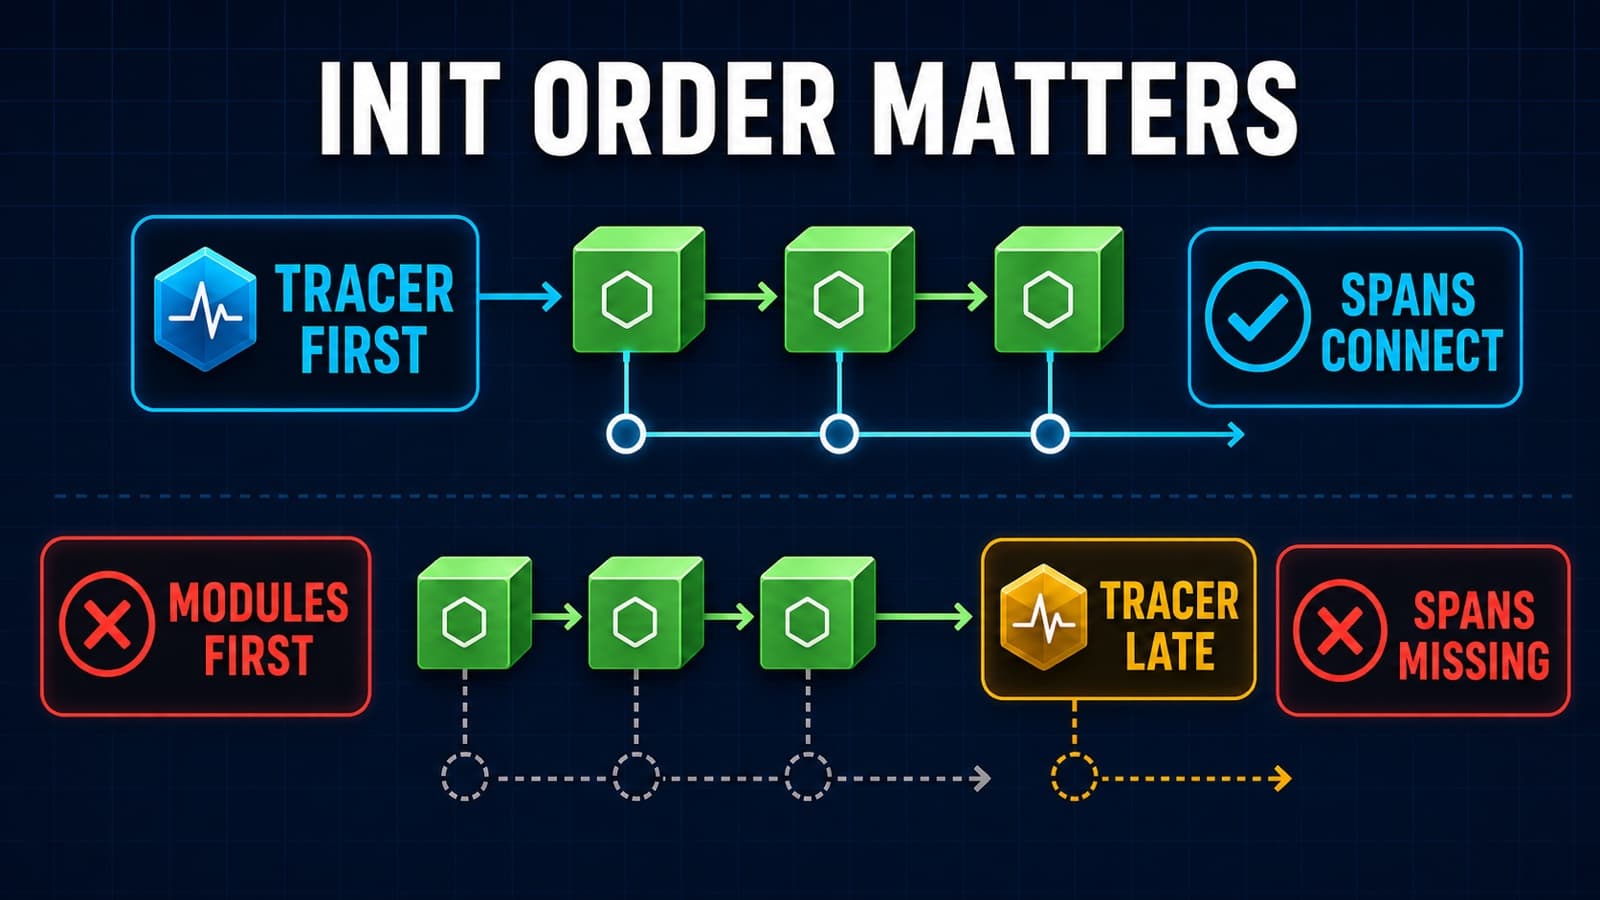
Fix dd-trace init order in Node.js with correct CommonJS, ESM, TypeScript, and bundler startup patterns when spans or routes disappear.
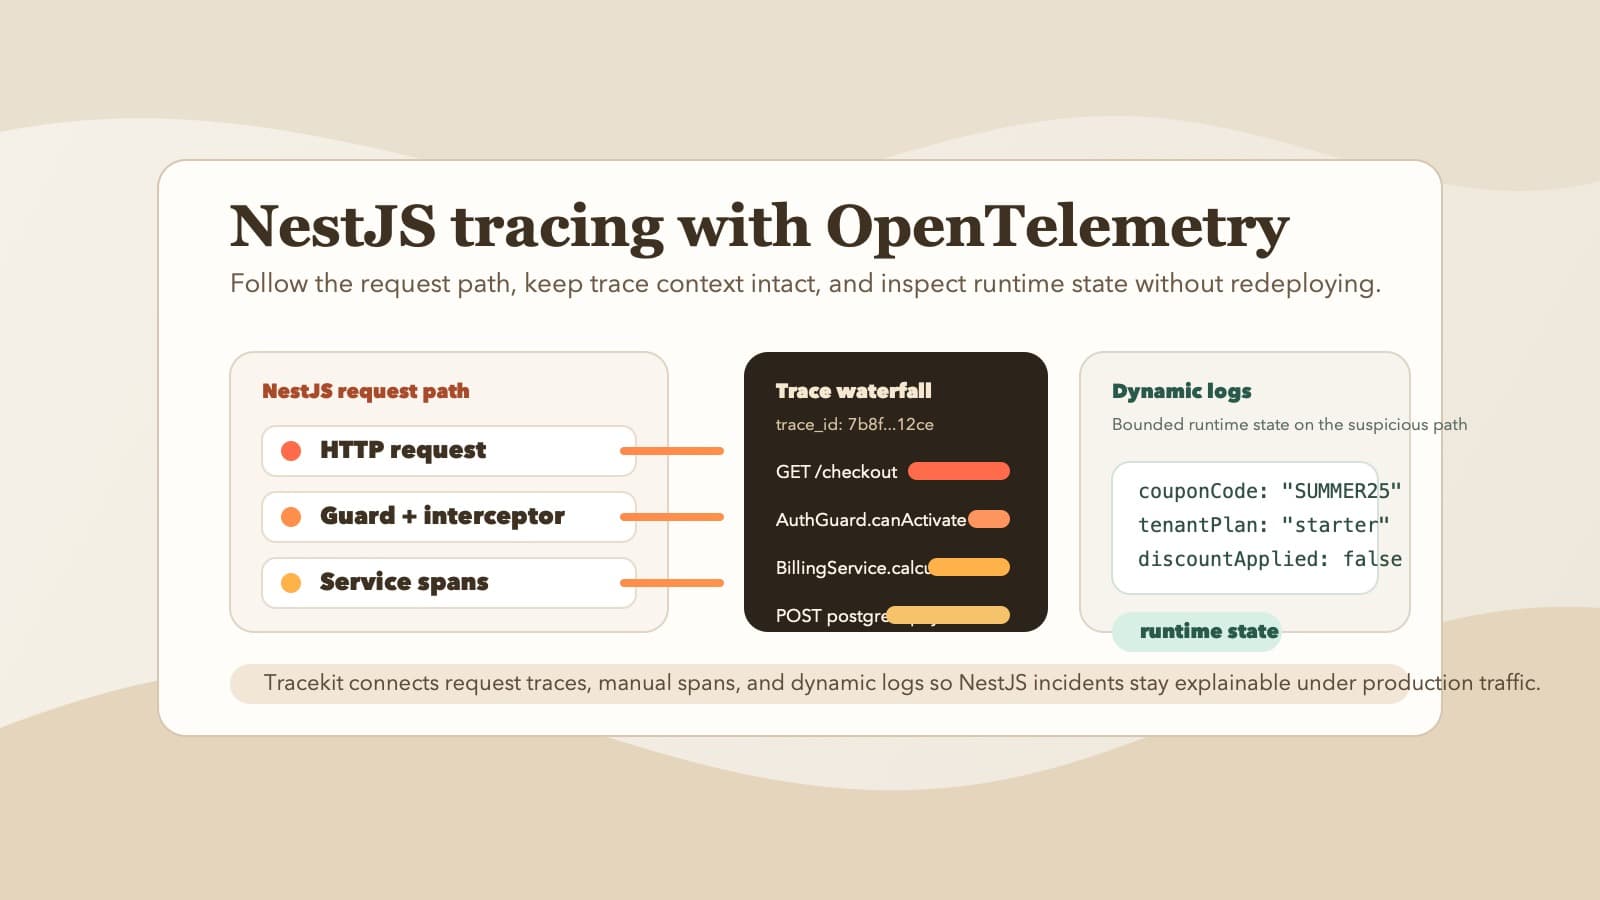
Build NestJS observability across HTTP requests and queue jobs. Compare NestJS Observe, OpenTelemetry, and Tracekit coverage with a practical test.

Step-by-step guide to debugging production without redeploying. Set up dynamic logs for PHP, Node.js, Go, and Python in minutes.
Your API threw a 500 at 3 AM. A systematic approach to diagnose, trace, and fix production API errors without the panic and guesswork.
Get production visibility without the Datadog bill. Free-tier APM setup with OpenTelemetry for freelancers and small teams who need traces, not invoices.
Debug Express.js in production: error middleware, async handling, structured logging with Pino, OpenTelemetry tracing, and dynamic logs.
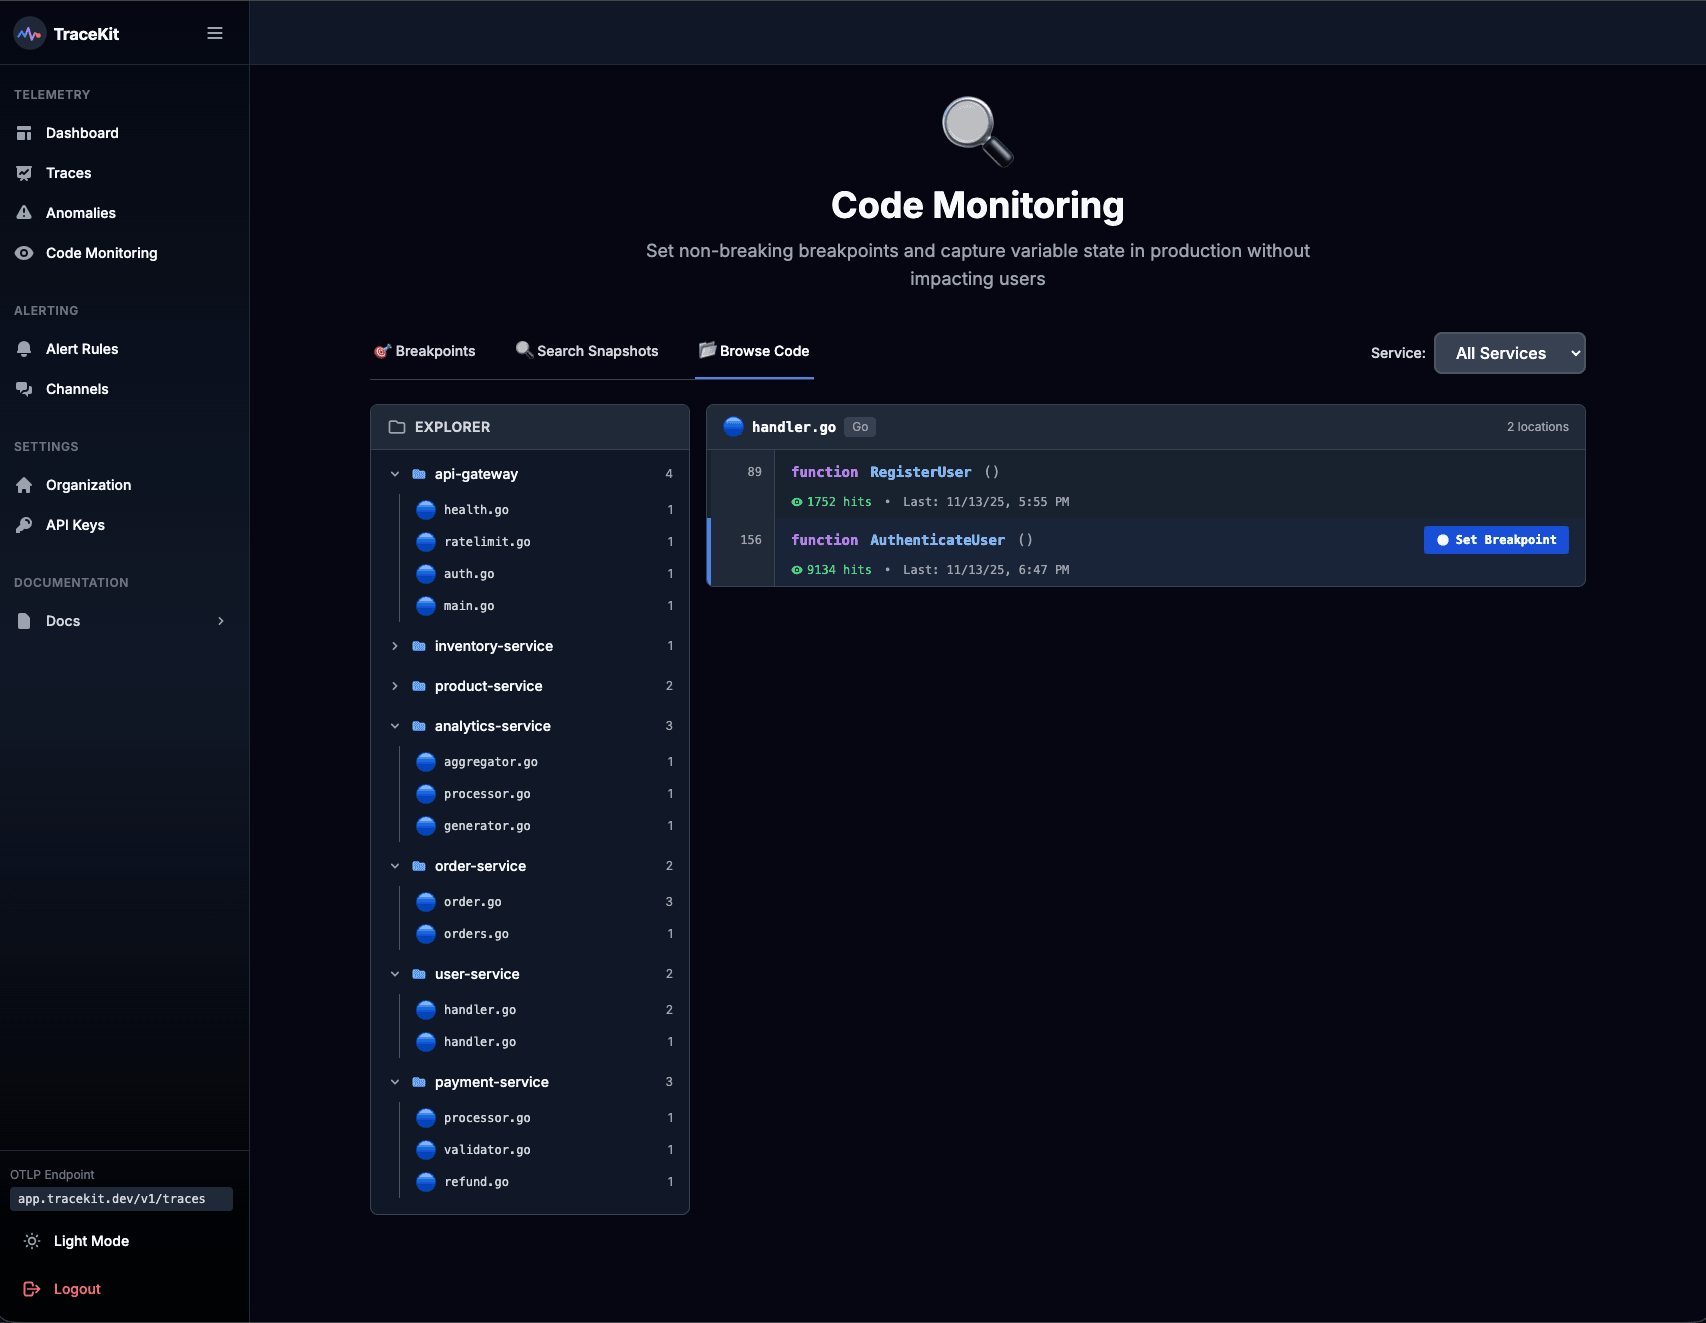
Debug production apps with dynamic logs and log points. Capture variable state without redeploying or stopping your application.
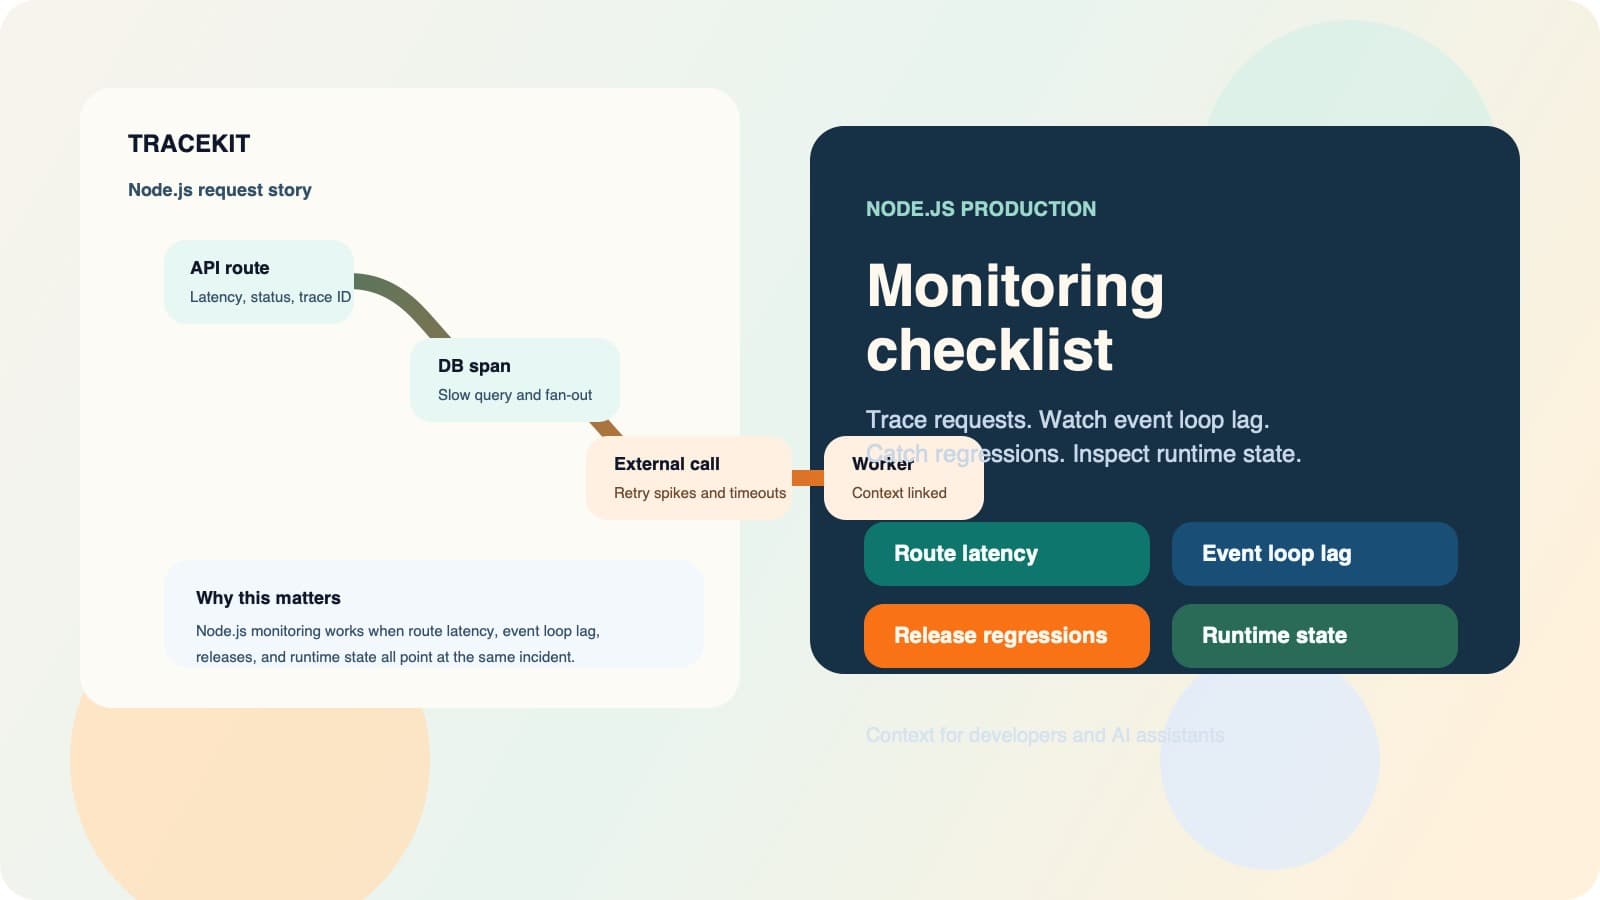
Use Node.js application performance monitoring to connect request traces, event loop health, dependencies, releases, and runtime state.
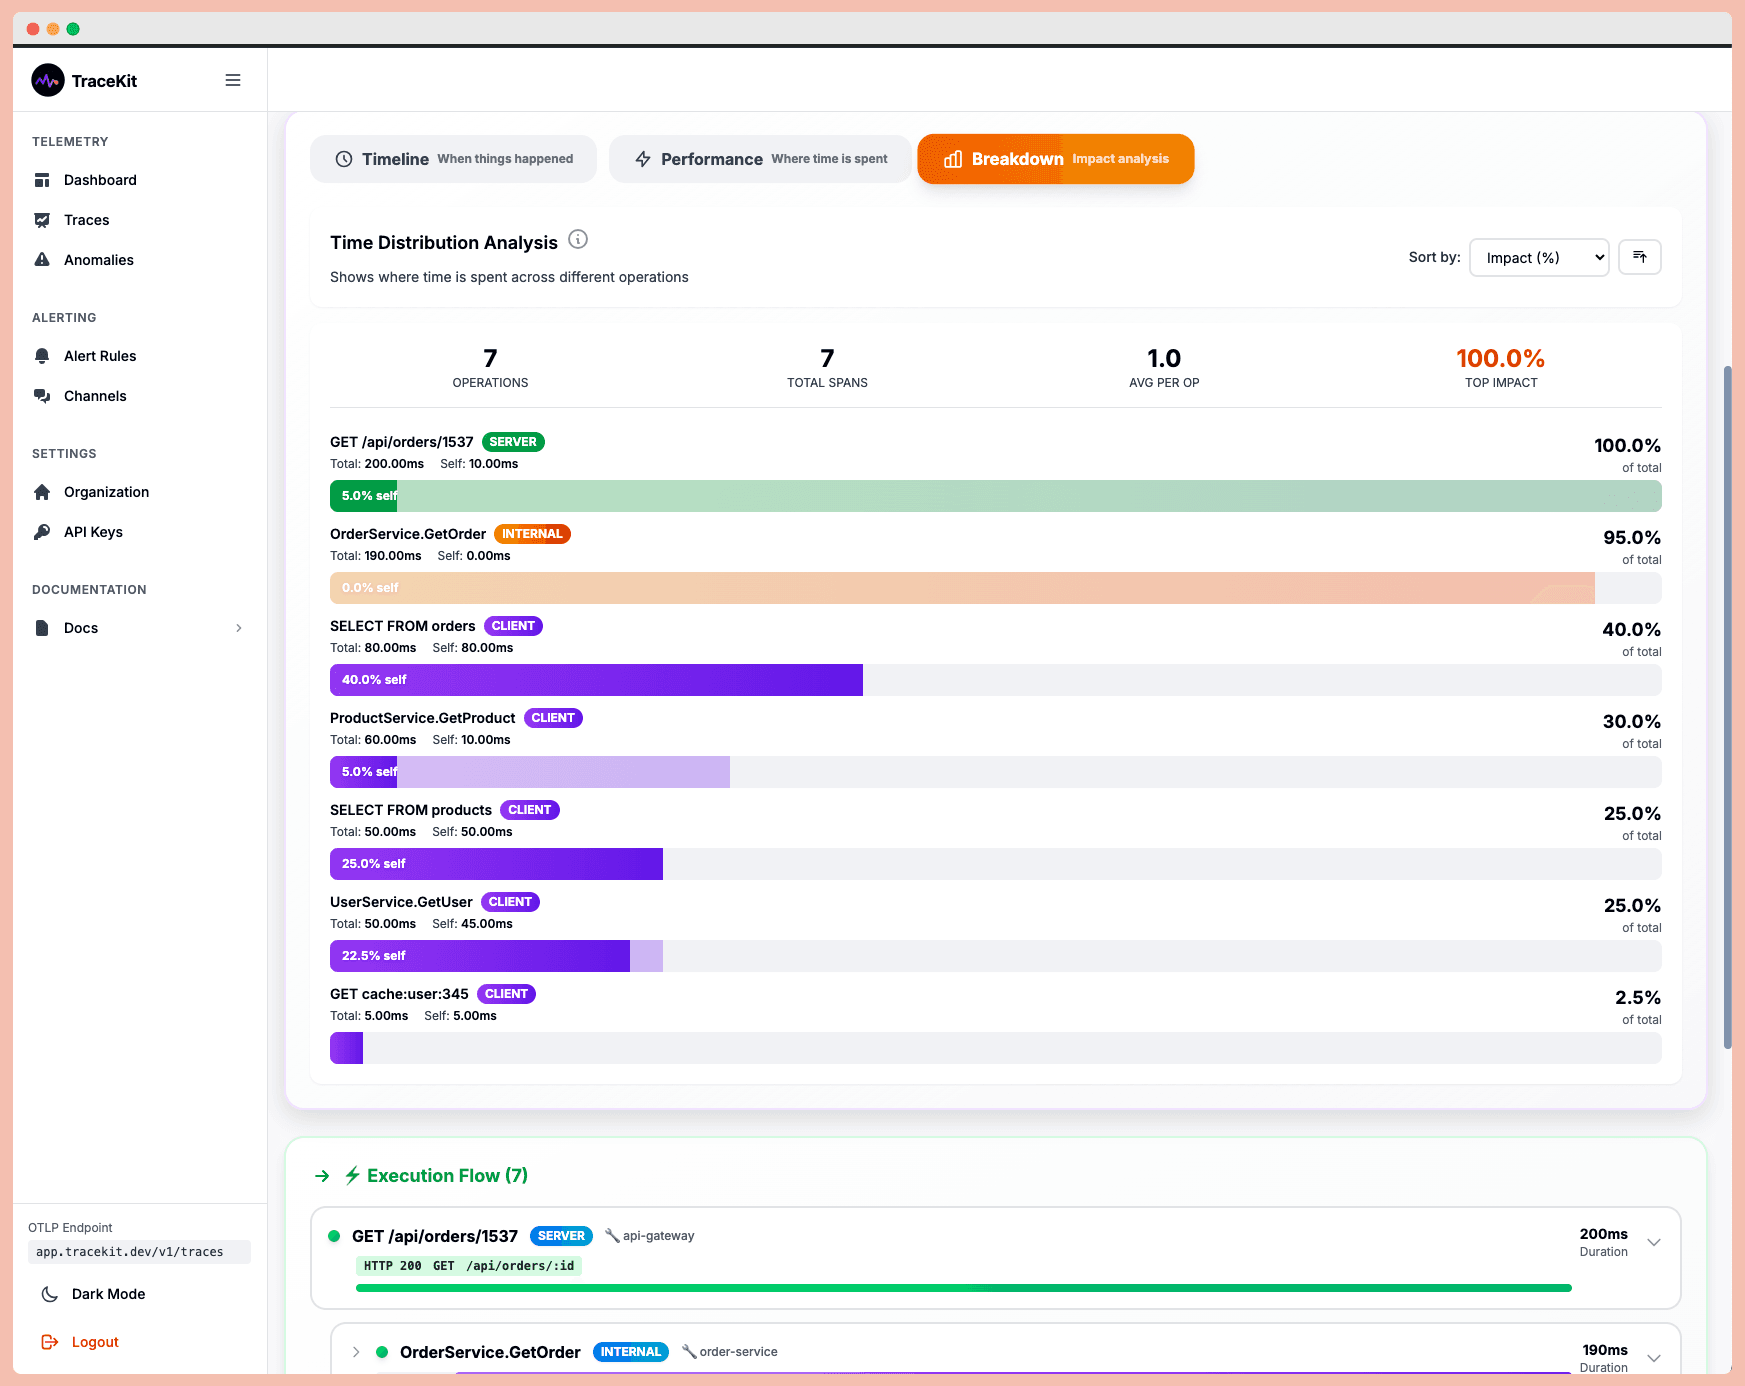
Debug production issues 10x faster with distributed tracing. Track requests across microservices, find bottlenecks, and resolve errors without log diving.