
4 min
Zero-Cost Production Visibility: APM Without the Datadog Bill
Get production visibility without the Datadog bill. Free-tier APM setup with OpenTelemetry for freelancers and small teams who need traces, not invoices.
distributed-tracinggolang
Engineering insights on observability, distributed tracing, and production debugging.
Get production visibility without the Datadog bill. Free-tier APM setup with OpenTelemetry for freelancers and small teams who need traces, not invoices.

Use session context to debug distributed systems. Attach trace IDs and correlation IDs to requests for seamless tracking across microservices.
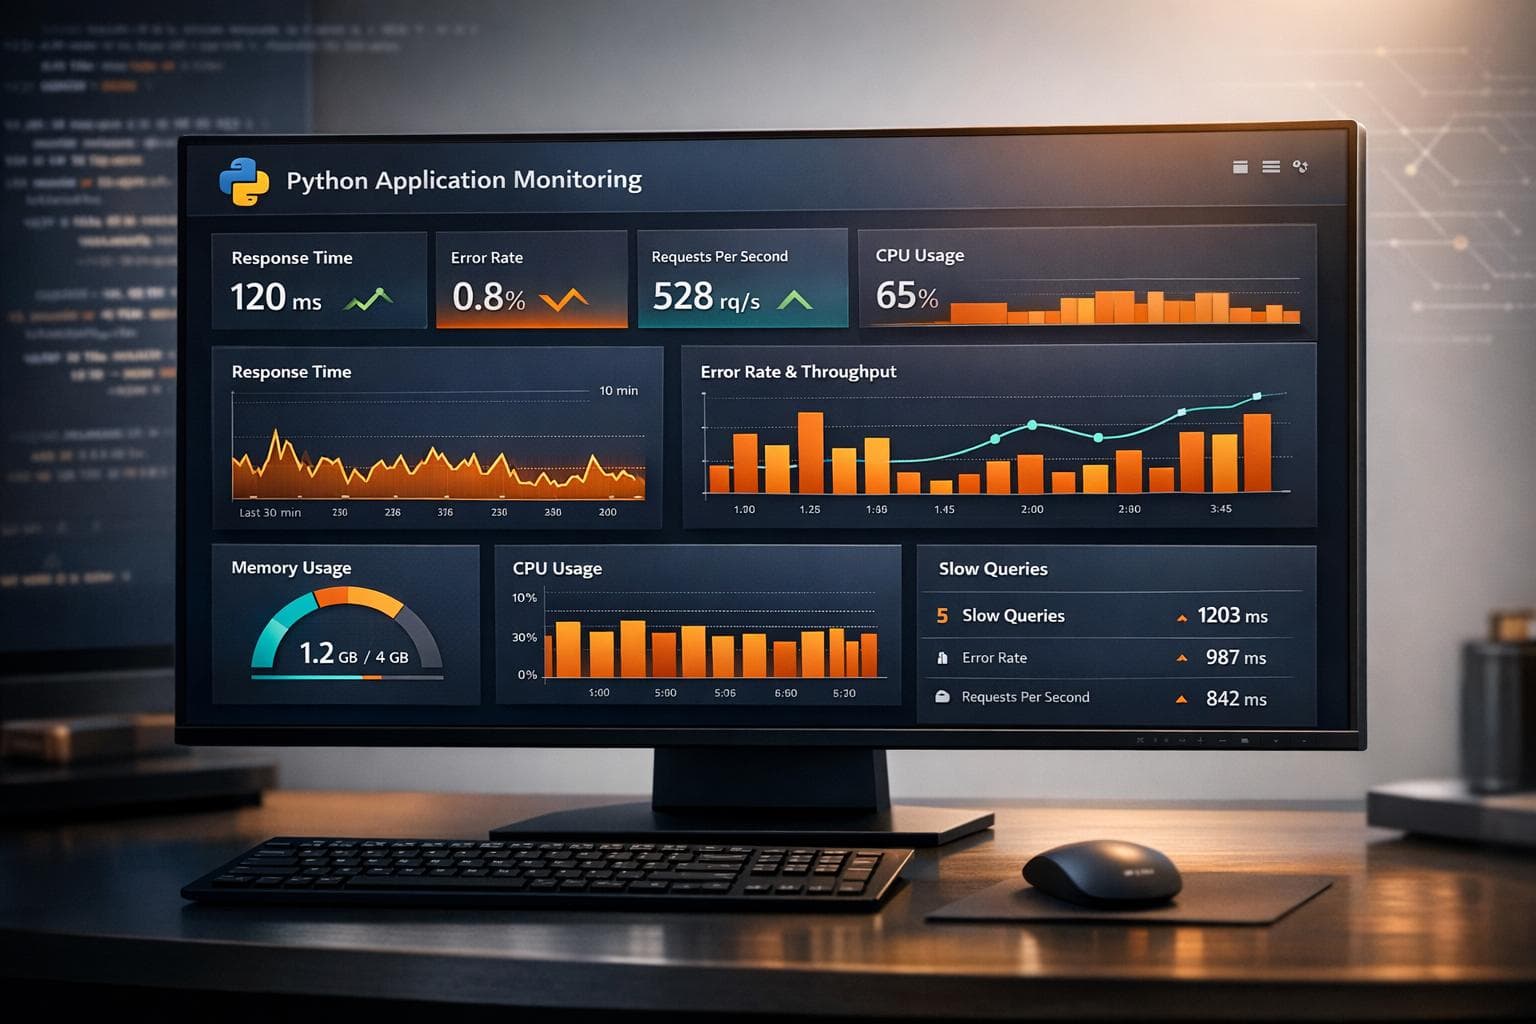
Set up Python application performance monitoring with OpenTelemetry. Measure latency, errors, throughput, and dependency spans across production requests.

Learn when logs, traces, and dynamic logs help inspect production variables without redeploying. Includes setup limits and a safe capture checklist.

Debug production APIs without relying on logs. Use distributed tracing, dynamic logs, and AI anomaly detection to find root causes 70% faster.

Trace code latency spikes with metrics, distributed traces, custom spans, and runtime state. Follow a practical production workflow.

Instrument message latency tracking in microservices with OpenTelemetry spans, queue-age metrics, trace context, percentiles, and practical alert rules.

Use distributed tracing for root cause analysis. Track requests across microservices with trace IDs and spans to pinpoint bottlenecks and failures.

Improve service dependency mapping accuracy by finding missing trace edges, stale services, broken context, and fragmented monitoring data.

Explore five innovative ways to debug production applications in real-time without redeploying, ensuring smooth user experiences.
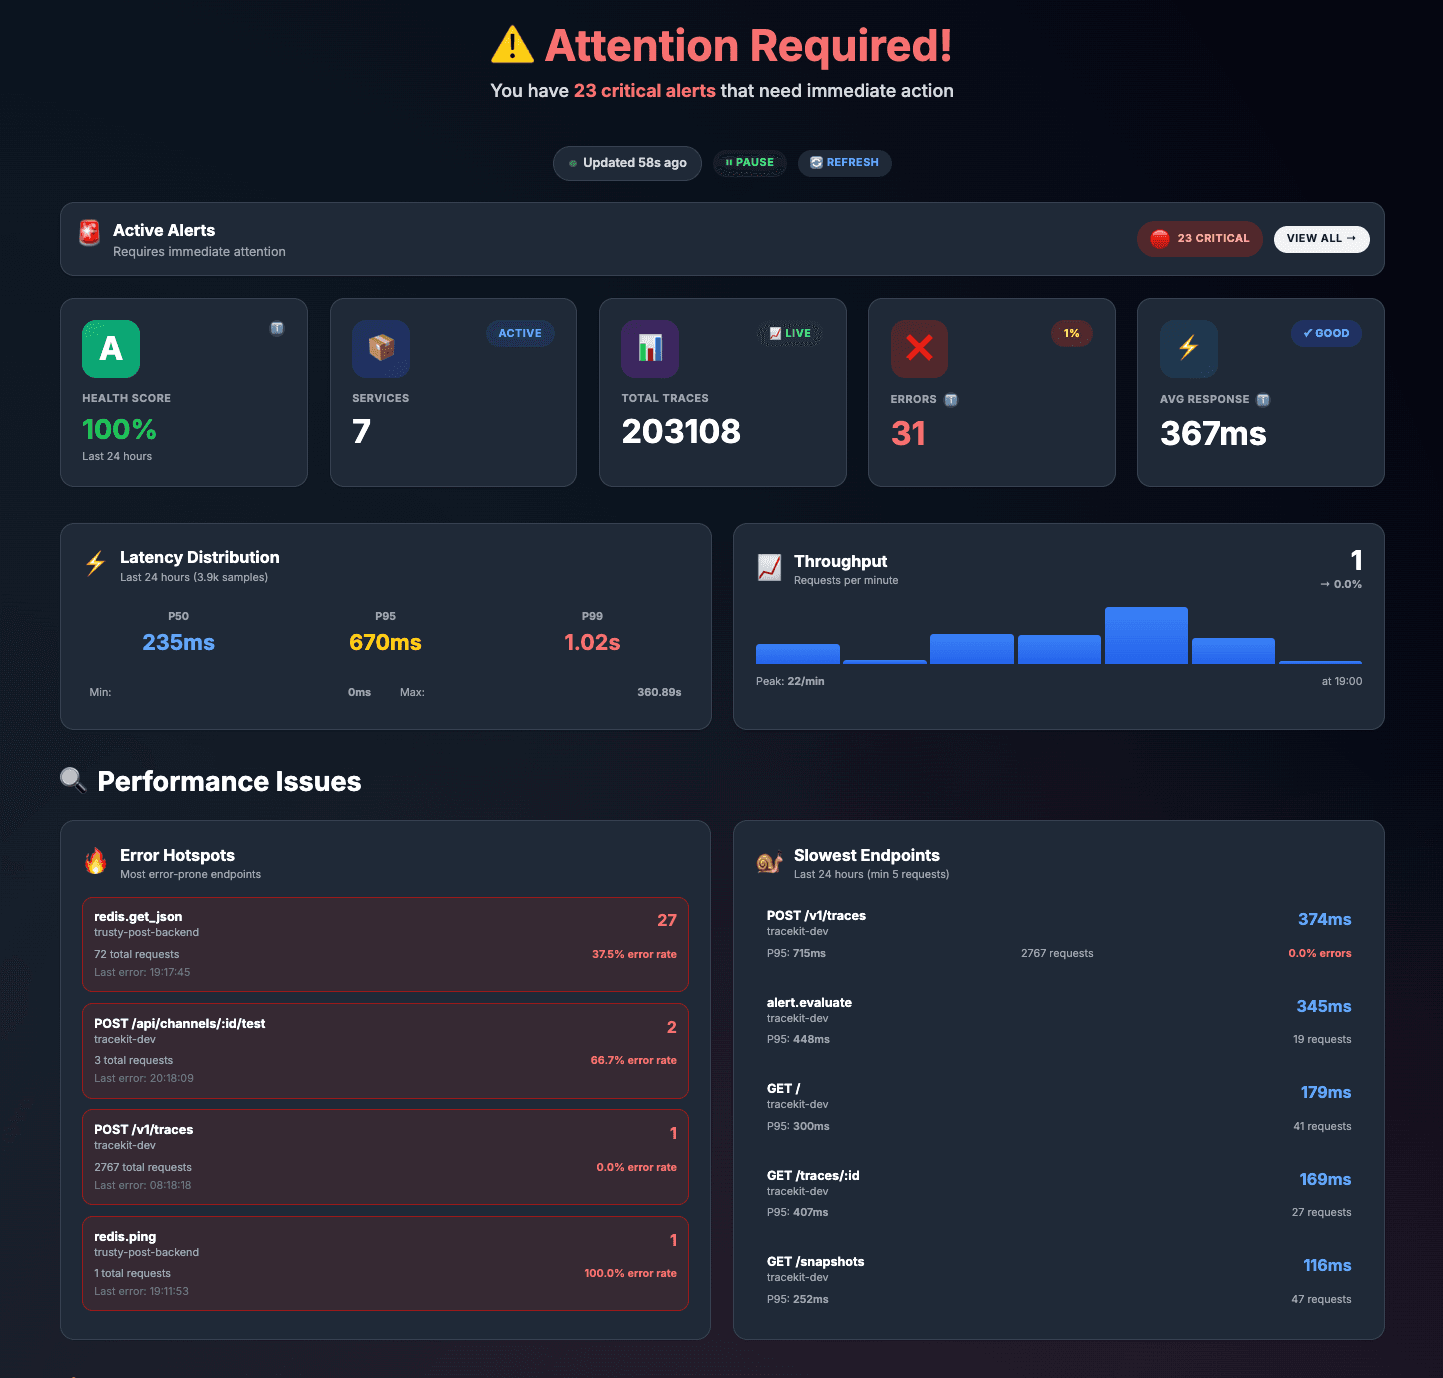
Go observability for production: OpenTelemetry setup for Gin, Echo, gRPC, and GORM. Distributed tracing, metrics, and monitoring for Go services.
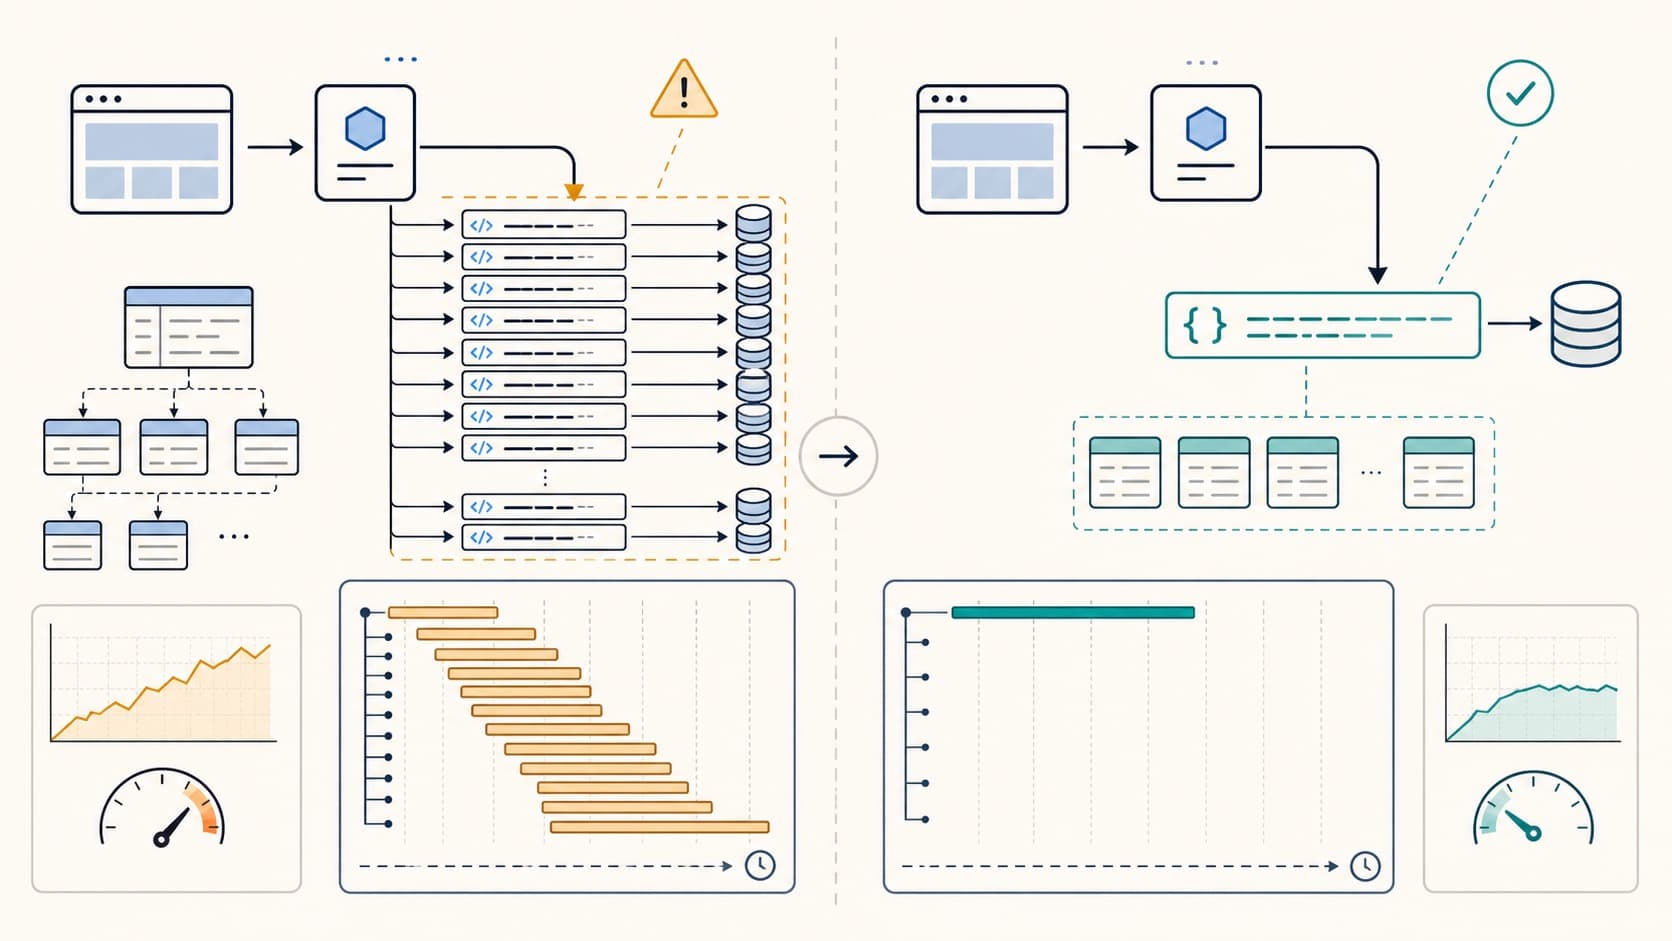
Detect N+1 queries with query counts and traces. Find repeated database calls, fix ORM loading, and verify the result in production.