
7 min
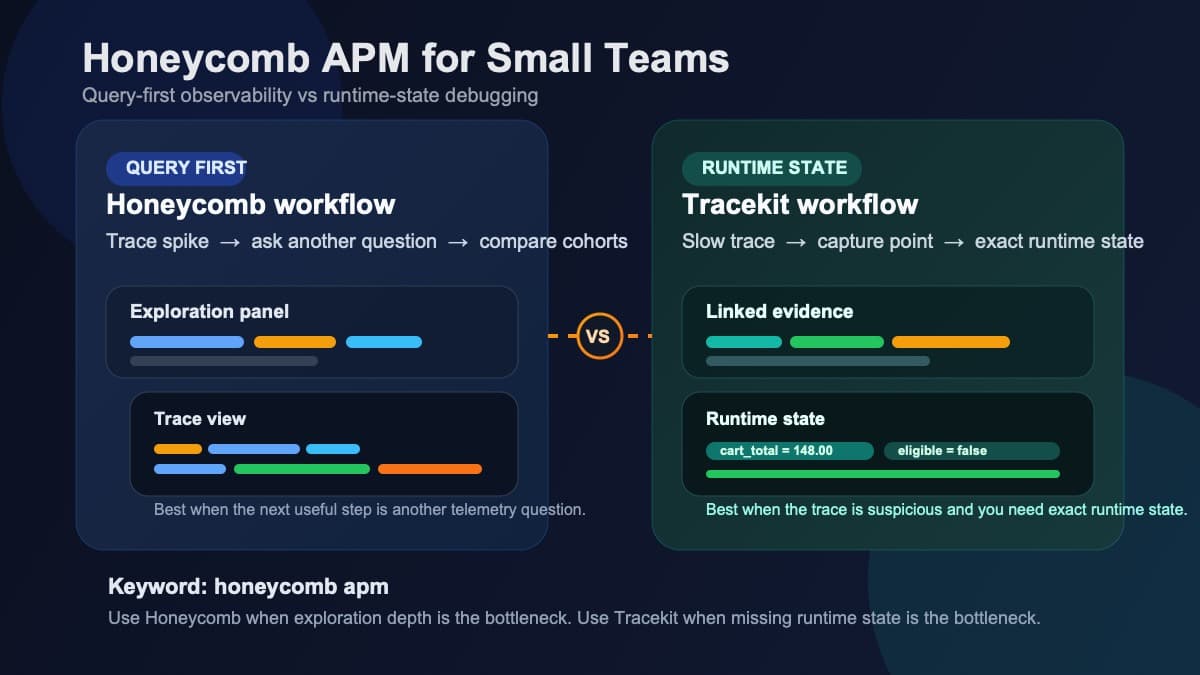
Honeycomb APM for Small Teams: Querying vs Runtime State
Honeycomb APM explained for small teams: query-first observability, pricing tradeoffs, and when you still need runtime state to debug production.
honeycombapm
Honeycomb APM explained for small teams: query-first observability, pricing tradeoffs, and when you still need runtime state to debug production.

Fix intermittent 500 errors systematically. Reproduce, investigate logs, trace requests, and capture application state to find the root cause.
Your API threw a 500 at 3 AM. A systematic approach to diagnose, trace, and fix production API errors without the panic and guesswork.
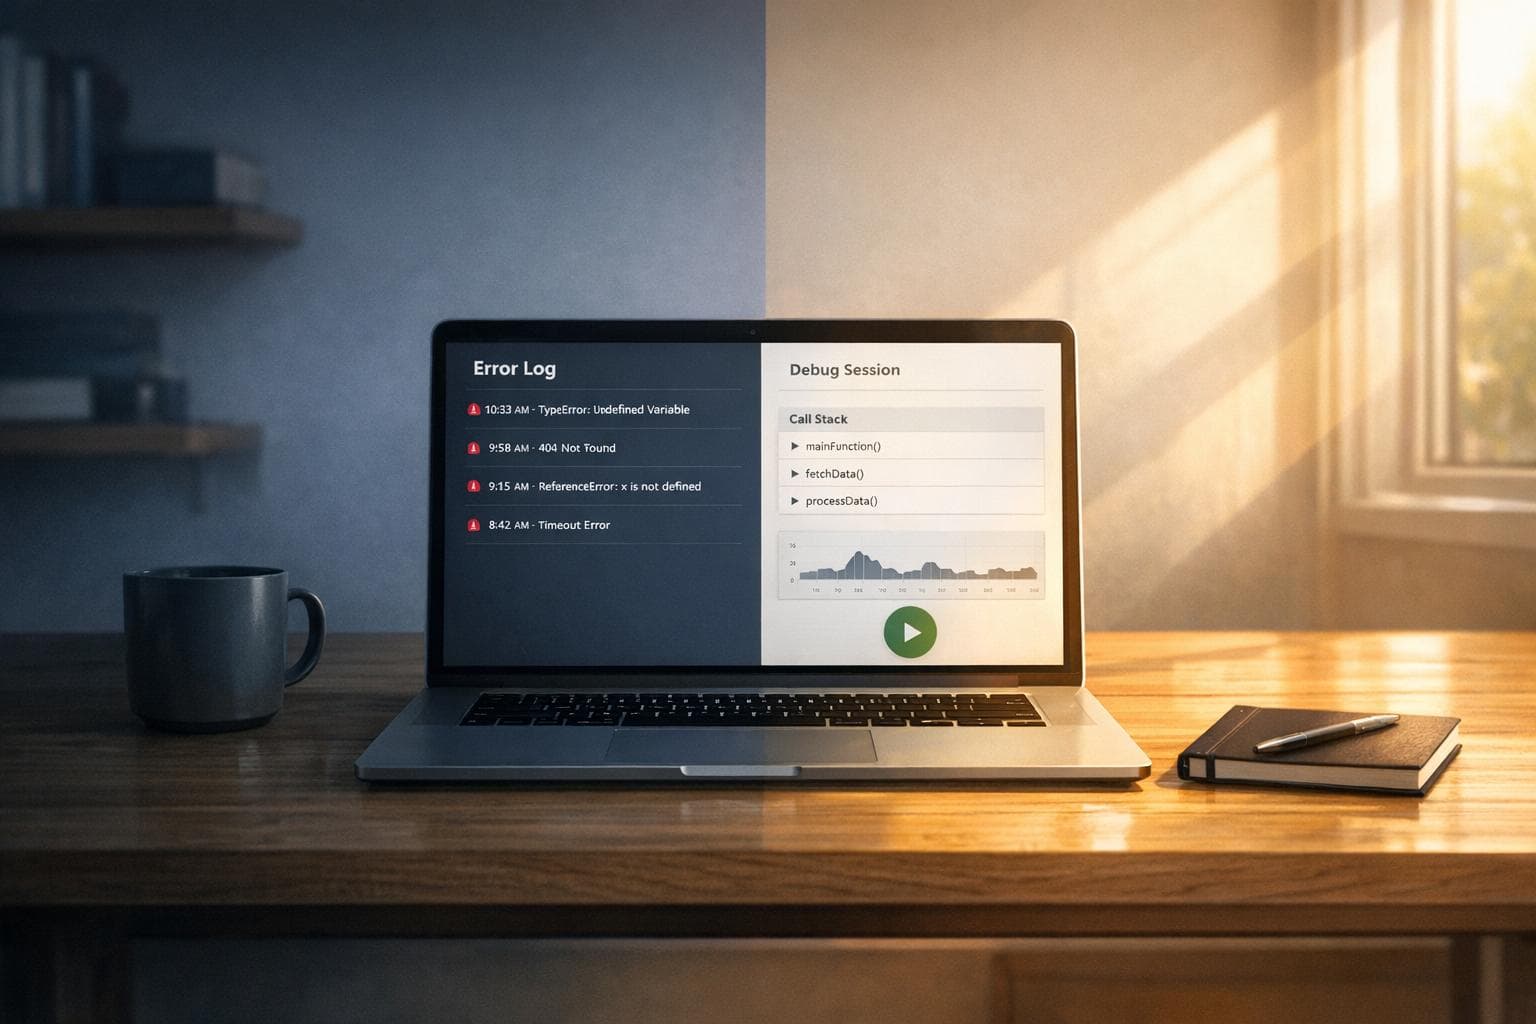
Sentry vs TraceKit compared: error tracking vs full production debugging. Feature-by-feature comparison with pricing, setup time, and use case guidance.
AI tools ship code fast, but debugging it in production is different. Learn how to trace, diagnose, and fix issues in AI-generated code without redeploying.
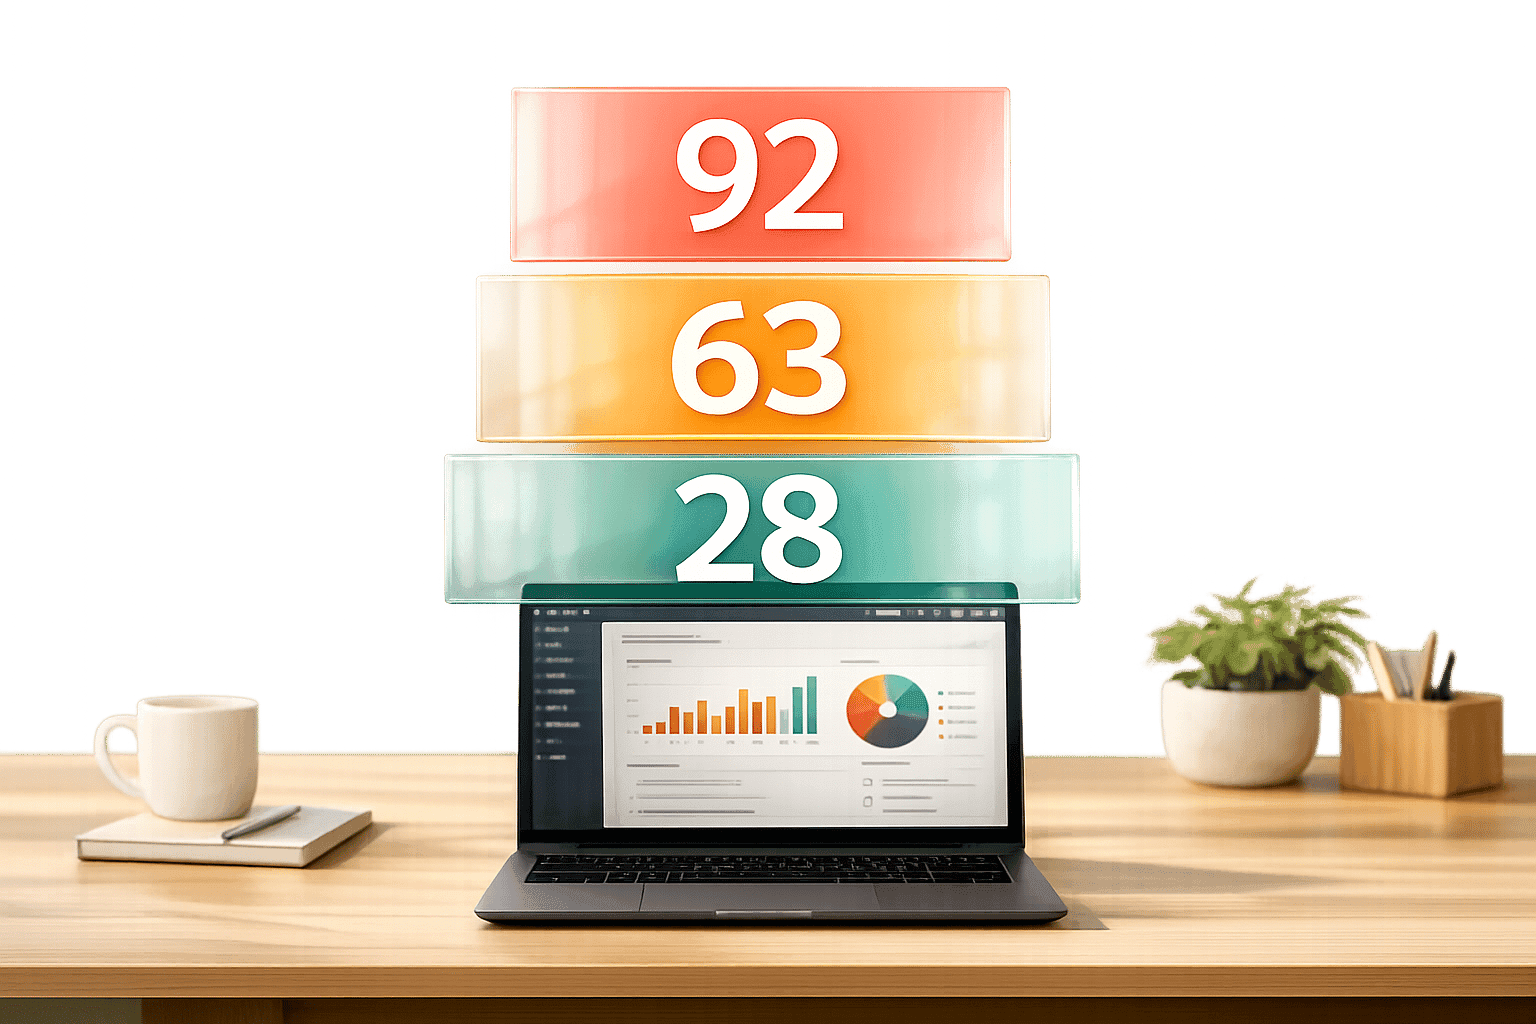
Assess the real impact of application errors. Analyze error frequency, affected components, and user impact to prioritize the fixes that matter most.
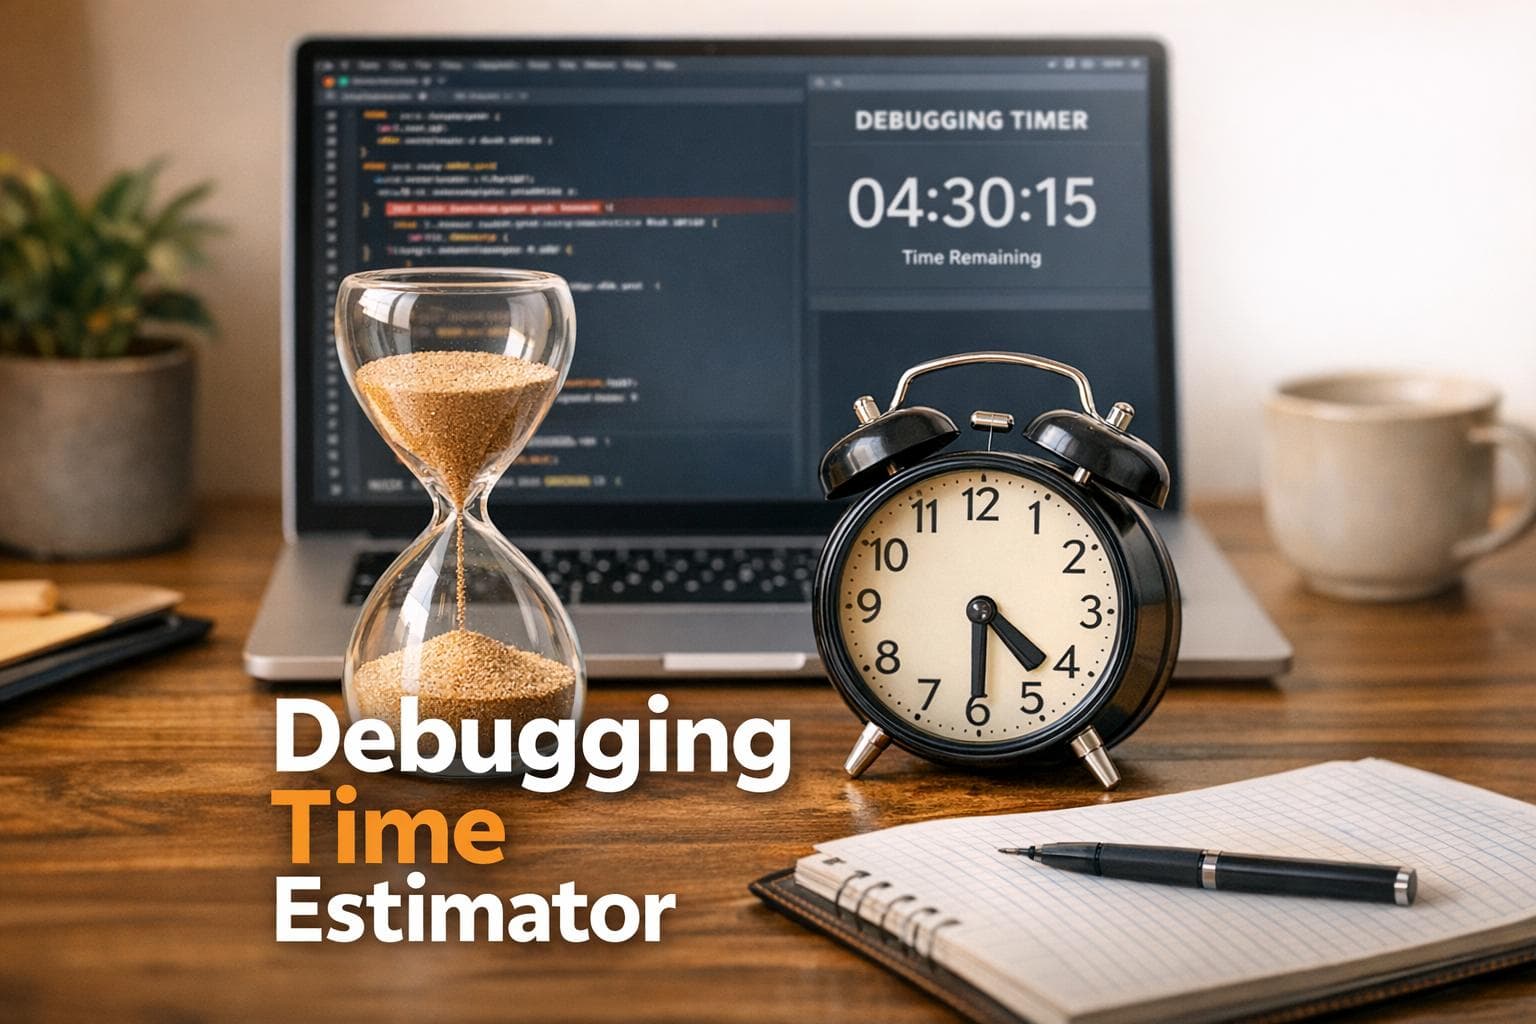
Estimate debugging time based on codebase size, error type, and complexity. Plan sprints better and prioritize the right bugs first.

Debug distributed systems on a budget. Practical strategies for small teams: observability basics, centralized logging, OpenTelemetry, and AI-assisted diagnosis.

Live breakpoints vs traditional debugging compared. When to use each for production issues, with side-by-side feature and performance analysis.

Practical RCA steps for production: define clear problems, collect logs and traces, map events, prioritize fixes, and validate changes with monitoring.
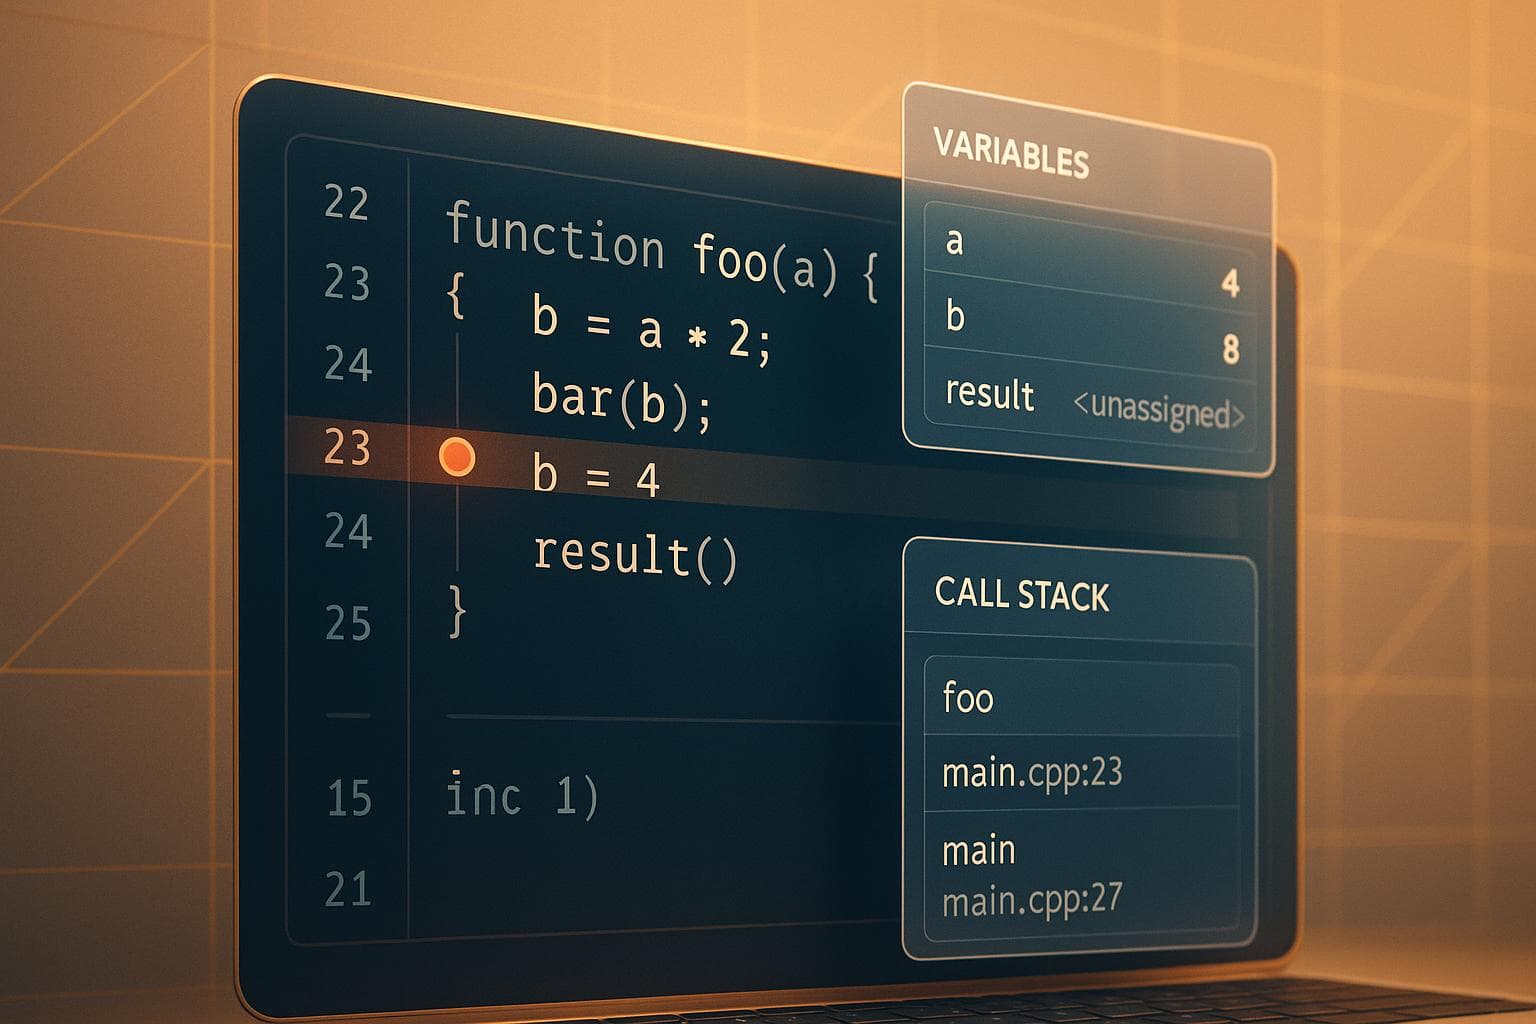
How live breakpoints work: debug production apps without pausing them. Capture variable snapshots, call stacks, and performance data in real time.
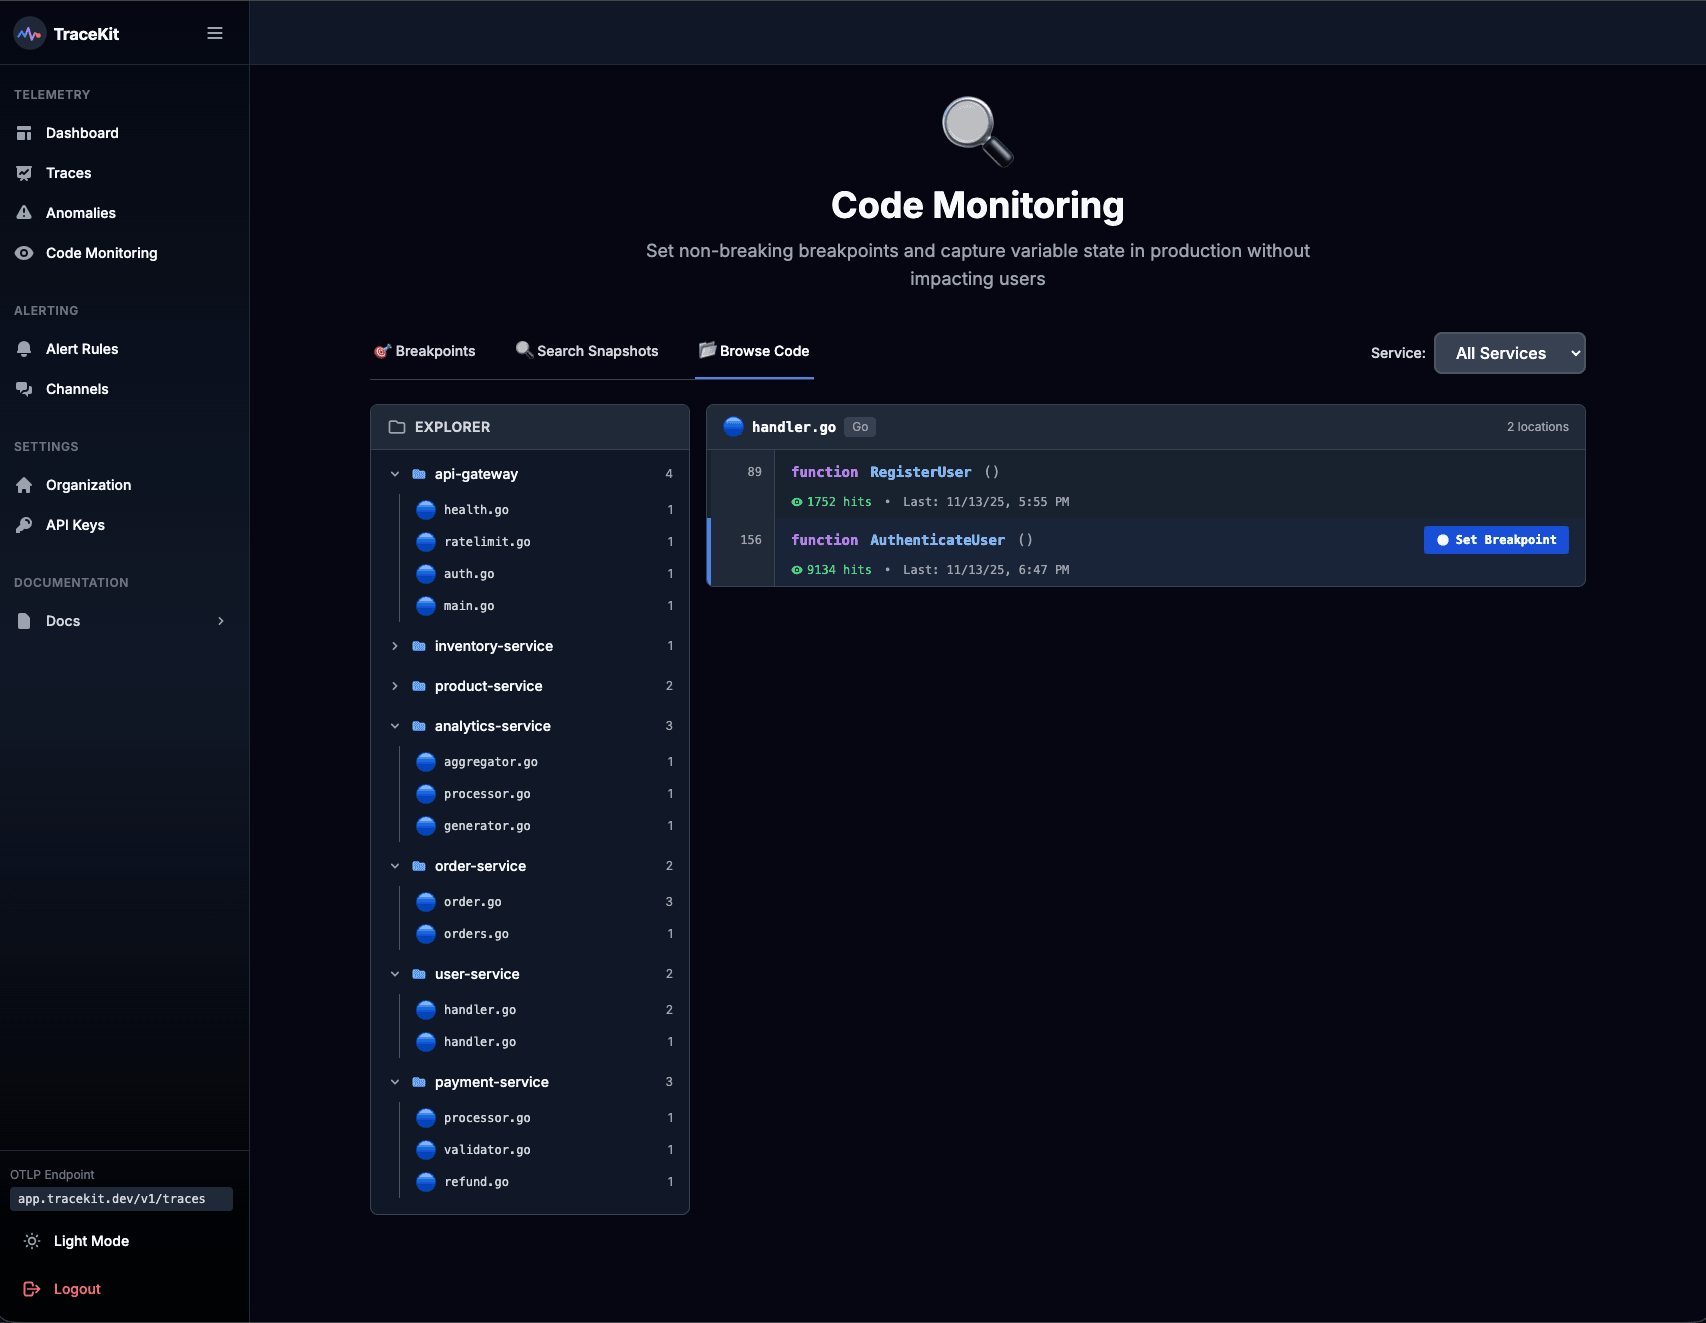
Debug production apps with dynamic logs and log points. Capture variable state without redeploying or stopping your application.