
Honeycomb APM for Small Teams: Querying vs Runtime State
Honeycomb APM explained for small teams: query-first observability, pricing tradeoffs, and when you still need runtime state to debug production.
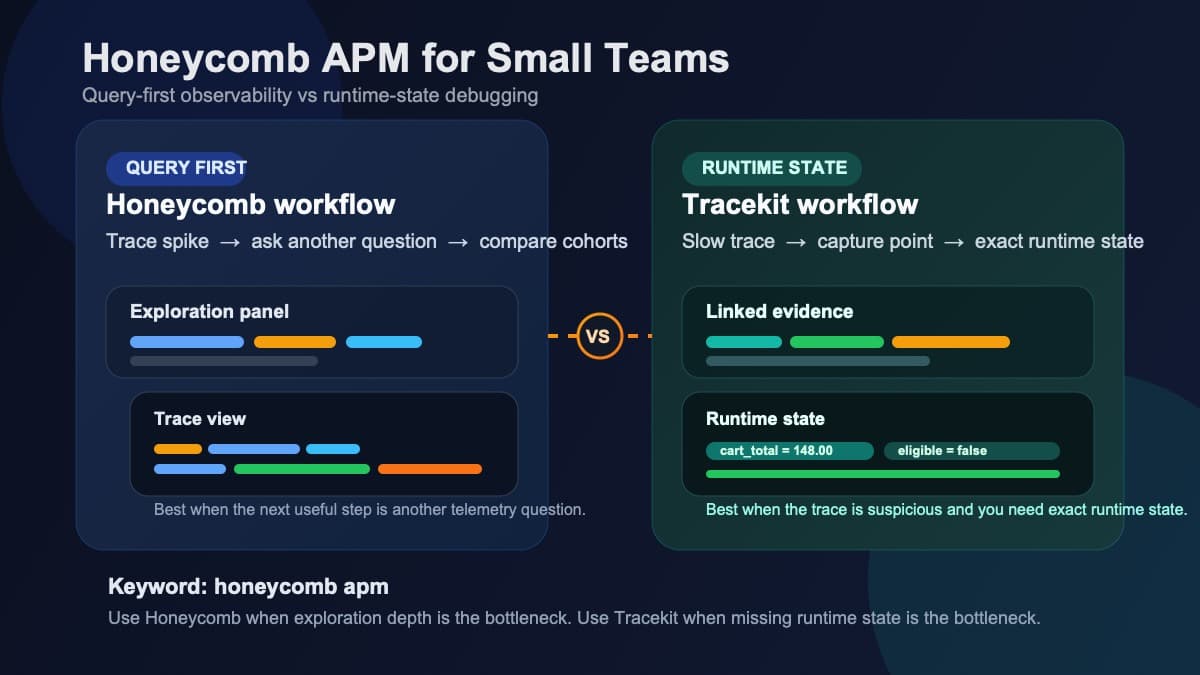
If you are evaluating Honeycomb APM for a small team, the real question is not whether Honeycomb is good. It is whether your team needs a query-first observability workflow or a faster path from a slow trace to runtime state.
Honeycomb is strong when you want to explore telemetry across many dimensions, especially in distributed systems where the next useful question is not obvious yet. Honeycomb's own platform copy says engineering teams use it to follow code into production, and its APM guide frames the job as answering whether the app works, how long it takes, and how the system fits together for each customer. But small teams also hit a different class of problem: the trace already shows the failing request, and now you need the exact variable values that caused it without adding more logs and waiting for another deploy.
This guide targets the current search intent behind honeycomb apm, and it is grounded in Tracekit's current product state, distributed tracing, dynamic logs docs, session replay docs, and pricing page, plus current official Honeycomb pages for pricing, APM, platform positioning, comparison positioning, and frontend error analysis.
The short answer
Choose Honeycomb if:
- Your team already thinks in terms of ad hoc exploration, high-cardinality queries, and tracing-first investigations.
- You want deep exploratory analysis across traces, logs, and metrics.
- Your biggest pain is finding the right slice of telemetry inside a complex distributed system.
Choose Tracekit if:
- You already found the slow or broken request and now need runtime state from live traffic.
- You want dynamic logs instead of another redeploy-and-retry cycle.
- You want session replay, backend traces, alerts, and runtime debugging in one simpler workflow.
- You care more about time to root cause and predictable cost than about unlimited exploratory querying.
What Honeycomb APM actually means
Honeycomb's own APM explanation is broader than the old "CPU and dashboard" interpretation of APM. Their guide describes APM as understanding whether the application works, whether anyone is using it, how long it takes, and how the software and infrastructure fit together. Their platform and comparison pages push that idea further: traditional APM is useful for breadth, but Honeycomb's differentiator is exploration depth.
That matters because the Honeycomb buying motion is not "replace every monitoring chart with a prettier chart." It is:
- Capture rich telemetry.
- Ask better questions about that telemetry.
- Pivot until the cause becomes obvious.
For the right team, that is powerful. If your engineers are already comfortable working from traces, dimensions, correlations, and query refinement, Honeycomb can feel like a better investigation surface than a conventional dashboard-heavy APM.
Where Honeycomb is genuinely strong
1. Query-first debugging
Honeycomb's own comparison positioning says traditional APM works for simple apps and predictable infrastructure, while modern observability needs flexible analysis. That is the core appeal: if the failure mode is unfamiliar, Honeycomb gives you room to ask new questions instead of staying inside pre-aggregated dashboards.
2. Distributed tracing as the center of the workflow
Honeycomb has long emphasized tracing, and their product material still centers distributed systems and production investigation. If your team lives inside service-to-service requests, latency spikes, and dependency analysis, that is a good fit.
3. Strong fit for observability-native teams
Honeycomb works best when:
- You instrument broadly with OpenTelemetry.
- You want to compare cohorts and outliers across many attributes.
- You expect investigations to move through multiple pivots before the answer is clear.
That is a real strength, not just marketing language.
Where small teams usually feel the tradeoff
1. The workflow assumes you can keep asking better telemetry questions
That is fine when the question is "which customer cohort is slow?" or "which span attributes correlate with failures?" It is less fine when the question is "what value was nil in this request?" or "which branch did this order-validation function take for this one failing customer?"
At that point, telemetry exploration is often no longer the bottleneck. The bottleneck is missing runtime state.
2. Pricing is no longer the old March-era comparison number
This is where older Honeycomb comparisons go stale quickly. Honeycomb's current pricing page says:
- Free: up to 20M events per month
- Pro: starting at $150/month
- Pro events: starting at $150 / 50M events
- Enterprise add-ons include frontend performance analysis
For small teams, that does not make Honeycomb unworkable. It does mean you should evaluate it as a real budget decision, not a lightweight side purchase.
3. Some frontend capabilities now exist, but they are not the main buying story
Honeycomb now has Frontend Observability and public-beta Error Analysis workflows. That is important because many older comparison pages still talk as if Honeycomb is backend-only.
But even in Honeycomb's own frontend messaging, the product story is still trace-first investigation and telemetry correlation. If your team wants a fast path from a broken frontend session to backend traces and then directly into live variable capture, you should compare that workflow against a tool built around session replay plus dynamic logs, not just against "frontend observability" as a category label.
Where Tracekit takes a different path
Tracekit is not trying to win by out-Honeycombing Honeycomb on exploratory querying. The product direction is different.
Tracekit connects:
- distributed traces
- dynamic logs
- session replay
- alerts
- releases
- runtime investigation
The important distinction is this:
Honeycomb helps you ask better questions about telemetry.
Tracekit helps you move from a suspicious trace to captured runtime state without redeploying.
That changes the debugging loop.
Example: checkout failures that do not throw
Suppose a checkout request returns 200, but the order never becomes chargeable because an eligibility flag is computed incorrectly in one code path.
With a query-first workflow, you might:
- Find the slow or suspicious traces.
- Compare attributes between good and bad requests.
- Narrow the issue to a service or code path.
- Add or wish for more application context.
With Tracekit, you can keep the trace investigation, then add a capture point on the validation branch and collect the exact runtime state from live traffic. That is the point where many small teams save hours.
A practical comparison for small teams
| Question | Honeycomb | Tracekit |
|---|---|---|
| What is the core workflow? | Query-first observability | Trace + runtime-state debugging |
| Best when | You need flexible telemetry exploration | You need root-cause evidence from live code paths |
| Strongest technical center | High-cardinality analysis and trace-driven pivots | Dynamic logs, capture points, traces, and replay together |
| Frontend story | Frontend Observability exists, with enterprise add-on language on pricing | Session replay and browser-to-backend workflow are built into the product story |
| Price to sanity-check first | Free, then Pro starting at $150/month | Free tier, then paid plans from $29/month |
| Best fit | Observability-mature teams | Small teams that want fewer tool handoffs |
When Honeycomb APM is the right choice
Honeycomb is the better choice when:
- You already have strong OpenTelemetry discipline.
- Your team is comfortable exploring telemetry without guardrails.
- The failure modes you care about are usually solved by better slicing, correlation, and comparison.
- You are happy to optimize around event volume and observability workflow depth.
When Honeycomb APM is not enough on its own
Honeycomb is often not enough on its own for a small team when:
- The trace tells you where to look, but not what value caused the bug.
- You are tired of adding more logs for one-off investigations.
- You need frontend context, backend traces, and runtime-state capture in one debugging path.
- Your team would rather ship faster than become experts in telemetry exploration.
That does not mean Honeycomb is weak. It means its strength is different from the strength most small teams are actually buying for.
A better buying question
Do not ask:
"Is Honeycomb a real APM?"
Ask:
"When production breaks, do we lose time because we cannot explore telemetry deeply enough, or because we cannot inspect runtime state fast enough?"
If the answer is the first one, Honeycomb deserves a close look.
If the answer is the second one, Tracekit is usually the faster fit.
What I would do if I were evaluating Honeycomb APM today
- Run one real production incident through a Honeycomb-style workflow.
- Note how long it takes to get from the first suspicious trace to a confident root cause.
- Repeat the same evaluation with Tracekit using distributed tracing, dynamic logs, and session replay.
- Compare the number of tool hops, redeploys, and unanswered questions.
That side-by-side workflow test is usually more revealing than any feature matrix.
Final verdict
honeycomb apm is a worthwhile keyword because the searcher is usually not asking for a definition. They are trying to decide whether Honeycomb's style of observability is the right operational shape for their team.
Honeycomb is compelling when you want deep exploratory analysis.
Tracekit is compelling when you want faster evidence from live runtime state.
For small teams, that distinction is usually the whole decision.
Related Posts
Your API Just Threw a 500. Here's How to Actually Fix It.
Your API threw a 500 at 3 AM. A systematic approach to diagnose, trace, and fix production API errors without the panic and guesswork.

Sentry vs TraceKit: Error Tracking vs Full Debugging
Sentry vs TraceKit compared: error tracking vs full production debugging. Feature-by-feature comparison with pricing, setup time, and use case guidance.

Best Datadog Alternatives Under $50/Month (2026)
5 Datadog alternatives under $50/month for startups. Compare TraceKit, Highlight.io, HyperDX, OpenObserve, and SigNoz on features, pricing, and setup.