
Laravel OpenTelemetry Tracing: Production Setup
Add OpenTelemetry tracing to Laravel with verified request, database, queue, and HTTP client spans, plus production checks for trace gaps.
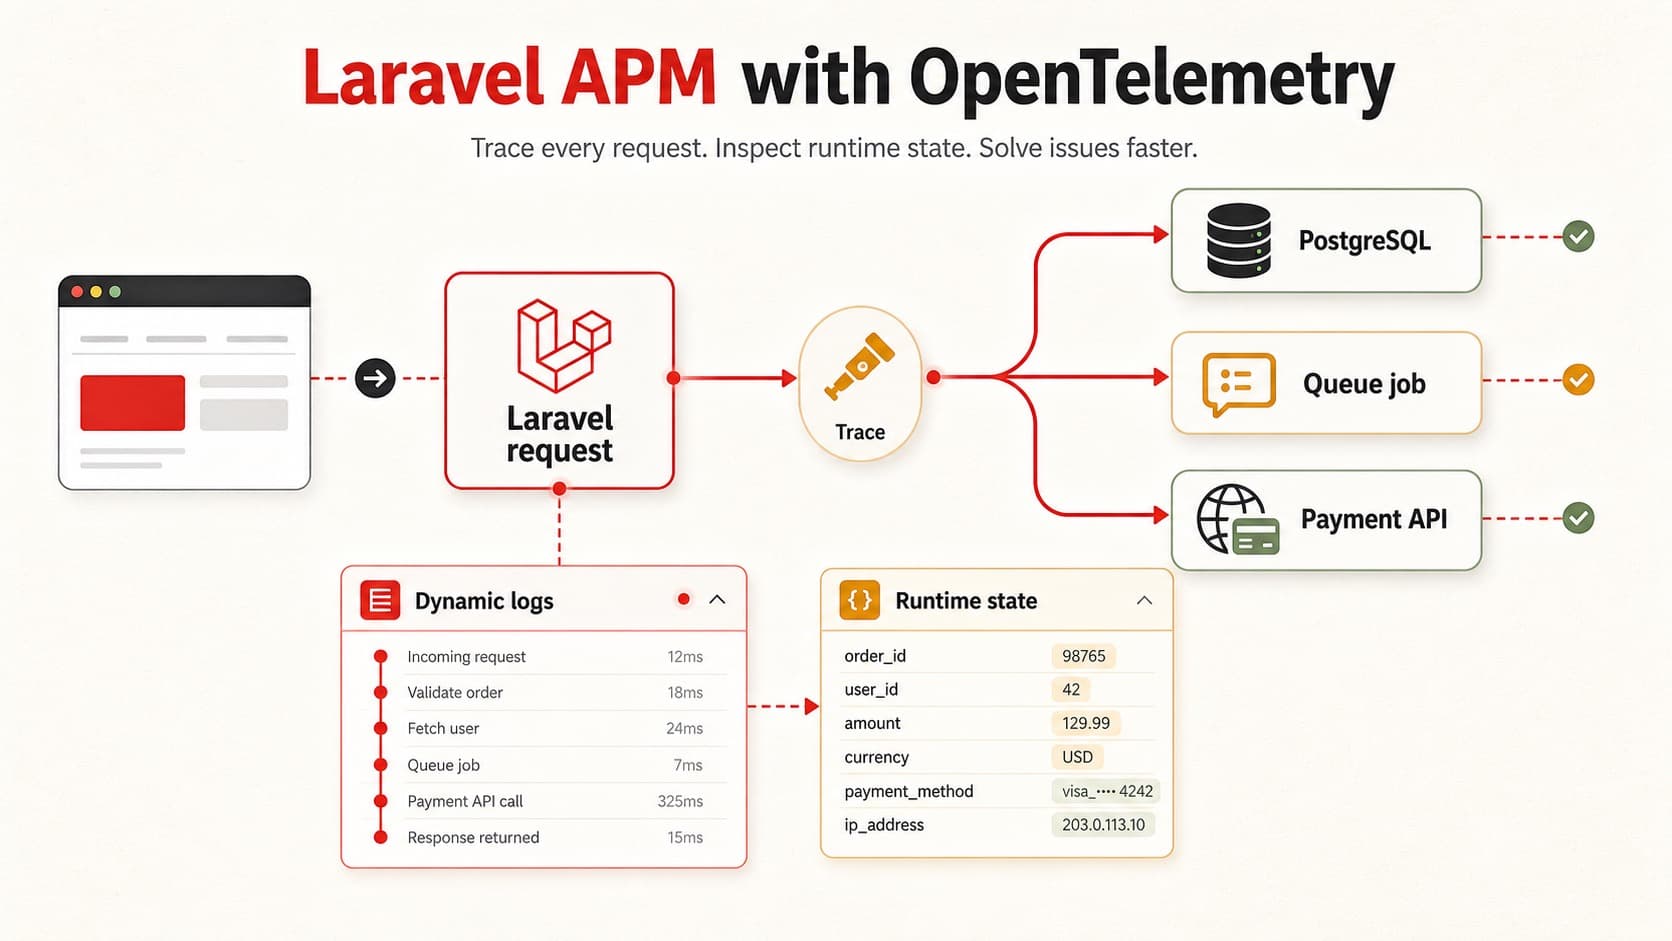
To add OpenTelemetry tracing to Laravel, install one tracing path, configure an OTLP destination, and verify every application boundary. A complete setup must cover requests, database queries, queue jobs, and outbound HTTP calls.
This guide uses Tracekit's current Laravel package for the working setup. It also explains the official OpenTelemetry PHP path. Most importantly, it shows where automatic spans stop and manual context propagation begins.
Choose one Laravel OpenTelemetry setup path
Do not install two tracing SDKs without a clear ownership plan. Duplicate middleware can create duplicate spans and conflicting global providers.
| Path | Best fit | Main components |
|---|---|---|
| Tracekit Laravel package | You want Laravel tracing and a managed OTLP backend | tracekit/laravel-apm, Laravel service provider, OTLP exporter |
| Official OpenTelemetry PHP | You want to select every SDK and exporter component | PHP extension, SDK, exporter, Laravel instrumentation library |
The official OpenTelemetry PHP library guide confirms that Laravel instrumentation creates spans from application activity. Its Laravel package requires the OpenTelemetry PHP extension.
The rest of this guide follows the Tracekit path. The same verification method also applies to an official OpenTelemetry setup.
1. Check the Laravel tracing prerequisites
The current Tracekit package supports PHP 8.1 or later and Laravel 10, 11, or 12.
Before installation, confirm the runtime:
php -v
php artisan --version
composer --version
You also need a Tracekit API key. Keep that key in your deployment secret store. Never commit it to Git.
If you use the official OpenTelemetry path, check the current OpenTelemetry PHP requirements. Auto-instrumentation needs the opentelemetry PHP extension.
2. Install OpenTelemetry tracing for Laravel
Install the Tracekit Laravel package:
composer require tracekit/laravel-apm
php artisan tracekit:install
Laravel package discovery registers TraceKit\Laravel\TracekitServiceProvider. The provider creates an OpenTelemetry tracer and an OTLP HTTP exporter.
Add the minimum production settings:
TRACEKIT_API_KEY=ctxio_your_api_key
TRACEKIT_SERVICE_NAME=checkout-web
TRACEKIT_ENABLED=true
Keep TRACEKIT_SERVICE_NAME stable for each deployable service. A stable name makes trace searches and service maps useful.
Clear cached configuration after an environment change:
php artisan config:clear
Use the Laravel integration guide for every package option. Use the OTel config generator when you manage a separate Collector.
3. Confirm the request middleware
The package service provider adds TracekitMiddleware to Laravel's web and api middleware groups. Each accepted request can create a server span.
The middleware records these values:
- HTTP method
- full URL
- route
- status code
- request duration
- selected client metadata
It also extracts an incoming W3C traceparent header. This keeps a Laravel request inside an existing distributed trace.
Laravel 12 changed middleware configuration. If automatic registration fails, add the middleware in bootstrap/app.php:
<?php

use Illuminate\Foundation\Application;
use Illuminate\Foundation\Configuration\Middleware;
use TraceKit\Laravel\Middleware\TracekitMiddleware;

return Application::configure(basePath: dirname(__DIR__))
    ->withMiddleware(function (Middleware $middleware) {
        $middleware->web(append: [
            TracekitMiddleware::class,
        ]);
        $middleware->api(append: [
            TracekitMiddleware::class,
        ]);
    })
    ->create();
Make one request to a real application route. Then confirm a server span appears with the expected route and service name.
4. Verify each automatic Laravel span
Installation is not complete when only one request span appears. Test each enabled integration separately.
| Application action | Expected evidence | Current package behavior |
|---|---|---|
| Open a Laravel route | Server span | Automatic through TracekitMiddleware |
| Run an Eloquent query | Database span | Automatic through QueryListener |
| Process a queue job | Job trace | Automatic through JobListener |
Use Laravel Http facade | Client span | Automatic through HTTP client events |
| Throw an exception | Exception event | Recorded on the active span |
Run one controlled action for each row. Record the expected route, query, job, and destination before each test.
This method finds silent tracing gaps. A green application health check does not prove that every integration works.
5. Protect database values before production
The database listener can include query bindings in db.statement. Bindings can contain customer data or internal identifiers.
Start with query bindings disabled:
TRACEKIT_DATABASE_ENABLED=true
TRACEKIT_INCLUDE_BINDINGS=false
TRACEKIT_SLOW_QUERY_MS=100
Enable bindings only after a data review. Use test data during verification.
The slow-query threshold marks queries above the configured duration. It does not detect every database problem.
Repeated fast queries can still create an N+1 regression. Use the N+1 query regression guide for that workflow.
6. Treat queue jobs as a trace boundary
Laravel queues move work into another execution unit. The official Laravel queue guide documents these worker and transaction boundaries.
The current Tracekit JobListener creates a trace when a job starts. It records the job name, connection, queue, attempts, status, and failure details.
However, it does not link the job to the request that dispatched it. The job appears as a separate trace.
Use this queue verification checklist:
- Dispatch one successful job.
- Dispatch one controlled failing job.
- Confirm both job traces appear.
- Confirm the failed trace contains the exception.
- Confirm the job name and queue match Laravel.
- Add explicit context propagation when request-to-job linkage matters.
The W3C Trace Context specification defines interoperable trace identifiers. Your queue payload must carry safe context before a worker can continue the same trace.
Do not place secrets or complete request payloads in trace attributes or queue context.
7. Verify outbound HTTP propagation separately
The current package listens to Laravel HTTP client events. It creates a client span with the method, URL, status, and peer service.
The listener does not rewrite the built request. It therefore does not inject traceparent into outbound headers automatically.
This distinction matters:
| Check | What it proves |
|---|---|
| A client span exists | Laravel recorded the outbound call |
| The next service has the same trace ID | Context crossed the network boundary |
Test both checks. A client span alone does not prove distributed propagation.
Use an OpenTelemetry propagator or a reviewed HTTP wrapper to inject W3C context before sending the request. Then verify the receiving service extracts it.
If your application uses Guzzle directly, verify that client separately. Laravel HTTP event listeners do not cover every third-party client.
8. Add spans for important business work
Automatic instrumentation shows framework activity. It cannot name every important business operation.
Add a manual span around a small, stable operation:
<?php

namespace App\Services;

use TraceKit\Laravel\TracekitClient;

final class CheckoutService
{
    public function __construct(
        private TracekitClient $tracekit,
    ) {}

    public function reserveInventory(string $orderId): void
    {
        $span = $this->tracekit->startSpan(
            'checkout.reserve_inventory',
            null,
            ['order.id' => $orderId],
        );

        try {
            $this->reserve($orderId);
            $this->tracekit->endSpan($span);
        } catch (\Throwable $error) {
            $this->tracekit->recordException($span, $error);
            $this->tracekit->endSpan($span, [], 'ERROR');
            throw $error;
        }
    }
}
Use low-cardinality attributes. Avoid passwords, tokens, payment values, email addresses, and full payloads.
9. Add runtime state only when traces need it
Traces show execution paths and duration. They do not always show why code selected the wrong branch.
Tracekit dynamic logs add bounded runtime state through capture points. They are not general log ingestion.
Enable the feature:
TRACEKIT_CODE_MONITORING_ENABLED=true
TRACEKIT_CODE_MONITORING_POLL_INTERVAL=30
The public term is dynamic logs. The current Laravel helper keeps its internal method name:
tracekit_snapshot('checkout-validation', [
    'order_id' => $order->id,
    'items_count' => $order->items->count(),
    'inventory_region' => $inventoryRegion,
]);
Use an allowlist of safe values. See the dynamic logs guide for conditions, capture limits, and the service kill switch.
10. Run a production tracing acceptance test
Test a staging or controlled production flow before you trust the setup.
- The request creates one server span.
- The route uses a stable name.
- Database queries appear without sensitive bindings.
- The slow-query threshold behaves as expected.
- A successful queue job creates a completed job trace.
- A failed queue job records its exception.
- An outbound Laravel HTTP call creates a client span.
- A propagated call keeps the same trace ID across services.
- A manual business span appears under the active request.
- A safe capture point records only approved runtime state.
Also test sampling. TRACEKIT_SAMPLE_RATE=1.0 captures all eligible requests during initial verification.
Reduce sampling only after you prove the full path. Sampling can hide rare errors and make setup failures harder to distinguish.
Troubleshoot missing Laravel traces
Use this order:
- Run
php artisan config:clear. - Confirm
TRACEKIT_ENABLED=true. - Confirm the API key exists in the runtime environment.
- Confirm
TRACEKIT_SERVICE_NAMEmatches your search filter. - Confirm the route is not in
ignored_routes. - Confirm the relevant feature flag is enabled.
- Review
storage/logs/laravel.logfor exporter errors. - Make one known request and search for its route.
If only child spans are missing, test that integration directly. If the next service starts another trace, inspect context injection first.
Where Tracekit fits
Tracekit combines OTLP traces with errors, alerts, releases, and dynamic logs. It does not replace Laravel's logger or your queue system.
Use Tracekit when you need these connected questions:
- Which request or job failed?
- Which database query or HTTP call consumed the time?
- Did the problem start after a release?
- What safe runtime state explains the failure?
Start with the Laravel integration guide. Then use distributed tracing and trace-based alerts to operate the setup.
The final goal is not more telemetry. The goal is one verified trace path from the user request to the failing operation.
Related Posts
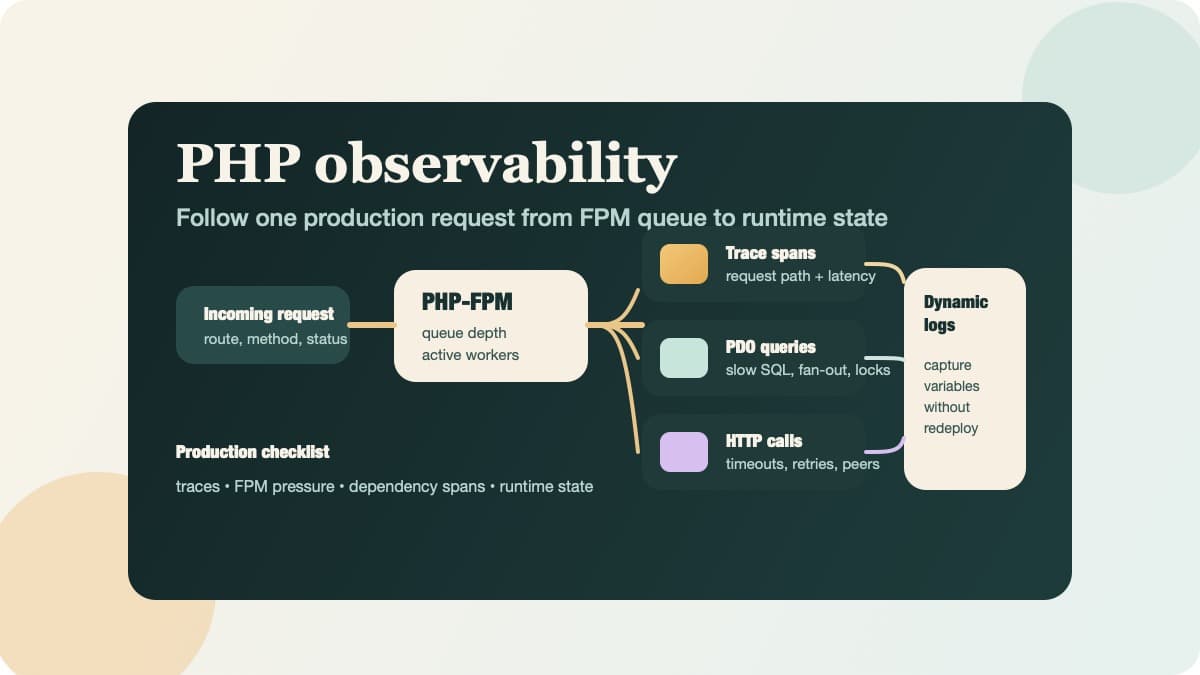
PHP Observability Checklist for Production Apps
Use this PHP observability checklist to trace requests, surface PDO and HTTP bottlenecks, and inspect runtime state without redeploying.
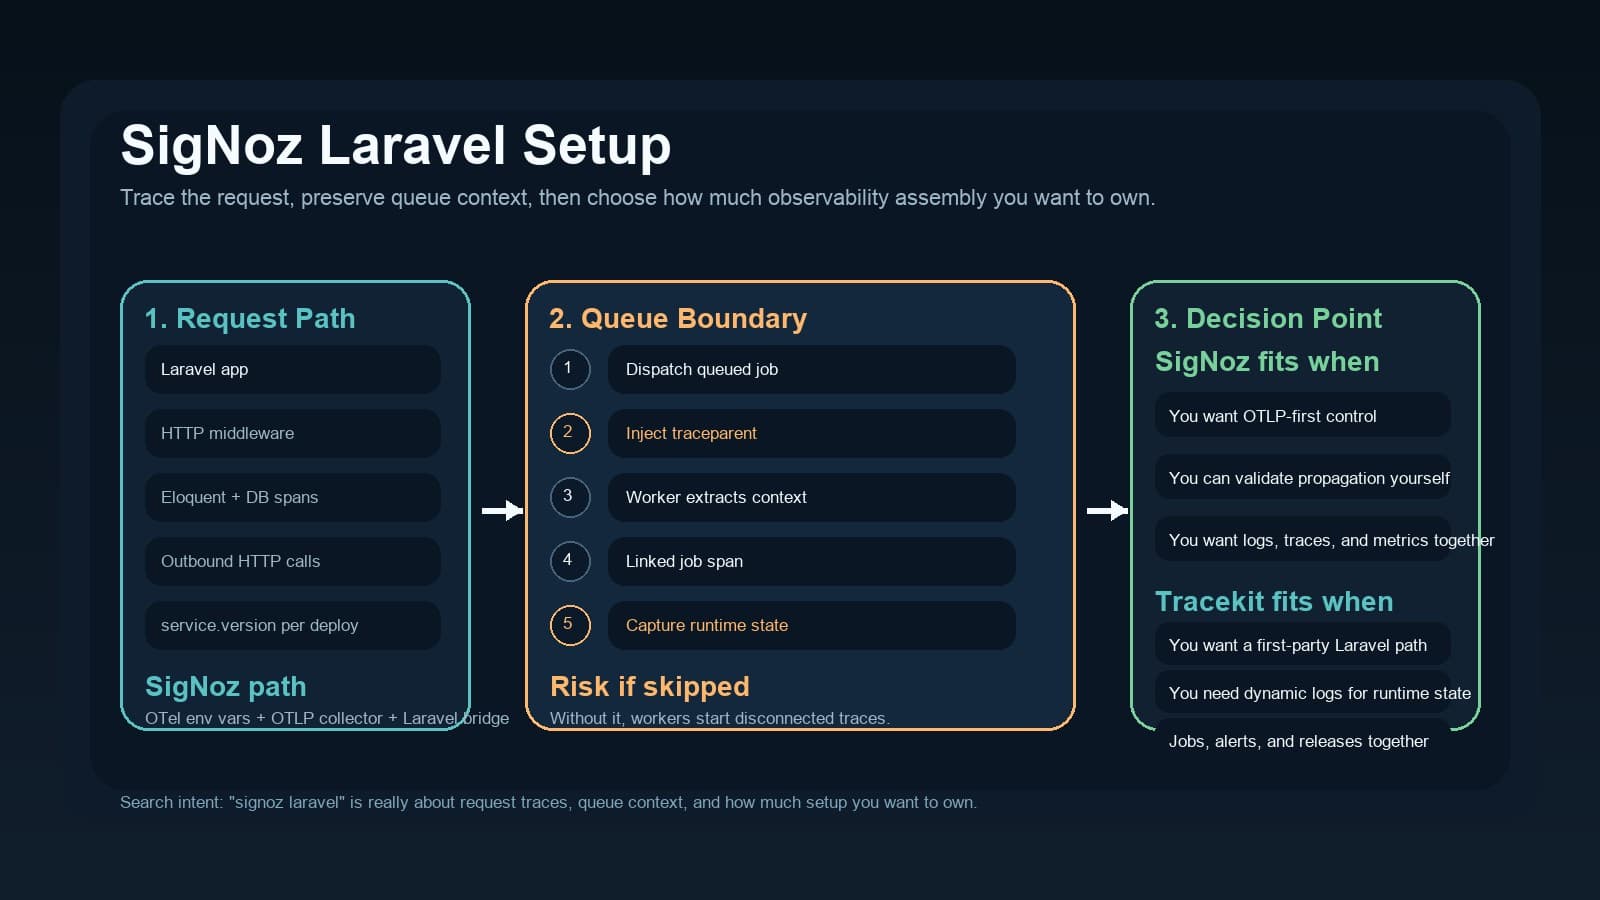
SigNoz Laravel Setup: OpenTelemetry, Queue Context, and a Managed APM Alternative
Use this SigNoz Laravel guide to wire OpenTelemetry, keep queue context intact, and compare that setup with a managed Laravel APM path.
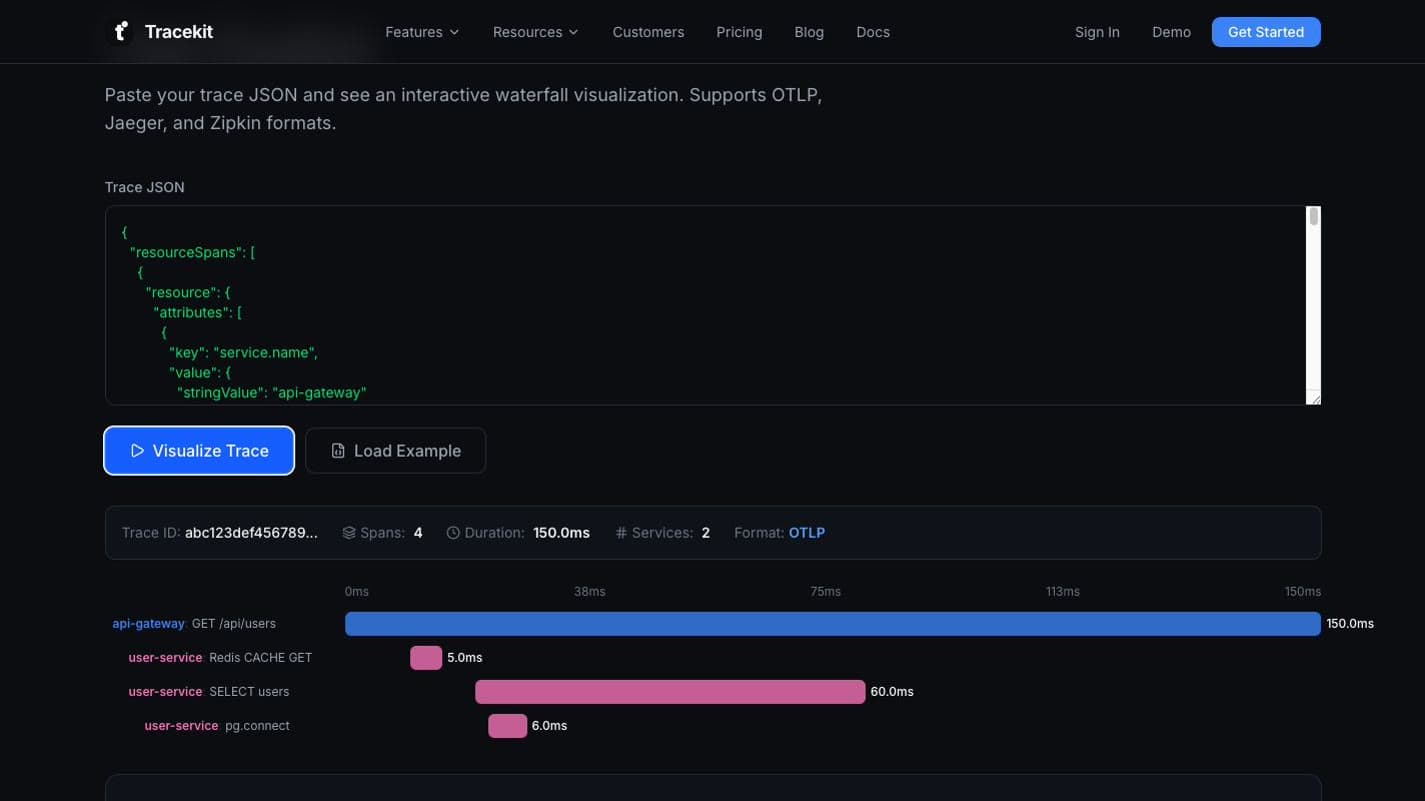
How to Visualize OpenTelemetry Traces Online
Visualize OpenTelemetry traces online, read the waterfall, fix export errors, and choose the right OTel trace viewer for each debugging job.