
N+1 Query Detection: Find and Fix Regressions
Detect N+1 queries with query counts and traces. Find repeated database calls, fix ORM loading, and verify the result in production.
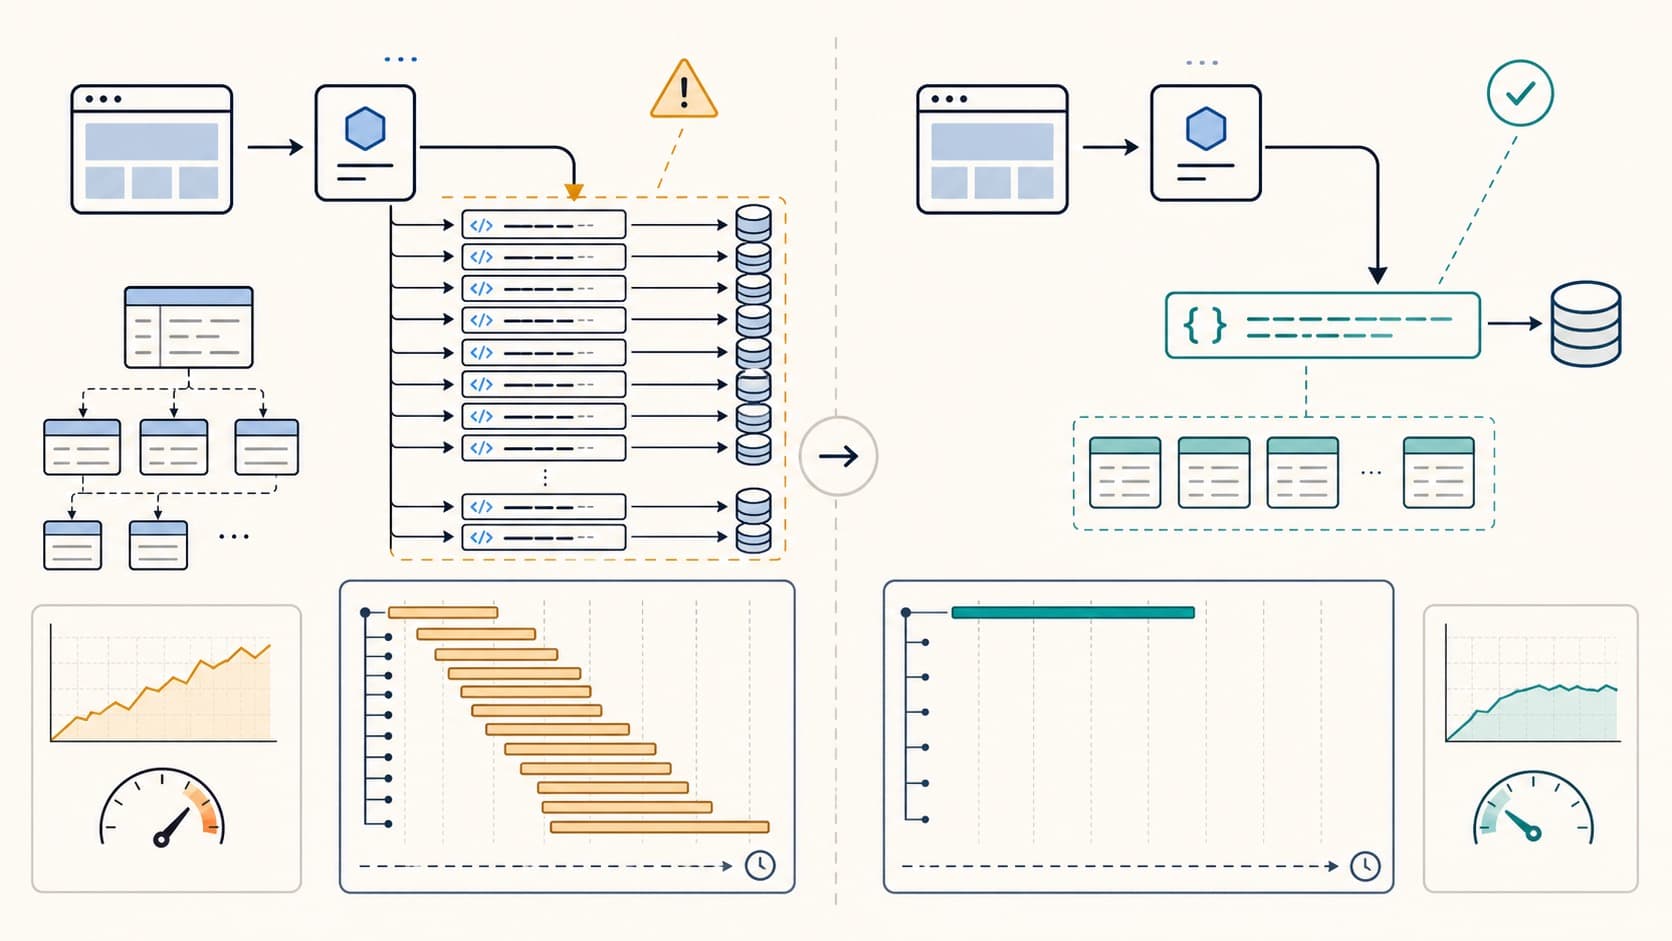
N+1 query detection starts with one check: does the number of database queries grow with the number of records returned? A request that loads 50 posts might make one list query and 50 author queries. A request with eager loading can often fetch the same data with two queries. Those counts are an example, not a target for every application.
Use a query count in a test to catch this pattern before release. Use a request trace to find it in production. This guide shows how to confirm the cause, fix ORM loading, and verify the result. It uses Tracekit's current distributed tracing, dynamic logs, Laravel integration guide, and Python integration guide. The technical model follows OpenTelemetry traces, database client span conventions, Laravel eager loading, and Django's query optimization guidance.
Choose an N+1 Query Detection Method
N+1 query detection methods include framework tools, static checks, and production tracing. Each method answers a different question.
| Method | What it shows | Best use | Limit |
|---|---|---|---|
| Query count in a test | Whether one fixture triggers repeated queries | Prevent a known regression | A fixture can miss production input shapes |
| Lazy-loading warning or static check | A likely relation access in code | Find risky paths before release | It cannot prove production impact |
| Request trace with database spans | Repeated calls within one real request | Find the affected route and release | Missing instrumentation or sampling can hide queries |
| Database query log | Statements issued by one process | Inspect exact SQL during a controlled test | It needs request context to identify the user-facing path |
Start with a representative list request at two sizes, such as 5 and 50 records. Count database calls for both sizes. A count that rises roughly one-for-one with the list size warrants inspection. Then inspect the repeated query and its relation access. A higher count alone does not prove an N+1 problem.
Use Execution Traces to Find N+1 Query Regressions
Use two comparable request traces. Pick one trace from a known healthy release and one from the suspected release. Keep the route, input size, tenant type, and feature flags as similar as possible.
Then use this workflow:
- Find the parent request span for the affected route or job.
- Count database spans under the same request branch.
- Group repeated spans by
db.query.summarywhen your instrumentation provides it. - Otherwise, compare the database operation and target, such as
SELECTon one collection. - Check whether the repeated span count grows with the parent record count.
- Link the first bad trace to its release or deployment window when release metadata is available.
- Fix the load pattern and capture the same request again.
OpenTelemetry defines db.query.summary as a low-cardinality query class and a useful grouping key. This is safer than treating every raw query string as a separate pattern.
Some instrumentation records db.statement or db.query.text instead. Query values can change between calls. Group by a stable operation and target when no safe query summary is available. Confirm that database instrumentation is active before drawing a conclusion from an empty trace.
| Evidence | Healthy release | Regressed release |
|---|---|---|
| Request route and input | Same route and representative list size | Same route and comparable list size |
| Database span shape | One parent query plus a small fixed set | One parent query plus one repeated span per record |
| Query group count | Stable as the list grows | Grows with the list size |
| Release context | Known good version or deployment window | First version or window with the changed shape |
| Proof after the fix | Fixed span count | Fan-out no longer appears |
Do not compare unrelated requests. A trace with more records can contain more legitimate work. The regression claim is defensible only when the input and code path are comparable.
What N+1 Query Detection Should Reveal
An N+1 problem is not just "too many queries." It is a specific fan-out pattern:
- One request loads a parent list.
- Application code loops through that list.
- Each iteration triggers another database query for related data.
In production, that usually appears as one route or handler producing a cluster of very similar database spans under the same request trace.
| What you see in the trace | What it usually means | What to do next |
|---|---|---|
| One HTTP span followed by dozens of short DB spans with similar timing | Lazy-loaded relation or repeated lookup inside a loop | Inspect the ORM query path and eager-load the relation |
| Total database time dominates the request, even though no single query looks dramatic | Query fan-out is the latency source, not one obviously bad query | Count repeated spans and group them by code path |
| The route regressed after a deploy | A template, serializer, relation access, or controller change introduced lazy loading | Compare the release and inspect the code change first |
| The trace shows the hot path but not why the branch loaded extra data | The relation access is conditional or tenant-specific | Add a bounded dynamic log on the suspicious path |
The point of detection is to move from "the page is slow" to "this relation access caused one extra query per parent record."
How to Spot N+1 Query Fan-Out in a Trace
The OpenTelemetry trace model shows one request as a tree of spans. When database instrumentation is active, N+1 patterns are often visible without custom detectors:
- one root request span
- one controller, handler, or service span branch
- many repeated DB spans with the same statement family or relation lookup pattern
- database time that scales with collection size
For Tracekit users, the shortest workflow is:
- Open the slow request in distributed tracing.
- Look for repeated database spans under one route or job.
- Check whether the same route regressed after a release.
- Compare a similar trace from before the suspected release.
- Confirm the code path in your ORM or serializer before changing SQL.
If you only have a raw exported trace, start with the OTel trace viewer guide. The important question is still the same: did one request branch trigger repeated database work that should have been batched or preloaded?
A Practical N+1 Query Detection Workflow
1. Start with the user-facing request
Find the exact route, background job, or API handler users are complaining about first. N+1 fixes are easier when you anchor them to one bad transaction instead of general database load.
Good starting questions:
- Which endpoint or page template got slower?
- Did the slowdown start after a deploy?
- Does the problem happen for large collections only?
- Is the route reading related objects inside a serializer, resource, template, or loop?
Tracekit can help here because it receives route-level traces and instrumented database spans. Release metadata can narrow the deployment window when it is present. Dynamic logs can then answer a remaining runtime-state question.
2. Verify that the repeated spans belong to one data access pattern
Not every "many queries" trace is an N+1 problem. Some workloads legitimately execute several different queries. The N+1 smell is repetition.
Look for:
- repeated
SELECTspans that differ only by bound ID - one query per parent row
- query count scaling with page size or list length
- the same relation being loaded from inside a loop
Tracekit's Laravel integration automatically creates database spans. Other frameworks need compatible database instrumentation or manual spans. Confirm this coverage before you treat a missing span as proof that no query ran.
Prefer a low-cardinality group such as db.query.summary. If that attribute is unavailable, use stable operation and target fields. Raw query text can contain changing values, so it can split one query class into many apparent groups.
3. Fix the load pattern, not just the slowest query
The durable fix is usually one of these:
- eager loading a relation
- batching related records
- reshaping the query with a join or prefetch
- reducing the fields or rows retrieved
- moving derived calculations into one grouped query
Developers sometimes waste time micro-optimizing a single repeated query that should not be repeated at all. If the application made 101 acceptable queries instead of 2 acceptable queries, the structure is the bug.
4. Re-run the trace after the code change
A correct fix should change the shape of the trace, not just shave a few milliseconds.
The before-and-after pattern should look more like:
| Before | After |
|---|---|
| One request + 50 nearly identical DB spans | One request + 1-3 broader DB spans |
| Database time grows with list size | Database time grows much more slowly |
| Noisy trace that hides the real bottleneck | Cleaner trace that exposes the next constraint |
If the request is still slow after the fan-out disappears, the trace will usually show the next bottleneck much more clearly.
5. Add a regression guard
Production traces prove the observed behavior. A test or query budget helps stop the same bug from returning.
Choose a guard that matches the framework:
- assert a maximum query count for a representative list request
- fail when lazy loading occurs in development or tests
- run the endpoint with realistic collection sizes
- compare trace shape for one stable fixture before release
Keep the budget specific to one route and fixture. A global query-count limit becomes noisy and hides useful changes.
Laravel Example: Replace Lazy Loading with Eager Loading
Laravel's official Eloquent relationship docs are explicit: eager loading reduces the number of SQL queries required to load related models. That is the first fix to test when a trace shows one relation being loaded over and over.
// Bad: one query for posts, then one per author access.
$posts = Post::latest()->take(50)->get();

foreach ($posts as $post) {
    echo $post->author->name;
}
// Better: load the relation up front.
$posts = Post::with('author')
    ->latest()
    ->take(50)
    ->get();

foreach ($posts as $post) {
    echo $post->author->name;
}
For list pages with several relations, expand the same pattern:
$posts = Post::with(['author', 'comments'])
    ->latest()
    ->take(50)
    ->get();
Use Tracekit's Laravel integration guide when you want route and database spans together, and keep the Laravel observability guide nearby if the page also depends on queue jobs or outbound HTTP calls.
Django Example: Use select_related() or prefetch_related()
Django's ORM gives you two different fixes depending on the relationship shape:
select_related()for single-valued relations such asForeignKeyprefetch_related()for multi-valued relations such as reverse relations or many-to-many sets
# Bad: repeated author lookups during iteration.
posts = Post.objects.order_by("-created_at")[:50]

for post in posts:
    print(post.author.name)
# Better: load the author relation with the posts query.
posts = (
    Post.objects.select_related("author")
    .order_by("-created_at")[:50]
)

for post in posts:
    print(post.author.name)
If the expensive relation is a collection, prefetch it instead:
posts = (
    Post.objects.prefetch_related("comments")
    .order_by("-created_at")[:50]
)
Tracekit's Python integration guide is the relevant product reference here. The product truth to keep in mind is simple: tracing can show the repeated database work, but the ORM fix still belongs in your Django query shape.
When Trace Data Is Not Enough
Sometimes the trace makes the hot path obvious, but you still need to know why the relation access happened on that request and not others.
That is where Tracekit dynamic logs fit:
- they are bounded capture points, not generic log ingestion
- they let you inspect runtime state on the suspicious path
- they help when the extra query depends on a serializer flag, tenant rule, feature flag, or conditional branch
Good N+1 debugging use cases include:
- a relation only loads for premium accounts
- a serializer toggles nested includes conditionally
- a template branch accesses one more relation than expected
- a background job expands the same lookup repeatedly for one batch size
The public workflow should stay clear here: traces show where repeated database work happened; dynamic logs help explain the runtime state that triggered it.
Prevent N+1 Regressions Before the Next Deploy
Production detection is important, but prevention is cheaper.
Use this checklist before a meaningful release:
- Review list endpoints, dashboard queries, and serializers for lazy relation access.
- Trace a representative request with realistic collection sizes.
- Confirm important database spans appear in the trace when instrumentation is enabled.
- Compare request shape before and after query or template changes.
- Check whether one deploy introduced new repeated spans on a hot route.
- Add a route-specific query budget or lazy-loading guard.
- Add a bounded dynamic log only when the trace still leaves a state question unanswered.
This matters because N+1 bugs often arrive through harmless-looking changes: a new column in a template, a nested resource, an extra policy check, or a serializer field that touches one more relation.
Where Tracekit Fits
Tracekit is useful for N+1 query detection when you need production context, not just raw query counts.
| Need | Start here |
|---|---|
| See the slow request and repeated DB spans | Distributed tracing |
| Inspect runtime state on the suspicious path | Code Monitoring docs |
| Instrument a Laravel service | Laravel integration guide |
| Instrument a Python service | Python integration guide |
| Inspect a raw exported trace payload | OTel trace viewer guide |
The main distinction is important: Tracekit is not a generic log-ingestion product. It also does not label every N+1 regression automatically. The value comes from connecting one slow request to repeated database spans and relevant release context. Dynamic logs can then capture the runtime state needed to confirm the cause.
Final Checklist for N+1 Query Detection
Before you call the incident understood, make sure you can answer:
- Which exact route, job, or page produced the repeated queries?
- Which relation or lookup pattern caused the fan-out?
- Did the fix change the trace shape, not just one query duration?
- Do realistic collection sizes still behave well?
- If the trace was not enough, did you inspect runtime state safely and temporarily?
That is the bar for useful N+1 query detection in production: not just spotting many queries, but finding the code path that caused them and verifying the fan-out is actually gone.
Related Posts

FastAPI Tracing with OpenTelemetry: A Practical Setup
Set up FastAPI tracing with OpenTelemetry. Connect request, SQLAlchemy, and HTTPX spans, then verify trace context across services.
Django Observability Checklist for Production
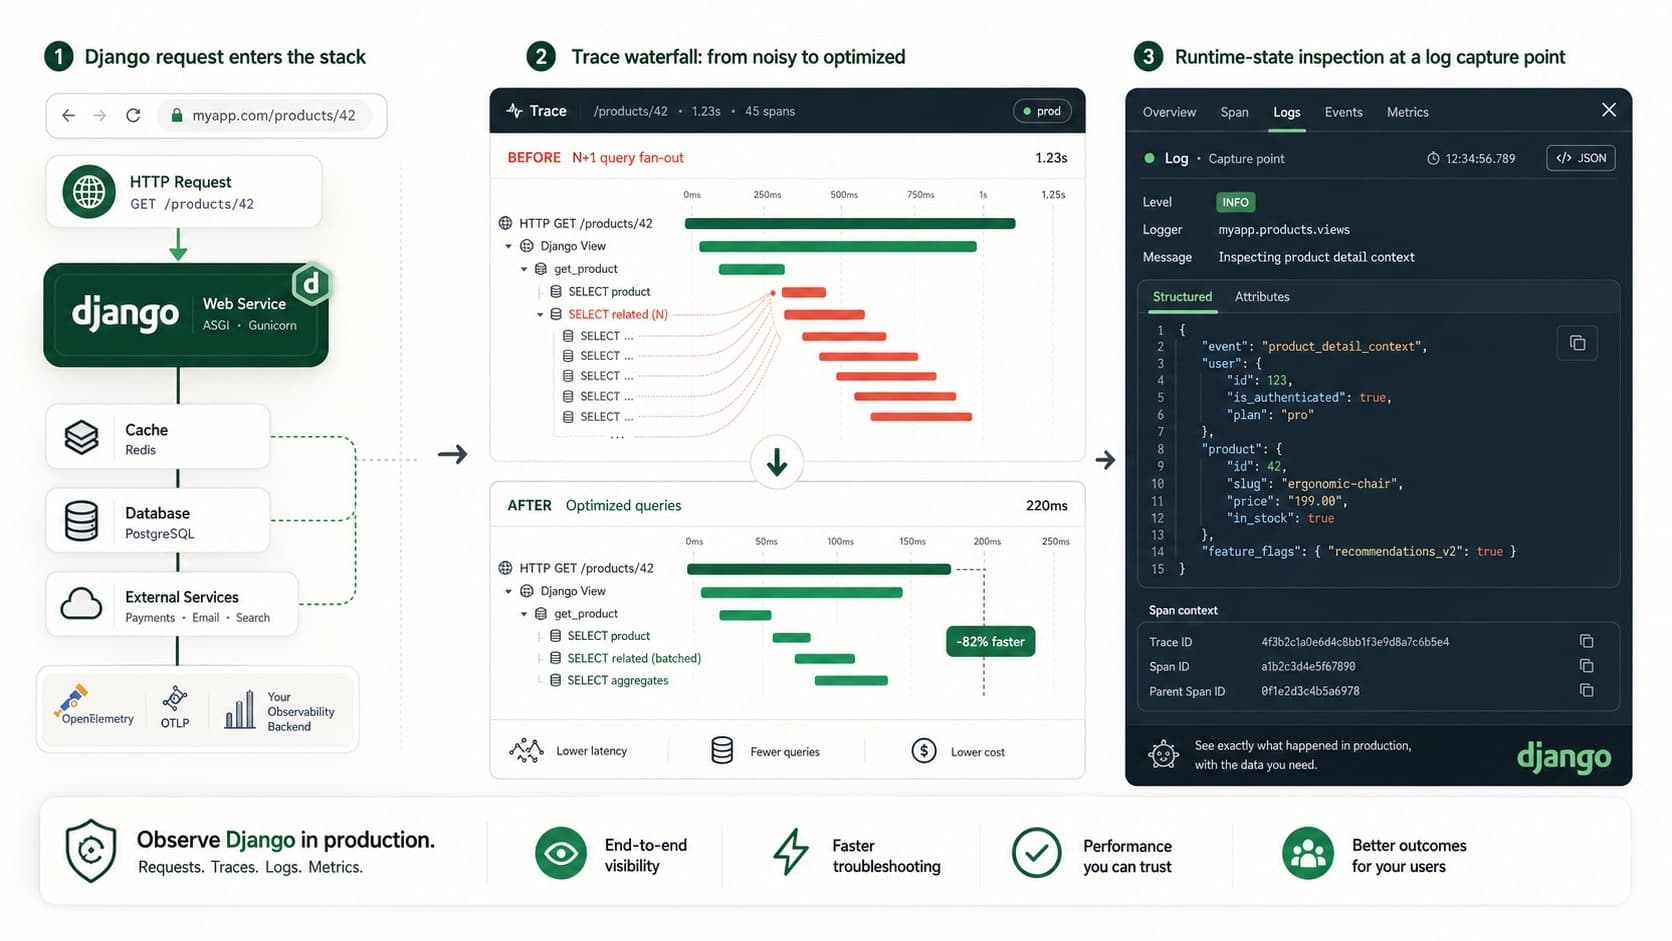
Build Django observability with traces, query visibility, alerts, and dynamic logs so you can debug production issues without guessing.
OpenTelemetry PHP Auto-Instrumentation for Laravel
Set up OpenTelemetry PHP auto-instrumentation for Laravel, configure OTLP before autoload, and verify request, SQL, and queue trace boundaries.