
APM Proof of Concept Checklist: Test Before You Buy
Use this APM proof of concept checklist to test trace coverage, alert quality, overhead, and cost with one real service before you choose a tool.
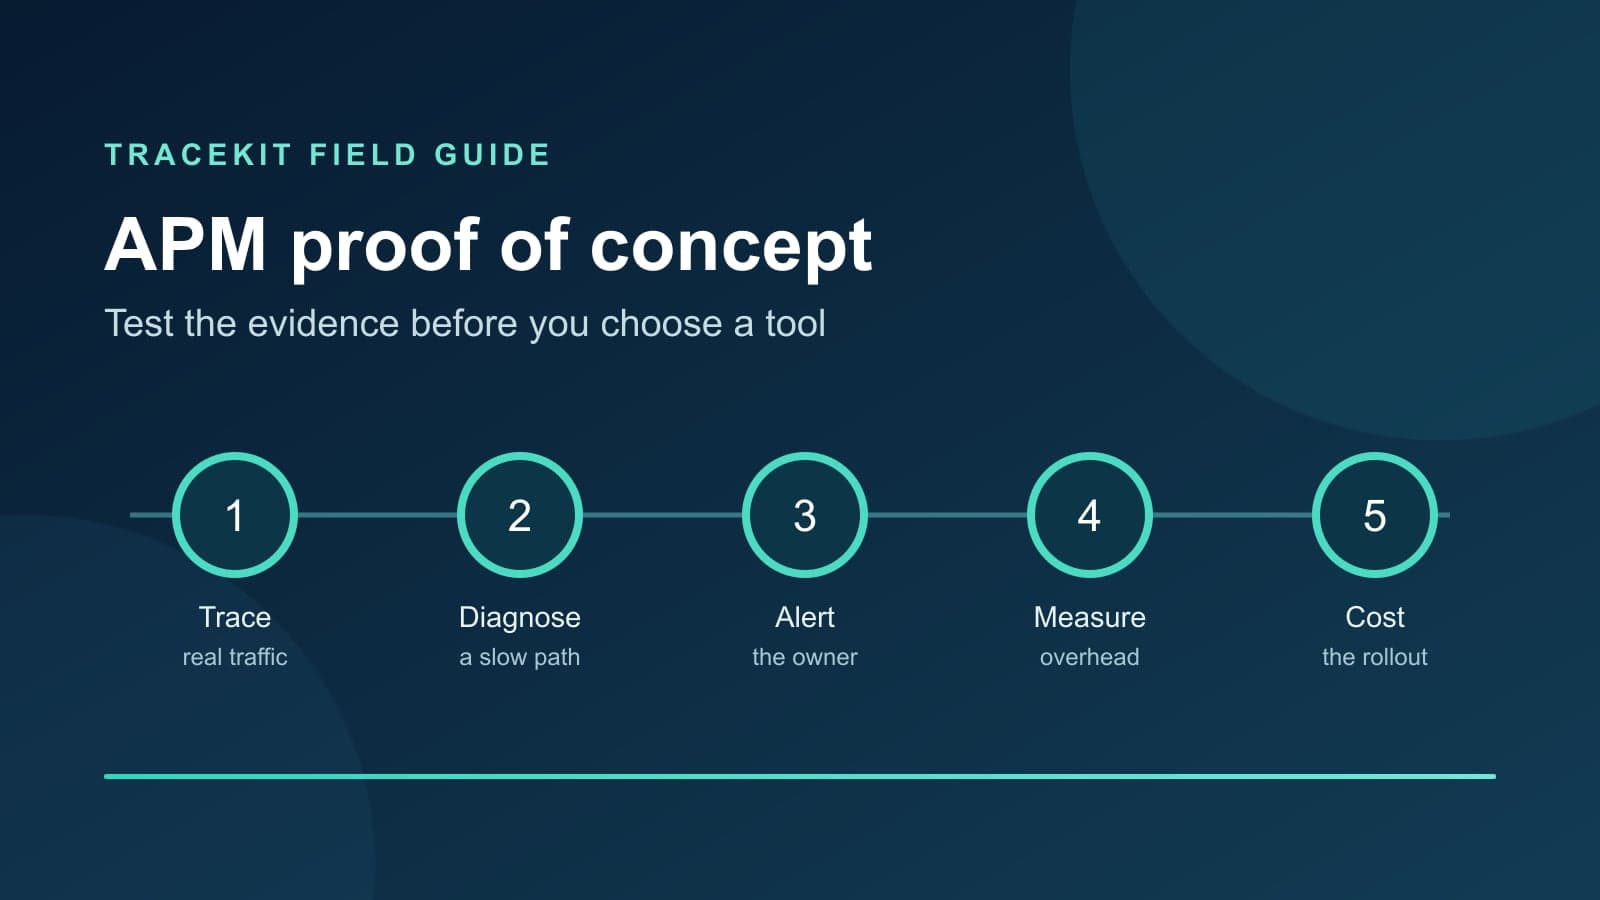
An APM proof of concept checklist should answer one question: can this tool help your team find and fix a real production problem? A feature demo cannot answer that question. Test one service, one slow request, one failure, and one alert with your own traffic. Record the evidence before you compare vendors.
This checklist gives you a small test plan and a scorecard. You can use it with any application performance monitoring (APM) tool.
Define the test before you install an agent
Pick a service that matters to users. Choose one route with a database or external dependency. Include a normal request, a slow request, and a controlled failure. Record your current request latency, error rate, traffic, CPU use, memory use, and telemetry cost. Use the same test window for each candidate.
Write down success criteria before the first vendor call. The values below are examples. Replace them with limits that fit your service.
| Decision | Example pass criterion | Evidence to save |
|---|---|---|
| Trace coverage | The chosen request shows its important service and database steps | One complete trace and a missing-span list |
| Diagnosis | An engineer finds the cause of a seeded slow request within 15 minutes | Screen recording or timed notes |
| Alert quality | One controlled failure reaches the correct owner without duplicate pages | Rule, notification, and delivery time |
| Overhead | Enabled instrumentation stays within your agreed latency and resource limits | Before-and-after load test results |
| Cost | Estimated monthly cost fits the budget at normal and peak traffic | Pricing inputs, retention, and sampling assumptions |
Do not use a vendor's sample application as your only test. A sample cannot show whether your framework, middleware, queue, and deployment process work with the tool.
Run the six APM proof of concept tests
1. Instrument one real request path
Send a request through your selected route. Check service names, route names, status, duration, and the parent-child relationship between spans. Follow the call into a database or another service. If a queue continues the work, check whether trace context survives that boundary. Record missing spans. Do not assume that automatic instrumentation covers every library.
OpenTelemetry defines common semantic conventions for telemetry names. Use them to check whether a candidate preserves useful names and attributes. The Tracekit distributed tracing guide describes its OpenTelemetry-based trace view and service map.
2. Find a slow request without a prepared answer
Ask a teammate who did not configure the tool to investigate a seeded slow request. Start from a user symptom, not from a known trace ID. Can that person find the affected route, open a representative trace, and identify the slow child span? Record each step that needs another tool or a manual search.
Measure the time from symptom to a supported explanation. A short trace is useful only when it shows the call that caused the delay. For database-heavy paths, compare application and database timing. The Google SRE monitoring guide explains why latency, traffic, errors, and saturation need separate views.
3. Test one failure and one alert
Trigger a safe failure in a test environment or a small production slice. Check whether the failed request has an error status, useful exception context, and a link from the alert to evidence. Send the alert to the real on-call route during an agreed test window. Confirm its owner, delivery delay, and repeat behavior.
An alert that fires in the console but never reaches an owner fails the test. Also test a healthy period. Count noisy notifications and set a limit for them. Tracekit alert rules support service error-rate, latency, throughput, and health-score conditions. Confirm each rule and channel in your own environment.
4. Measure overhead and data gaps
Run the same workload with instrumentation off and on. Compare P50, P95, and P99 request latency, CPU, memory, and network use. Repeat the test so one noisy run does not decide the result. Check the data pipeline during a traffic burst. Note dropped spans, delayed data, and gaps during a restart.
If you sample traces, record the policy and its effect on error and slow-request evidence. OpenTelemetry's sampling guide explains the trade-off between data volume and diagnostic coverage. Do not claim that a low sample rate captures every rare failure.
5. Prove the investigation workflow
Give the engineer a second problem without hints. Ask for the affected service, first bad release if known, likely cause, and supporting evidence. Check whether the tool connects a trace to a metric, error, or user session where those signals are instrumented. Note every broken link and every copy-and-paste step.
For a narrow code path, Tracekit dynamic logs can collect bounded runtime state at a capture point without a redeploy. Test that workflow only if you need runtime variables. Keep normal application logs in your logger. Dynamic logs do not provide general log ingestion.
6. Calculate the operating cost
Use observed traffic and a realistic retention period. Include agent or host fees, ingested events, seats, alert delivery, and any extra storage. Model a normal month and a traffic spike. Ask what happens when you exceed a plan limit. Check export and deletion paths before you depend on the data.
A low trial bill can hide a high production bill. Keep the inputs with the estimate. If a vendor cannot explain the rate or the limit, mark cost as unknown. Do not turn an unknown into a passing score.
Copy this decision scorecard
Score each test from 0 to 2. Give 0 when the required evidence is absent, 1 when it works with a manual workaround, and 2 when it passes without a workaround. Keep the raw evidence beside the score.
| Test | Candidate A | Candidate B | Evidence or gap |
|---|---|---|---|
| Request and dependency trace | |||
| Slow-request diagnosis | |||
| Failure and alert delivery | |||
| Measured overhead | |||
| Investigation links | |||
| Normal and peak cost |
A score is a conversation aid, not a substitute for a hard requirement. Reject a candidate that fails a mandatory security, privacy, data-location, or budget rule, even if its total score is high. Make the decision with the engineers who will use the tool during an incident.
Keep the trial small and repeatable
Use one service first. Save the test route, traffic pattern, injected failure, trace, alert, benchmark, and cost sheet. Run the same tests against each candidate. Then expand to a second service or framework if the first test passes.
If your main problem is Node.js request latency, test that route. If your team needs trace-based alerts, make the notification path a hard requirement. The best APM tool for your team is the one that produces useful evidence within your limits. After selection, use the APM implementation checklist for the wider rollout.
Related Posts
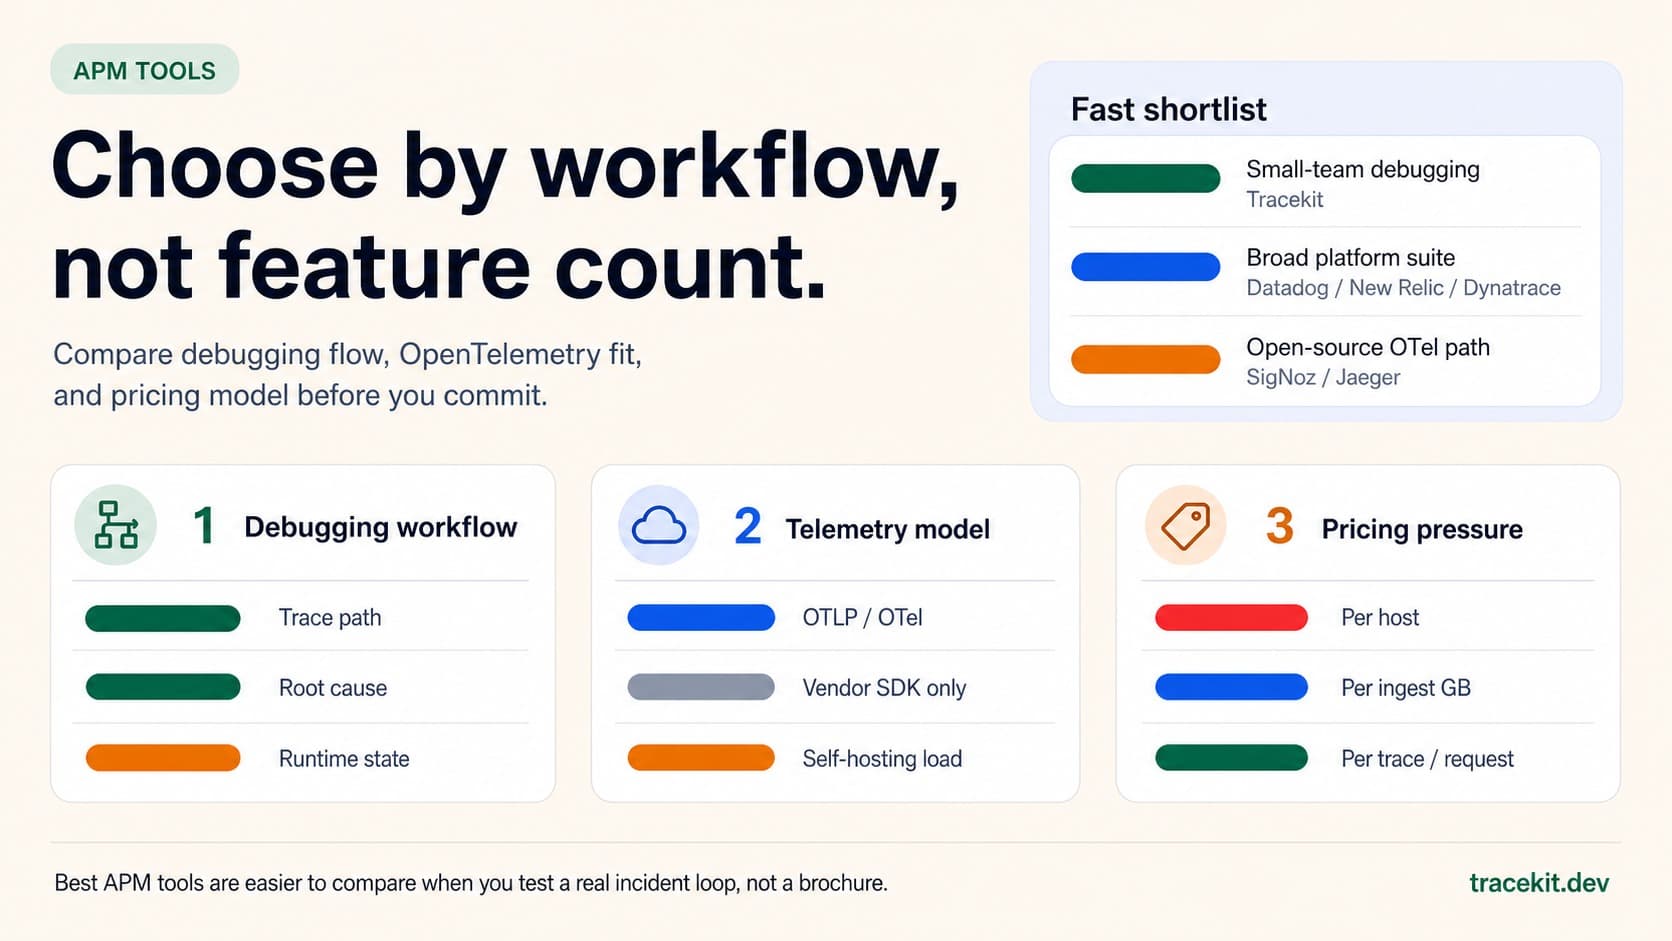
Best APM Tools for 2026: What to Compare Before You Commit
Compare the best APM tools for 2026 by debugging workflow, OpenTelemetry fit, pricing model, and runtime-state visibility.
Your API Just Threw a 500. Here's How to Actually Fix It.
Your API threw a 500 at 3 AM. A systematic approach to diagnose, trace, and fix production API errors without the panic and guesswork.
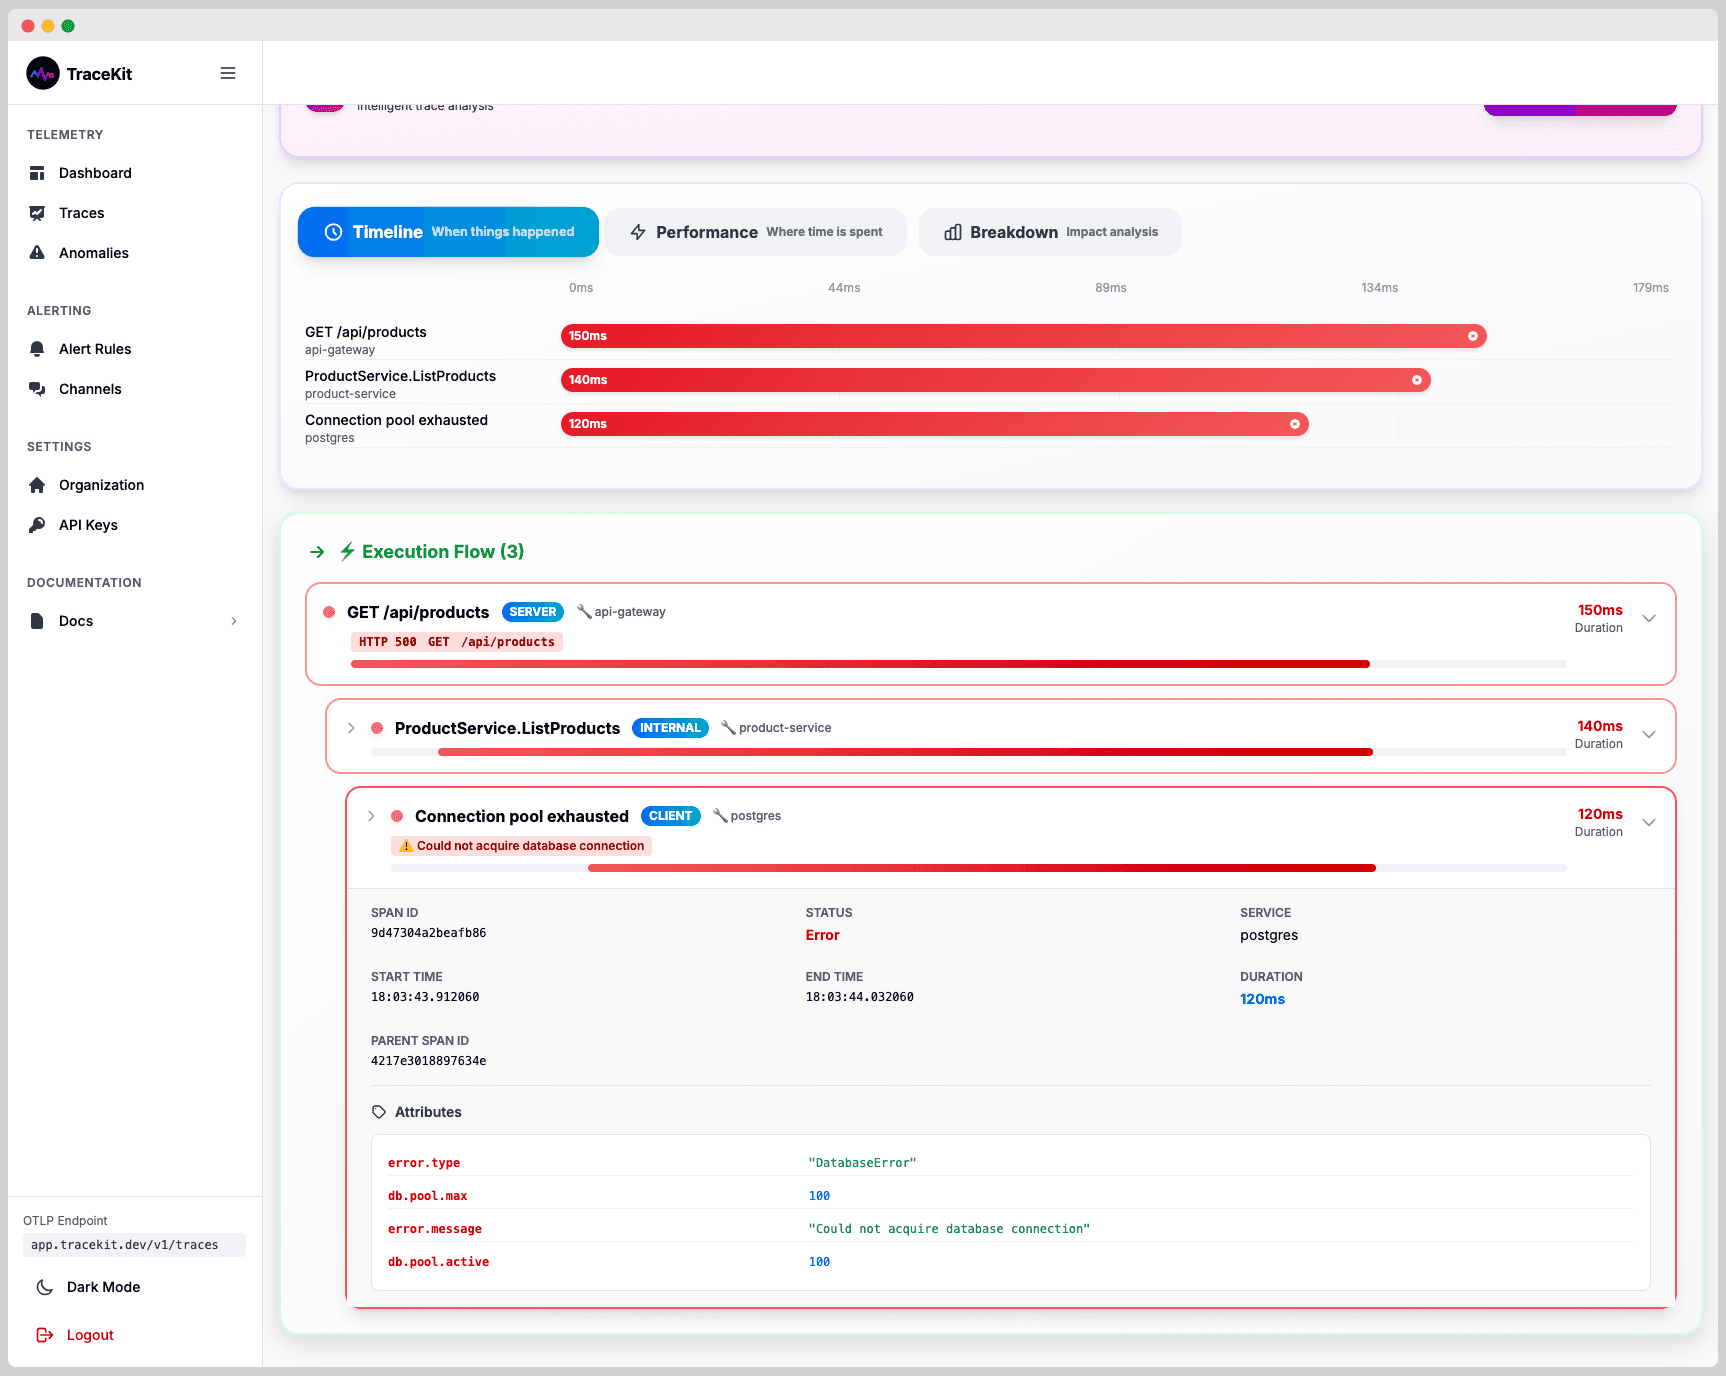
OpenTelemetry Implementation Guide: Step-by-Step Setup (2026)
Complete OpenTelemetry setup guide. Install the SDK, configure exporters, and ship your first traces in under 5 minutes. Covers Node.js, Python, Go, and Java.