
Best Error Monitoring Tools for Backend Services in 2026
Compare error monitoring tools for backend services in 2026. Test grouping, release context, trace links, and alert quality before you choose.
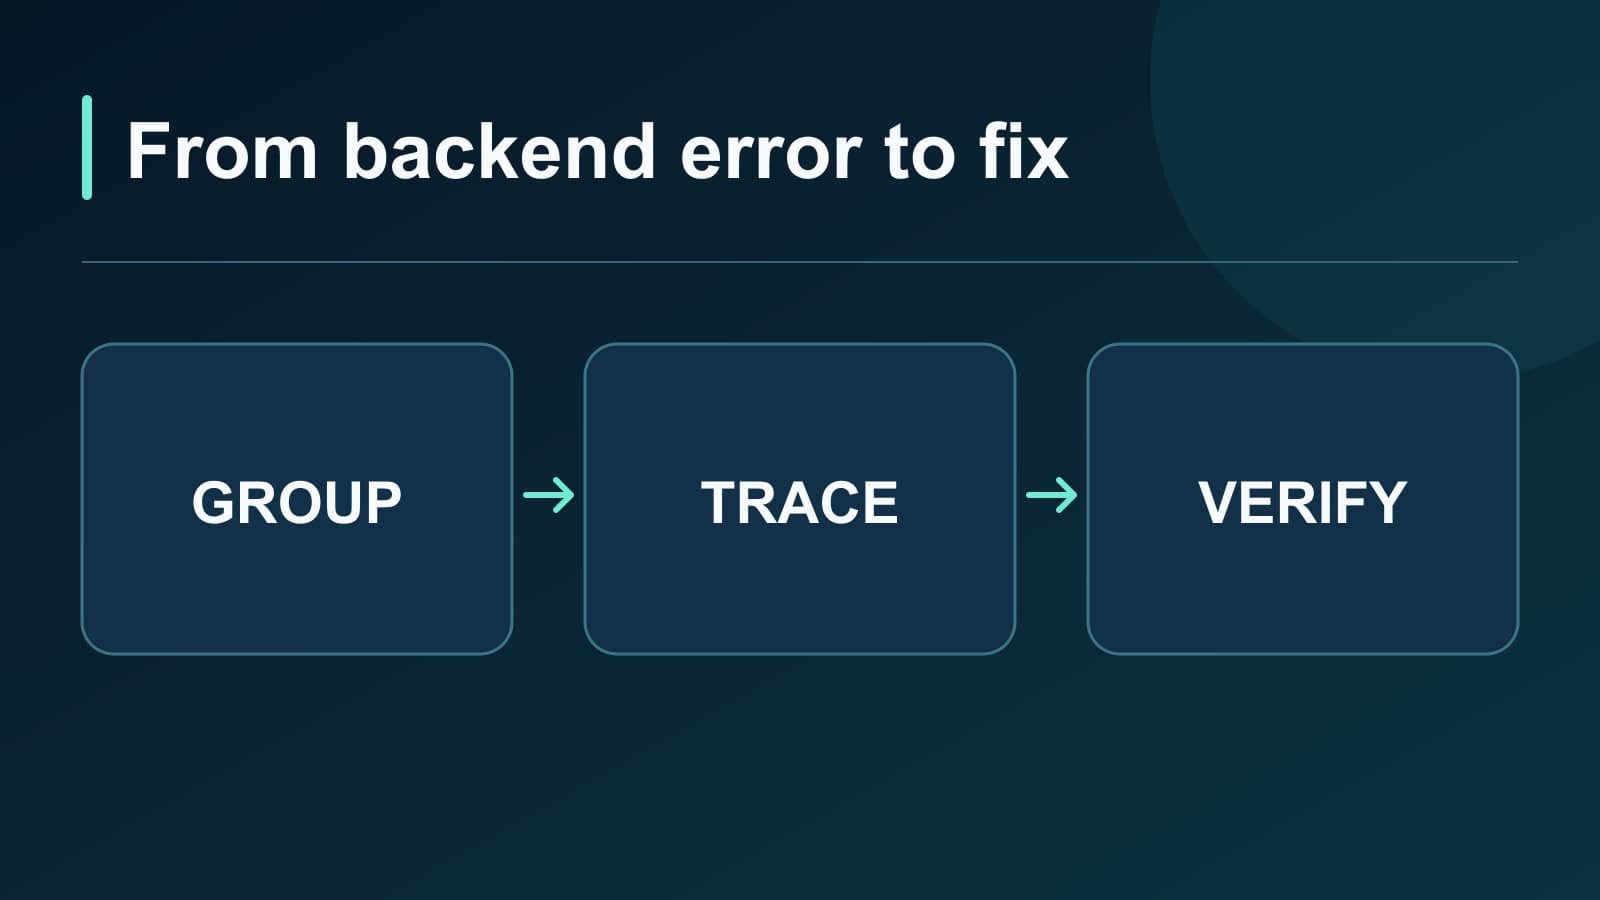
The best error monitoring tool for a backend service depends on what happens after the first exception arrives. An error count tells you that something failed. A useful tool groups repeated failures, identifies the affected release, and helps you find the request that failed.
This guide compares five tools for that job in 2026. It also gives you a test that works with your own service. The comparison covers backend exceptions and request failures. It does not rank browser replay, infrastructure monitoring, or every product in each vendor's platform.
Start with the error investigation you need
| Need | Check during a trial |
|---|---|
| Reduce repeated alerts | Do similar exceptions form one issue without merging different causes? |
| Find a regression | Can you filter errors by release and see when an issue started or returned? |
| Explain a failed request | Can you move from the error to its trace or request context? |
| Protect private data | Can you remove sensitive fields before they leave the service? |
| Control cost | What happens when error volume rises during an outage? |
Test these questions with a real service. A vendor feature list cannot show whether its default grouping works for your exception types.
Five tools to compare
| Tool | Useful starting point | Verify in your trial |
|---|---|---|
| Sentry | Exception triage across backend and frontend code | Grouping, release setup, and trace links for your SDK and plan |
| Bugsnag | Error groups and release health | Grouping behavior and which release-health measures your plan includes |
| Rollbar | Exception grouping and deploy tracking | Item grouping, deploy reporting, and alert noise |
| Datadog | Error issues inside an existing APM workflow | Required error span fields, trace retention, and monitor scope |
| Tracekit | Traces with release context and runtime investigation | Whether its current issue view and alert path fit your workflow |
The table names starting points, not measured winners. Product settings and plan limits can change. Check current vendor documentation before you buy.
Sentry: start from the exception
Sentry is a useful baseline when your team wants an issue inbox for exceptions. During a trial, send two copies of one exception and one different exception. Check how the issues group. Then attach a release and see whether your team can identify the first affected version.
Do not assume a trace is attached to every error. Confirm that the selected SDK records the request and that your sampling settings retain the evidence you need. Compare the complete incident path, from alert to assigned fix.
Bugsnag: test grouping and release health
Bugsnag's grouping documentation explains how it uses error class and stack frames for many backend errors. It also offers custom grouping when the default splits one cause or combines different causes.
Its releases dashboard compares release health. Some stability measures depend on the plan. Verify that your backend reports the session data and release values needed for the measure you want. A release label alone does not prove that a stability score covers your service.
Rollbar: test issue noise after a deploy
Rollbar groups occurrences into items. Its deploy tracking can connect a new error with a suspected deployment when you report deploys.
Send one exception before and after a test deployment. Check whether the new occurrence stays in the correct item. Then check the alert rule. A tool that groups errors well can still page the team too often if every occurrence triggers a notification.
Datadog: check error span requirements
Datadog Error Tracking for backend services groups error spans into issues. Its documentation lists error.stack, error.message, and error.type on a complete trace as required inputs. Verify these fields in one real backend failure before you judge the issue view.
Datadog can fit a team that already uses its APM and wants error issues beside traces. Check which error spans and traces remain available after sampling and retention rules. Its error tracking monitors can target new or regressing issues, but you must test the rule against your alert policy.
Tracekit: follow the trace into runtime context
Tracekit connects distributed traces, alerts, and release tracking. Its release data can show new and regressed issue counts. Tracekit also provides dynamic logs to capture bounded runtime state when a trace identifies the suspicious code path.
Test the exact issue and notification path that your team needs. Tracekit has release-aware issue grouping, but its public documentation does not establish every workflow in a dedicated error-tracking product. Keep normal application logs in your logger. Dynamic logs are capture points, not general log ingestion.
Run the same backend test in every tool
Use a test service and one release identifier. Keep private data out of all test events.
- Generate a handled exception and an unhandled exception from one route.
- Repeat the same exception ten times. Check whether it becomes one issue.
- Generate a different failure with a similar message. Check that it stays separate.
- Deploy a new release. Repeat the first exception and inspect the release view.
- Trigger one slow downstream call. Check whether an error links to a useful request trace.
- Add a test secret to local input. Confirm that your scrub rule removes it before upload.
- Create an alert for a new or regressed issue. Record delivery time and repeat pages.
- Raise test error volume. Record which usage unit grows and which data remains available.
Write down a pass, fail, or unavailable result for each step. Do not score an untested feature as a pass.
Choose by the evidence you actually get
| If the test shows... | Prioritize... |
|---|---|
| Many duplicate issue alerts | Better grouping and alert rules |
| Errors appear after releases | Release context and regression detection |
| Stack traces do not explain the cause | Request traces and bounded runtime context |
| Outage volume changes your bill | Ingestion controls and a clear pricing unit |
| Private fields reach the vendor | SDK filtering before any production rollout |
One team may need a dedicated exception inbox. Another may need a trace that explains why a backend request failed. Choose the tool that shortens your measured investigation, with a cost and privacy policy your team can maintain.
For a broader selection exercise, use the APM proof of concept checklist. For a specific failure, use the production 500 error guide.
Related Posts
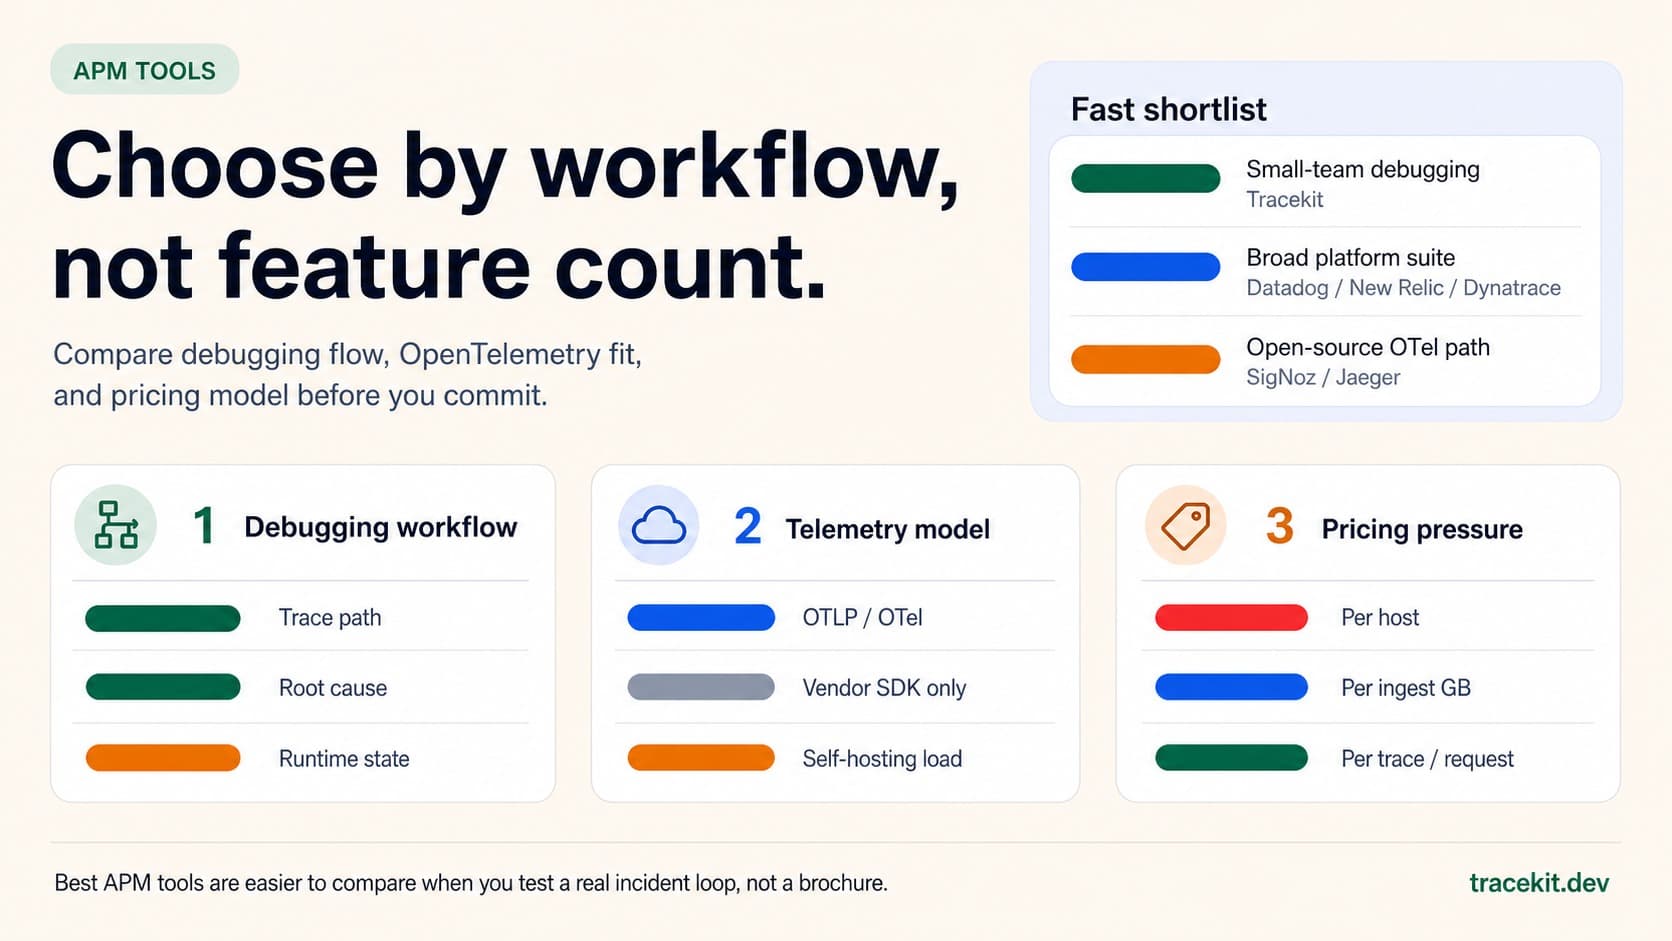
Best APM Tools for 2026: What to Compare Before You Commit
Compare the best APM tools for 2026 by debugging workflow, OpenTelemetry fit, pricing model, and runtime-state visibility.

Tracekit vs Datadog for Small Engineering Teams
Compare Tracekit and Datadog for small engineering teams by pricing units, product scope, OpenTelemetry support, and debugging workflow.
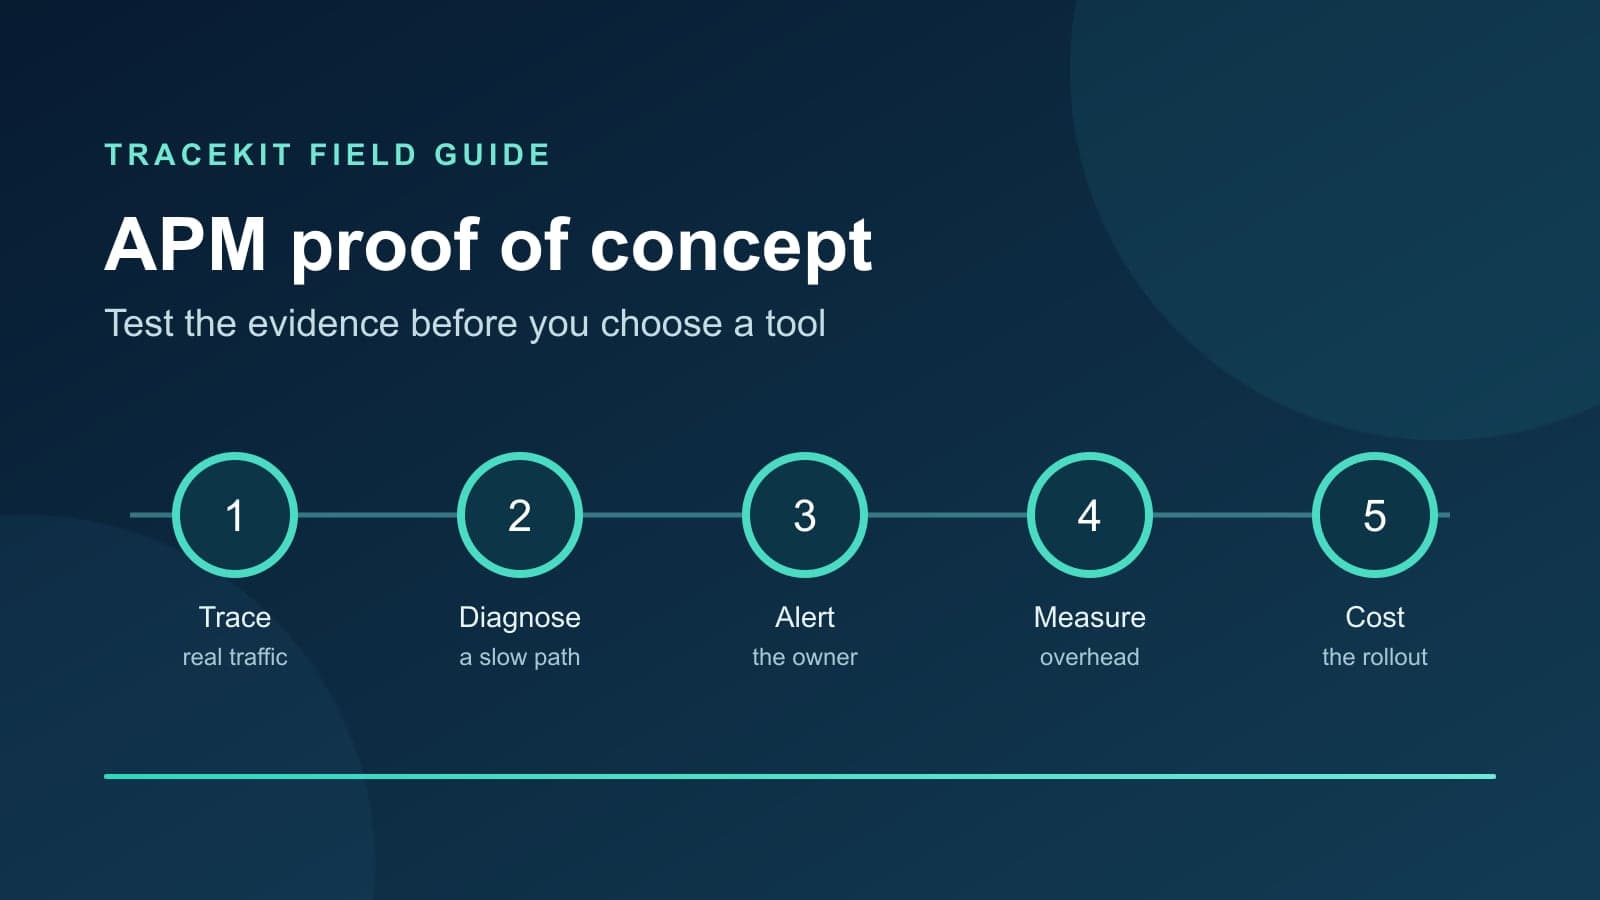
APM Proof of Concept Checklist: Test Before You Buy
Use this APM proof of concept checklist to test trace coverage, alert quality, overhead, and cost with one real service before you choose a tool.