Spring Boot Production Debugging: Beyond Logging
Debug Spring Boot in production beyond logging. Use dynamic logs, distributed tracing, database monitoring, and AI alerts without redeploying.

Debugging Spring Boot applications in production is a challenge - logs alone often aren't enough. Traditional methods like adding logs, redeploying, and waiting can waste hours or even days. Tools like TraceKit solve this by offering dynamic log features, distributed tracing, and automated monitoring, all designed to work in real-time without disrupting your app. Here's what you need to know:
-
Why Logs Fall Short: Logs provide isolated snapshots but miss critical context, especially in microservices. They also generate massive data that's hard to sift through.
-
TraceKit Features:
- Dynamic Logs: Inspect variables in production without redeploying.
- Distributed Tracing: See the full lifecycle of requests across services.
- Database Monitoring: Identify slow queries and N+1 issues easily.
- AI Alerts: Get notified of anomalies like traffic spikes or errors.
-
Pricing: Starts at $29/month for 1 million traces, far cheaper than enterprise tools like Datadog.
-
Setup: Takes under 5 minutes with automatic Spring Boot integration.
With TraceKit, you can debug faster and more effectively, saving time and reducing downtime for your users. Whether you're troubleshooting race conditions or slow APIs, it simplifies the process and eliminates the need for repetitive log-deploy cycles.
Das Boot: Diving into Debugging Spring Boot Applications by Mark Heckler
Why Standard Logging Falls Short in Production
Standard logging provides isolated snapshots of events. However, production failures often involve intricate, system-wide interactions that standard logging cannot fully capture [5]. In high-concurrency environments, a single log line rarely paints the whole picture. Let’s break down why standard logging alone struggles to provide the production context you need.
Too Much Log Data
High-traffic systems churn out gigabytes of log data daily, making it nearly impossible to sift through it all effectively [4]. Imagine searching through thousands of timestamped log entries - it's like hunting for a needle in a haystack. Tools like Spring Boot Actuator try to manage this by sampling only 10% of requests by default, as logging every single event would overwhelm your infrastructure [3]. Even with sampling, you’re often left manually combing through enormous files, hoping to stumble upon the one log line that holds the key to the issue.
Missing Context in Log Files
Logs are great at capturing individual events but often fail to connect the dots between them. For example, a log might show "Database query executed", but it won’t include the SQL parameters that caused a constraint violation, the HTTP request payload that triggered the query, or the state of variables at the time [4].
In microservices, this problem gets even worse. A single user action can involve multiple services, and without correlation IDs, piecing together related log entries becomes a nightmare. Developers often spend 30 to 90 minutes manually matching timestamps and trace IDs to reconstruct what happened [1].
"Searching logs across six services gives thousands of lines with no obvious connection. By the time you correlate timestamps and trace IDs manually, customers have abandoned their carts." - Alexandr Bandurchin, Uptrace [6]
The Redeploy Problem
When logs don’t capture enough detail, you’re forced to redeploy just to add more logging. What could have been a quick fix turns into a days-long process [1]. This delay not only frustrates developers but also impacts customer experience.
| Feature | Standard Logging | Distributed Tracing |
|---|---|---|
| Visibility | Single line/thread | Full request lifecycle |
| Debug Speed | Slow (requires redeploys) | Instant (dynamic logs) |
| Context | Minimal (local variables) | High (headers, payloads, DB queries) |
| Correlation | Manual/Difficult | Automatic via Trace IDs |
Setting Up TraceKit for Spring Boot
TraceKit, built on OpenTelemetry, integrates seamlessly with Spring Boot using standard tracing protocols. This ensures flexibility without locking you into a specific vendor [1]. The setup is quick - taking less than four minutes - and involves a single CLI command that handles account creation, API key setup, and environment configuration [1].
Installing the TraceKit Java SDK
To get started, install the TraceKit CLI. If you're using macOS, you can install it with Homebrew:
brew install Tracekit-Dev/tap/tracekit
For Linux or other systems, use the following command:
curl -fsSL https://raw.githubusercontent.com/Tracekit-Dev/cli/main/install.sh | sh
After installation, navigate to your project's root directory and run:
tracekit init
The CLI will automatically detect your Java framework, verify your email, and save the API key to a .env file, so you can skip manual configuration [1]. This streamlined process helps debug production issues 10x faster than traditional methods.
The free plan offers 200,000 traces per month with a 7-day retention period, making it a great starting point for small teams. For higher needs, the Starter plan provides 1 million traces with 30-day retention for $29/month - far more budget-friendly compared to enterprise tools that typically start at $500+ per month [1].
Automatic Instrumentation
TraceKit simplifies monitoring by automatically instrumenting key Spring Boot components. It captures data like HTTP requests, database queries, and API calls [1]. Even in production environments, performance overhead remains minimal - under 5%. For high-traffic applications, you can adjust the sampling rate in the application.properties file:
management.tracing.sampling.probability: 0.1
This example sets the sampling rate to 10%, which helps balance visibility with storage costs [7].
Verifying Your Setup
Once you run tracekit init, the CLI sends a test trace and confirms success with this message:
✓ Test trace sent successfully
Next, log in to TraceKit's dashboard and check the "Live Trace Feed." Incoming requests should appear in real time.
To manually test, you can send an HTTP request using curl or your browser. Within seconds, the dashboard should display a flame graph showing the request's lifecycle [1]. If no traces appear, check that the .env file contains the correct API key. Alternatively, you can temporarily enable console logging by setting:
OTEL_TRACES_EXPORTER=logging
At application startup, look for this log message:
[otel.javaagent] OpenTelemetry Javaagent started
This confirms that the agent initialized correctly [9]. You can also monitor the "System Health" widget on the dashboard, which will display metrics like requests per minute and average latency [1].
Once you've verified the setup, you can start exploring advanced debugging tools for deeper, real-time insights.
Advanced Debugging with TraceKit
TraceKit goes beyond standard logging to provide real-time, in-depth insights across your application, helping you tackle those elusive blind spots.
Tracing HTTP Requests and Dependencies
With TraceKit, every HTTP request in Spring Boot is captured and visualized through sequence diagrams, making it easier to debug production issues faster [1]. Its flame graph view is a standout feature, breaking down each request by time spent on various operations. For instance:
- Database queries are highlighted in blue.
- External API calls appear in purple.
- Other application code is shown in distinct colors.
A wide purple box on the flame graph? That’s a red flag for a slow external API call - it might be worth offloading or running it in parallel. Meanwhile, if you notice a "Coral Reef" pattern (many small, aligned boxes), it could indicate an N+1 query issue. In such cases, replacing multiple tiny database calls with a single, more efficient query can make a big difference.
TraceKit also provides a distributed tracing map, giving you a live view of service dependencies. This lets you see exactly which downstream services are affected when one service encounters an issue [1].
While request tracing focuses on external calls, the tool's database monitoring zeroes in on inefficiencies in your data layer.
Database Query Monitoring
TraceKit captures the full SQL statement for every query, all without requiring changes to your JDBC configuration [8][11]. The dashboard's waterfall view is particularly useful - if you notice multiple sequential SELECT statements hitting the same table, it’s a clear sign of an N+1 problem.
Another critical feature is connection pool monitoring. By tracking connection acquisition times, you can detect when your pool is nearing exhaustion. For instance, long acquisition times often hint at resource limits. If you're running in production, TraceKit offers probability-based sampling, allowing you to trace just 1% to 5% of traffic. This strikes a balance between detailed insights and cost efficiency, making it a practical choice for smaller teams [8].
One word of caution: while the bind-parameters option can capture detailed query data, it might expose sensitive user information in production. Instead, use span processors to redact confidential details before they’re logged [8][11].
Beyond tracing and database monitoring, TraceKit includes a groundbreaking feature: dynamic logs.
Dynamic Logs Without Redeploying
TraceKit’s capture points let you inspect variable states in production without restarting or redeploying your application [1]. Through the web dashboard, you can set these capture points, and when the specified line of code executes, TraceKit collects a snapshot of the state. This includes variables, request payloads, and headers - all without interrupting the application’s flow.
Here’s a real-world example: In early 2026, Alex, a solo founder, was troubleshooting a failing Stripe webhook. Logs showed a 200 response, yet subscriptions weren’t activating. By setting a single capture point, Alex uncovered a race condition with an asynchronous database write in just 10 minutes - a bug that had been missed through multiple redeploys [1]. For tricky, intermittent issues like race conditions or timing bugs, capture points provide a clear, real-time view of what’s happening when it matters most.
TraceKit’s advanced debugging tools make it easier to pinpoint and resolve issues, saving valuable time and effort in the process.
TraceKit vs Datadog for Small Teams
TraceKit vs Datadog: Feature and Pricing Comparison for Small Teams
Feature Comparison
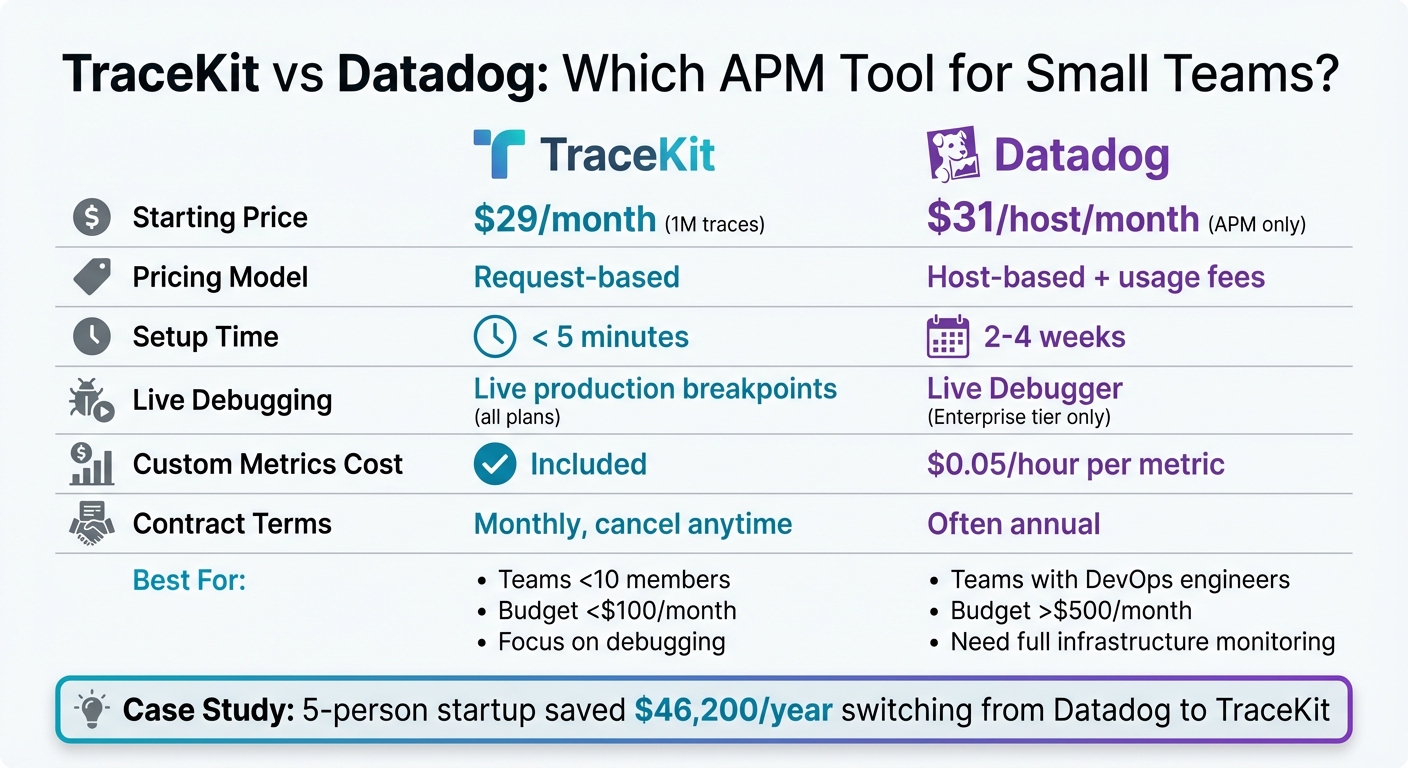
For small teams, budget constraints often play a big role in decision-making. Datadog's pricing starts at $31 per host per month for APM, which can add up quickly as your infrastructure grows [13]. On the other hand, TraceKit offers a request-based pricing model, starting at $29 per month for 1 million traces, making it more predictable and affordable for smaller teams.
The setup process also sets these tools apart. Datadog requires several steps, including installing agents, configuring sidecar containers, and setting up dashboards. This can take anywhere from 2 to 4 weeks [10]. In contrast, TraceKit offers a much simpler onboarding experience with a one-command installation that gets you up and running in under five minutes [1]. If you're using Spring Boot, TraceKit's SDK automatically detects your framework and starts capturing key data like database queries, HTTP calls, and exceptions without any extra configuration.
For teams using Spring Boot and prioritizing fast debugging in production, TraceKit delivers essential features without the added complexity of infrastructure monitoring.
| Feature | TraceKit | Datadog |
|---|---|---|
| Starting Price | $29/month (1M traces) | $31/host/month (APM only) |
| Pricing Model | Request-based | Host-based + usage fees |
| Setup Time | < 5 minutes | 2–4 weeks |
| Dynamic Logs | Dynamic logging in production | Live Debugger (Enterprise tier) |
| Custom Metrics Cost | Included | $0.05/hour per metric |
| Contract Terms | Monthly, cancel anytime | Often annual |
Why Small Teams Choose TraceKit
One example of TraceKit's appeal comes from a five-person startup that transitioned six services from Datadog to TraceKit. Previously, their monthly spend was substantial, but after a three-hour migration using TraceKit's OpenTelemetry SDK, their monthly bill dropped to $950, resulting in an annual savings of $46,200. These savings allowed them to hire another engineer [13].
"Enterprise APM tools cost $500+/month. I built Tracekit as an affordable alternative starting at $29/month with runtime inspection."
- Terry Osayawe, Founder of TraceKit [12]
For Spring Boot developers, the standout benefit of TraceKit lies in its focus on debugging rather than all-encompassing monitoring. While Datadog provides extensive infrastructure visibility, TraceKit hones in on debugging pain points like slow database queries, failing API calls, and race conditions. Its dynamic logs in production, included in all plans, let you inspect variable states without redeploying. This means you can fix a production bug - even in the middle of the night - without unnecessary delays.
When to Consider Each Tool
Choose TraceKit if:
- Your team prioritizes application debugging over comprehensive monitoring.
- You're scaling with containers, where host-based pricing can quickly become expensive.
- You need to keep monthly costs below $100.
TraceKit is designed for developers who want to focus on shipping features without the overhead of managing a complex monitoring setup [10].
Opt for Datadog if:
- You need a single platform for deep infrastructure monitoring, compliance-level log retention, synthetic browser testing, and security monitoring.
- Your team has dedicated DevOps engineers and a budget exceeding $500 per month.
For smaller Spring Boot teams with fewer than 10 members, TraceKit's streamlined and affordable approach often delivers faster debugging results at a fraction of the cost. This developer-first philosophy keeps the focus on resolving production issues efficiently, making it a practical choice for many startups and small teams.
Custom Dashboards and AI Anomaly Detection
Building Metrics Dashboards
TraceKit offers custom metrics and dashboards as part of all its plans, including the free tier. This makes it possible to monitor the health of your Spring Boot applications without any additional cost[1]. The dashboard tracks key metrics automatically, such as requests per minute, average latency, P99 latency, uptime, and error rates. By integrating seamlessly with Micrometer Observation, TraceKit uses an ObservationRegistry to include low-cardinality tags in your metrics automatically[1][2].
For added convenience, TraceKit provides embeddable widgets. These allow you to showcase real-time metrics on internal status pages or public dashboards, offering a transparent view of your application's performance[1].
AI-Powered Anomaly Alerts
TraceKit doesn't stop at visualizing metrics - it also delivers smart anomaly detection. Using AI, it monitors your application for unusual activity like DDoS attacks, traffic surges, increased error rates, or potential security threats. By establishing a baseline for normal behavior, the system flags deviations early, helping you tackle issues before they escalate into major outages. Alerts for anomalies are sent directly to Slack, Telegram, or custom webhook endpoints for immediate action[1].
"TraceKit helped me find performance issues before I released the new version of my framework. I was able to fine-tune everything and fix problems before they hit users."
- Ali Khorsandfard, Creator of Gemvc PHP Framework[1]
This proactive approach speeds up troubleshooting. When an anomaly is detected, you can use dynamic logs in production to inspect variable states in real time - no need for redeployment or waiting on log updates[1]. These tools round out TraceKit's comprehensive debugging suite for Spring Boot applications.
Conclusion
Key Benefits of TraceKit
Production debugging can be tricky, but TraceKit offers a way to cut through the noise and tackle challenges head-on. By providing real-time insights and seamless tracing, it eliminates the guesswork involved in resolving issues. With dynamic logs in production, you can inspect variable states instantly - no need to tweak your code. Forget about juggling scattered log files across distributed services. Instead, TraceKit gives you a unified view with distributed tracing and request lifecycle replays, so you can see the full picture at a glance.
Setup is a breeze thanks to automatic instrumentation, which gets you up and running quickly. Plus, its AI-powered anomaly detection keeps you ahead of potential problems like DDoS attacks, traffic surges, or error spikes. Notifications are sent straight to your favorite platforms, including Slack, Telegram, or custom webhooks, so you’re always in the loop [1]. These tools let you debug production apps without redeploying, keeping your services running smoothly.
Getting Started
Want to make debugging easier? Getting started with TraceKit is simple. You can try the free plan, which includes 200,000 traces per month - no credit card required. Need more? The Starter plan is just $29/month and offers 1 million traces, 7-day retention, and unlimited team members.
Installation is quick: use Homebrew (brew install Tracekit-Dev/tap/tracekit) or curl to set it up in minutes. Run tracekit init, and it will automatically detect your Spring Boot framework, create your account, and configure your API key. The SDK takes care of instrumentation, so there’s no extra setup needed. Built on OpenTelemetry, TraceKit is flexible with no annual contracts - you can cancel anytime. Ready to dive in? Visit https://app.tracekit.dev/docs/languages/java and start debugging smarter today [1].
FAQs
Is dynamic logs safe in production?
Dynamic logs in a production environment can be done safely if you use the right tools and follow strict protocols. Tools like TraceKit enable real-time inspection of issues without halting the application, which is a game-changer for diagnosing problems on the fly. However, this process isn't without risks.
To keep things under control, it's crucial to implement security measures, such as SSH sessions, to restrict access and protect sensitive data. At the same time, careful management of the debugging process ensures that changes or inspections don't unintentionally destabilize the system. Following established best practices and maintaining a disciplined approach are key to avoiding disruptions while troubleshooting in production.
How much overhead does tracing add?
Tracing generally introduces a small amount of overhead, typically ranging from 1% to 5%, depending on how it's implemented and the extent of its use. Tools like TraceKit are designed to be lightweight and efficient, making them well-suited for use in production environments without significantly impacting performance.
How do I avoid capturing sensitive data?
When debugging Spring Boot applications, it’s important to ensure sensitive data doesn’t get exposed. To achieve this, you can use data scrubbing techniques. These involve configuring filters or masks within your code or monitoring tools to hide sensitive fields, such as passwords or personal identifiers. Tools like TraceKit and Sentry can help by automatically masking or excluding sensitive information before it’s transmitted, keeping your app aligned with privacy standards.
Related Blog Posts
Related Posts

How to Debug Spring Boot Microservices in Production
Debug Spring Boot microservices in production step by step. Fix bugs, resolve misconfigurations, and trace cascading failures across services.

Laravel Production Debugging: Beyond Logs and Error Tracking
Debug Laravel in production beyond dd() and Log::info(). Use Telescope, dynamic logs, distributed tracing, and performance profiling.

Debug Production Without Redeploying: Step-by-Step Guide
Step-by-step guide to debugging production without redeploying. Set up dynamic logs for PHP, Node.js, Go, and Python in minutes.