
500 errors signal server issues that disrupt requests, often caused by unhandled exceptions, resource overloads, or deployment mismatches. When these errors occur inconsistently, they’re harder to diagnose and fix. But with the right methods, you can pinpoint and resolve them effectively.
Key Steps to Fix Intermittent 500 Errors:
- Reproduce the Error: Use logs and testing tools to identify patterns and recreate the issue.
- Investigate Logs: Analyze server logs to locate failure points and trace request flows.
- Trace Requests: Use distributed tracing to map how requests travel through services.
- Capture Application State: Record system conditions during errors or debug production apps without redeploying for deeper insights.
- Deploy Fixes and Monitor: Test solutions in controlled environments, monitor for regressions, and validate improvements.
Tools to Simplify Debugging:
- TraceKit: Affordable live debugging with features like live breakpoints and AI-powered observability. Starts at $29/month.
- Datadog: Comprehensive monitoring but costly for small teams at $31/host/month.
Quick Comparison:
| Feature | TraceKit | Datadog |
|---|---|---|
| Starting Price | $29/month (1M traces) | $31/host/month (APM only) |
| Setup Time | ~4 minutes | Weeks (agent configuration) |
| Live Debugging | Yes (live breakpoints) | No |
| Best For | Small teams, solo devs | Large enterprise teams |
Intermittent 500 errors can cost businesses heavily in downtime and user trust. By following this structured approach and leveraging the right tools, you can turn these elusive issues into solvable problems.
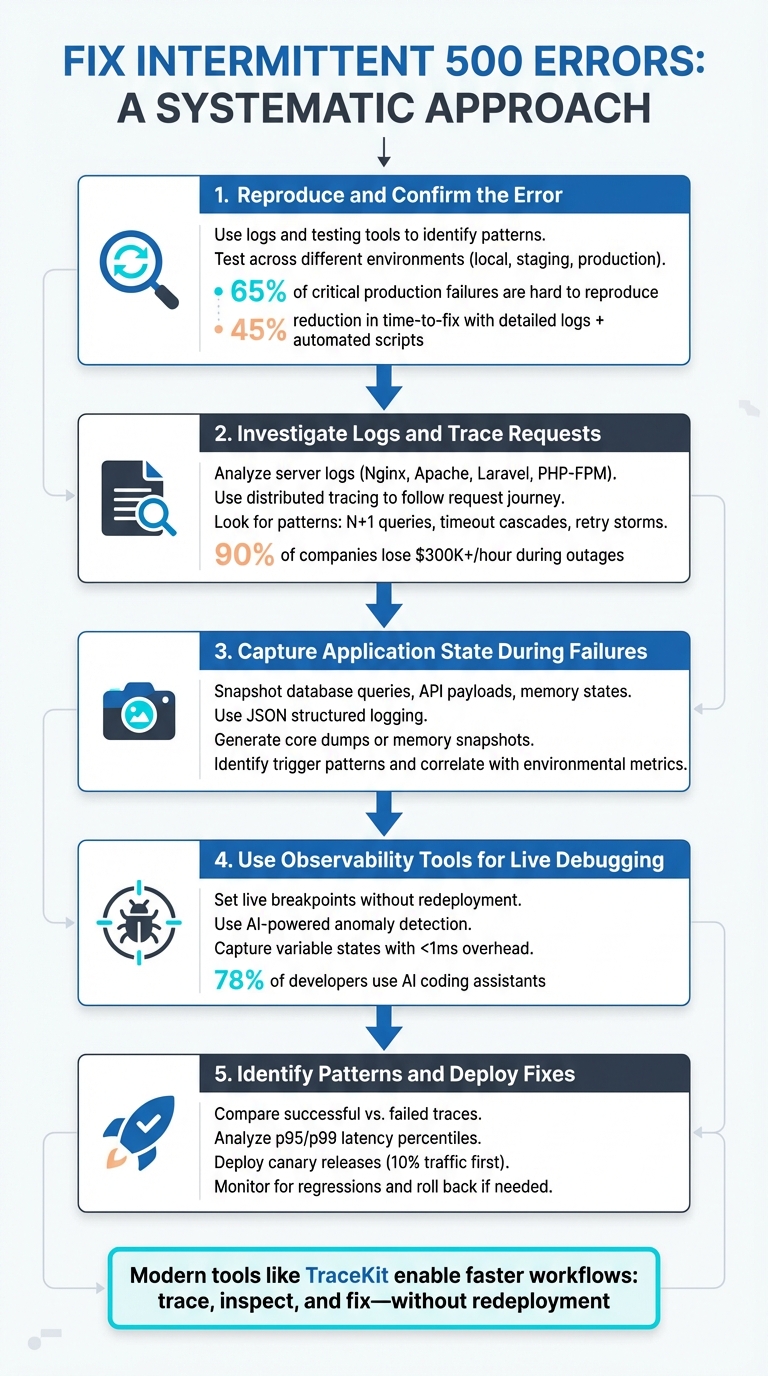
5-Step Process to Fix Intermittent 500 Errors
The Ultimate Guide to Fixing the 500 internal server error
sbb-itb-0fa91e4
Step 1: Reproduce and Confirm the Error
To tackle an intermittent 500 error, the first step is to reproduce it consistently. This can be tricky since these bugs often seem random. However, as Bugpilot explains:
"Intermittent bugs – those frustrating, unpredictable glitches – no longer have to be the persistent nemesis of dev teams… they’re engineering signals that your software is entering the real world of concurrency and unpredictable external factors" [8].
The goal here is to turn these fleeting problems into scenarios you can reliably recreate.
Reproducing Errors with Testing Tools
Start by digging into your logs to identify patterns. If you’re using Vercel, the vercel logs command allows you to filter by environment (like production or preview), status codes (e.g., 5xx), and specific time frames to pinpoint when the issue occurred [5]. With a request ID or timestamp in hand, you can use tools like jq to extract key details such as path, message, and timestamp. This helps identify whether the errors are clustering around certain routes or user actions [5].
If you suspect a recent deployment might be the culprit, leverage the vercel bisect command to pinpoint which deployment introduced the bug. Once you’ve identified the suspect deployment, use vercel curl to target the problematic URL and confirm the issue [5].
For errors that are hard to reproduce locally, automated test suites can help. Introduce randomized timing and inputs into your tests to simulate real-world conditions. Development teams have reported a 45% reduction in time-to-fix for intermittent bugs when combining detailed logs with automated reproduction scripts [8]. Simulating different network speeds and delays can also reveal hidden race conditions or concurrency problems.
Once you’ve identified the conditions that trigger the error, confirm that the behavior is consistent across all environments.
Testing Across Different Environments
Intermittent errors often behave differently depending on whether you’re in a local, staging, or production environment. Research shows that 65% of critical production failures are tied to bugs that are difficult to reproduce [8]. Start by reviewing your environment variables – mismatches between local and production setups can easily cause 500 errors [5].
Next, monitor resource usage in staging or production with a command like kubectl top pod <pod-name>. High CPU or memory usage could be triggering crashes specific to these environments [4]. If the error only appears in production, consider deploying a preview environment to test your fix under conditions that mimic production [5].
As Terry Osayawe, founder of TraceKit, aptly puts it:
"You try to reproduce it locally. You can’t reproduce it (different data, different environment)" [7].
This highlights why testing across multiple environments is essential to resolving these elusive issues.
Step 2: Investigate Logs and Trace Requests
Once you’ve confirmed the error, the next step is figuring out where and why it’s happening. This involves diving into your logs and tracing the journey of failing requests throughout your system.
Analyzing Server Logs
Logs are your first line of defense. They come from different layers – web server, application, and process manager – and each provides clues about unique failure points [9][1].
Start by monitoring your logs in real time while reproducing the error. Here are some common log locations:
- Nginx:
tail -f /var/log/nginx/error.log - Apache:
/var/log/apache2/error.log - Laravel:
storage/logs/laravel.log - PHP-FPM:
/var/log/php8.x-fpm.log
For IIS users, pay close attention to sub-status codes. A generic 500 error could actually be a 500.13 ("Server too busy") or 500.19 ("Invalid configuration"), which immediately narrows down the issue [3]. If you’re using an Nginx/PHP-FPM setup, search for "upstream" errors – these often point to communication problems between the two [1][2].
To make sense of large log files, consider converting them to JSON and filtering by specific criteria like path, message, or timestamp using tools like jq. This can help you spot patterns, such as errors clustering around certain routes, peak traffic times, or high-load scenarios [5]. For example, in WordPress environments, 99% of 500 errors are linked to codebase conflicts, PHP fatal errors, or memory limits. Use CLI tools like wp core verify-checksums to ensure the integrity of core files [10].
And don’t underestimate the financial impact of downtime – 90% of companies experience hourly losses exceeding $300,000 during outages. IT and networking issues, including configuration problems, account for 23% of major outages [1].
Once you’ve combed through the logs, distributed tracing can help you understand the bigger picture.
Using Distributed Tracing
Logs tell you what happened, but distributed tracing helps explain why by following a request’s journey through multiple services. Debugging production systems is tricky since you can’t attach debuggers to live environments [11]. Distributed tracing captures the timing and status of each operation, presenting the data in a "waterfall" view [11][15].
To make this work, ensure trace headers (like the W3C traceparent header) are passed between services. Double-check that API gateways, load balancers, and Nginx configurations aren’t stripping these headers. Adopting the W3C Trace Context standard ensures compatibility across your system [14]. By embedding Trace IDs into log entries, you can piece together the story of a failed request without needing to replicate the issue locally [13]. As Nawaz Dhandala from OneUptime puts it:
"Reproducing production bugs locally is often impossible… But if your logs are correlated with your traces, you do not need to reproduce the bug" [13].
When reviewing trace waterfalls, look for patterns like:
- N+1 query loops: Repeated database queries, often visible as 50+ similar spans.
- Inefficient service calls: Sequential calls that should be parallelized.
- Timeout cascades: Multiple spans ending at the same millisecond, signaling a chain reaction.
- Retry storms: One slow dependency triggering retries that snowball into excessive downstream calls, potentially overwhelming your system [15].
For instrumentation, OpenTelemetry (OTel) offers a vendor-neutral option to avoid being locked into specific tools [12]. If you’re on a budget, TraceKit provides a cost-effective solution with plans starting at $29/month for 1 million traces.
Armed with this data, you’ll be better prepared to capture live application states during failures.
Step 3: Capture Application State During Failures
Once you’ve analyzed logs and traces, the next step is to capture the application state during failures. Logs and traces can show where errors occur, but capturing the state helps uncover why they happen.
Collecting Debug Information
During a failure, snapshot all relevant data – this includes database queries, API payloads, memory states, and environment variables. Distributed tracing can help by providing timing and metadata for each operation involved in the failure [6].
Consider using JSON structured logging to organize and filter data by attributes like request ID, path, or timestamp. Tools such as jq are particularly useful for this [5]. Temporarily increasing log levels in production can also help capture additional warnings and messages that provide crucial context around the issue.
For deeper inspection, configure your system to generate core dumps or memory snapshots at the time of a crash. These snapshots allow you to examine the heap, stack, and thread states to understand variable values and execution flow [8]. For example, in October 2025, Microsoft 365 used telemetry and logging to track down a memory leak causing an intermittent bug under heavy load – a problem that was otherwise hidden among thousands of successful runs [8].
Additionally, capture non-deterministic signals like the system clock, pseudo-random number generator (PRNG) seeds, and network I/O. These details are essential for replaying the exact conditions of the failure [16]. As DebuggAI explains:
"If you can create a reproducible trace that captures the signals your flaky test depends on, you can make flakiness tractable. The AI assists, but determinism does the heavy lifting" [16].
Tools like TraceKit simplify this process with live breakpoints, which automatically capture variable states in production without requiring redeployment. This makes it easier to snapshot the exact conditions leading up to the failure.
Identifying Trigger Patterns
Once you’ve gathered enough state data, start looking for patterns. Are errors tied to specific routes, user actions, or input payloads? For instance, latency patterns – such as requests completing in either 30ms or 800ms – might suggest two distinct code paths (e.g., a fast cache hit versus a slow full scan). Traces can reveal which path led to a 500 error [6].
Correlating telemetry across logs using request IDs can turn seemingly random failures into reproducible issues [1]. Combining this with code reviews, detailed logging, and automated reproduction scripts can reduce the time-to-fix by 45% [8].
When analyzing trace waterfalls, focus on the critical path – the longest chain of sequential operations. Operations running in parallel don’t impact total duration, so identifying bottlenecks in sequential steps is crucial [6]. Using this method, teams have successfully parallelized slow API calls to improve performance [6].
Additionally, compare failure timestamps with environmental metrics to uncover external factors. In January 2026, TELUS researchers used a tool called "FlaXifyer" to analyze 2,458 CI/CD job failures. By leveraging fine-tuned language models, they achieved an 84.3% Macro F1 score in predicting failure categories, helping to diagnose intermittent issues [17].
Step 4: Use Observability Tools for Live Debugging
Observability tools offer a game-changing way to inspect production code instantly, without the need for redeployment. Instead of the lengthy process of adding log statements, pushing code changes, and waiting for CI/CD pipelines to complete (which can take 15–30 minutes), these tools let you debug live. This approach builds directly on the earlier steps of state capture and trigger pattern analysis, giving you immediate insights.
Using TraceKit for Live Breakpoints
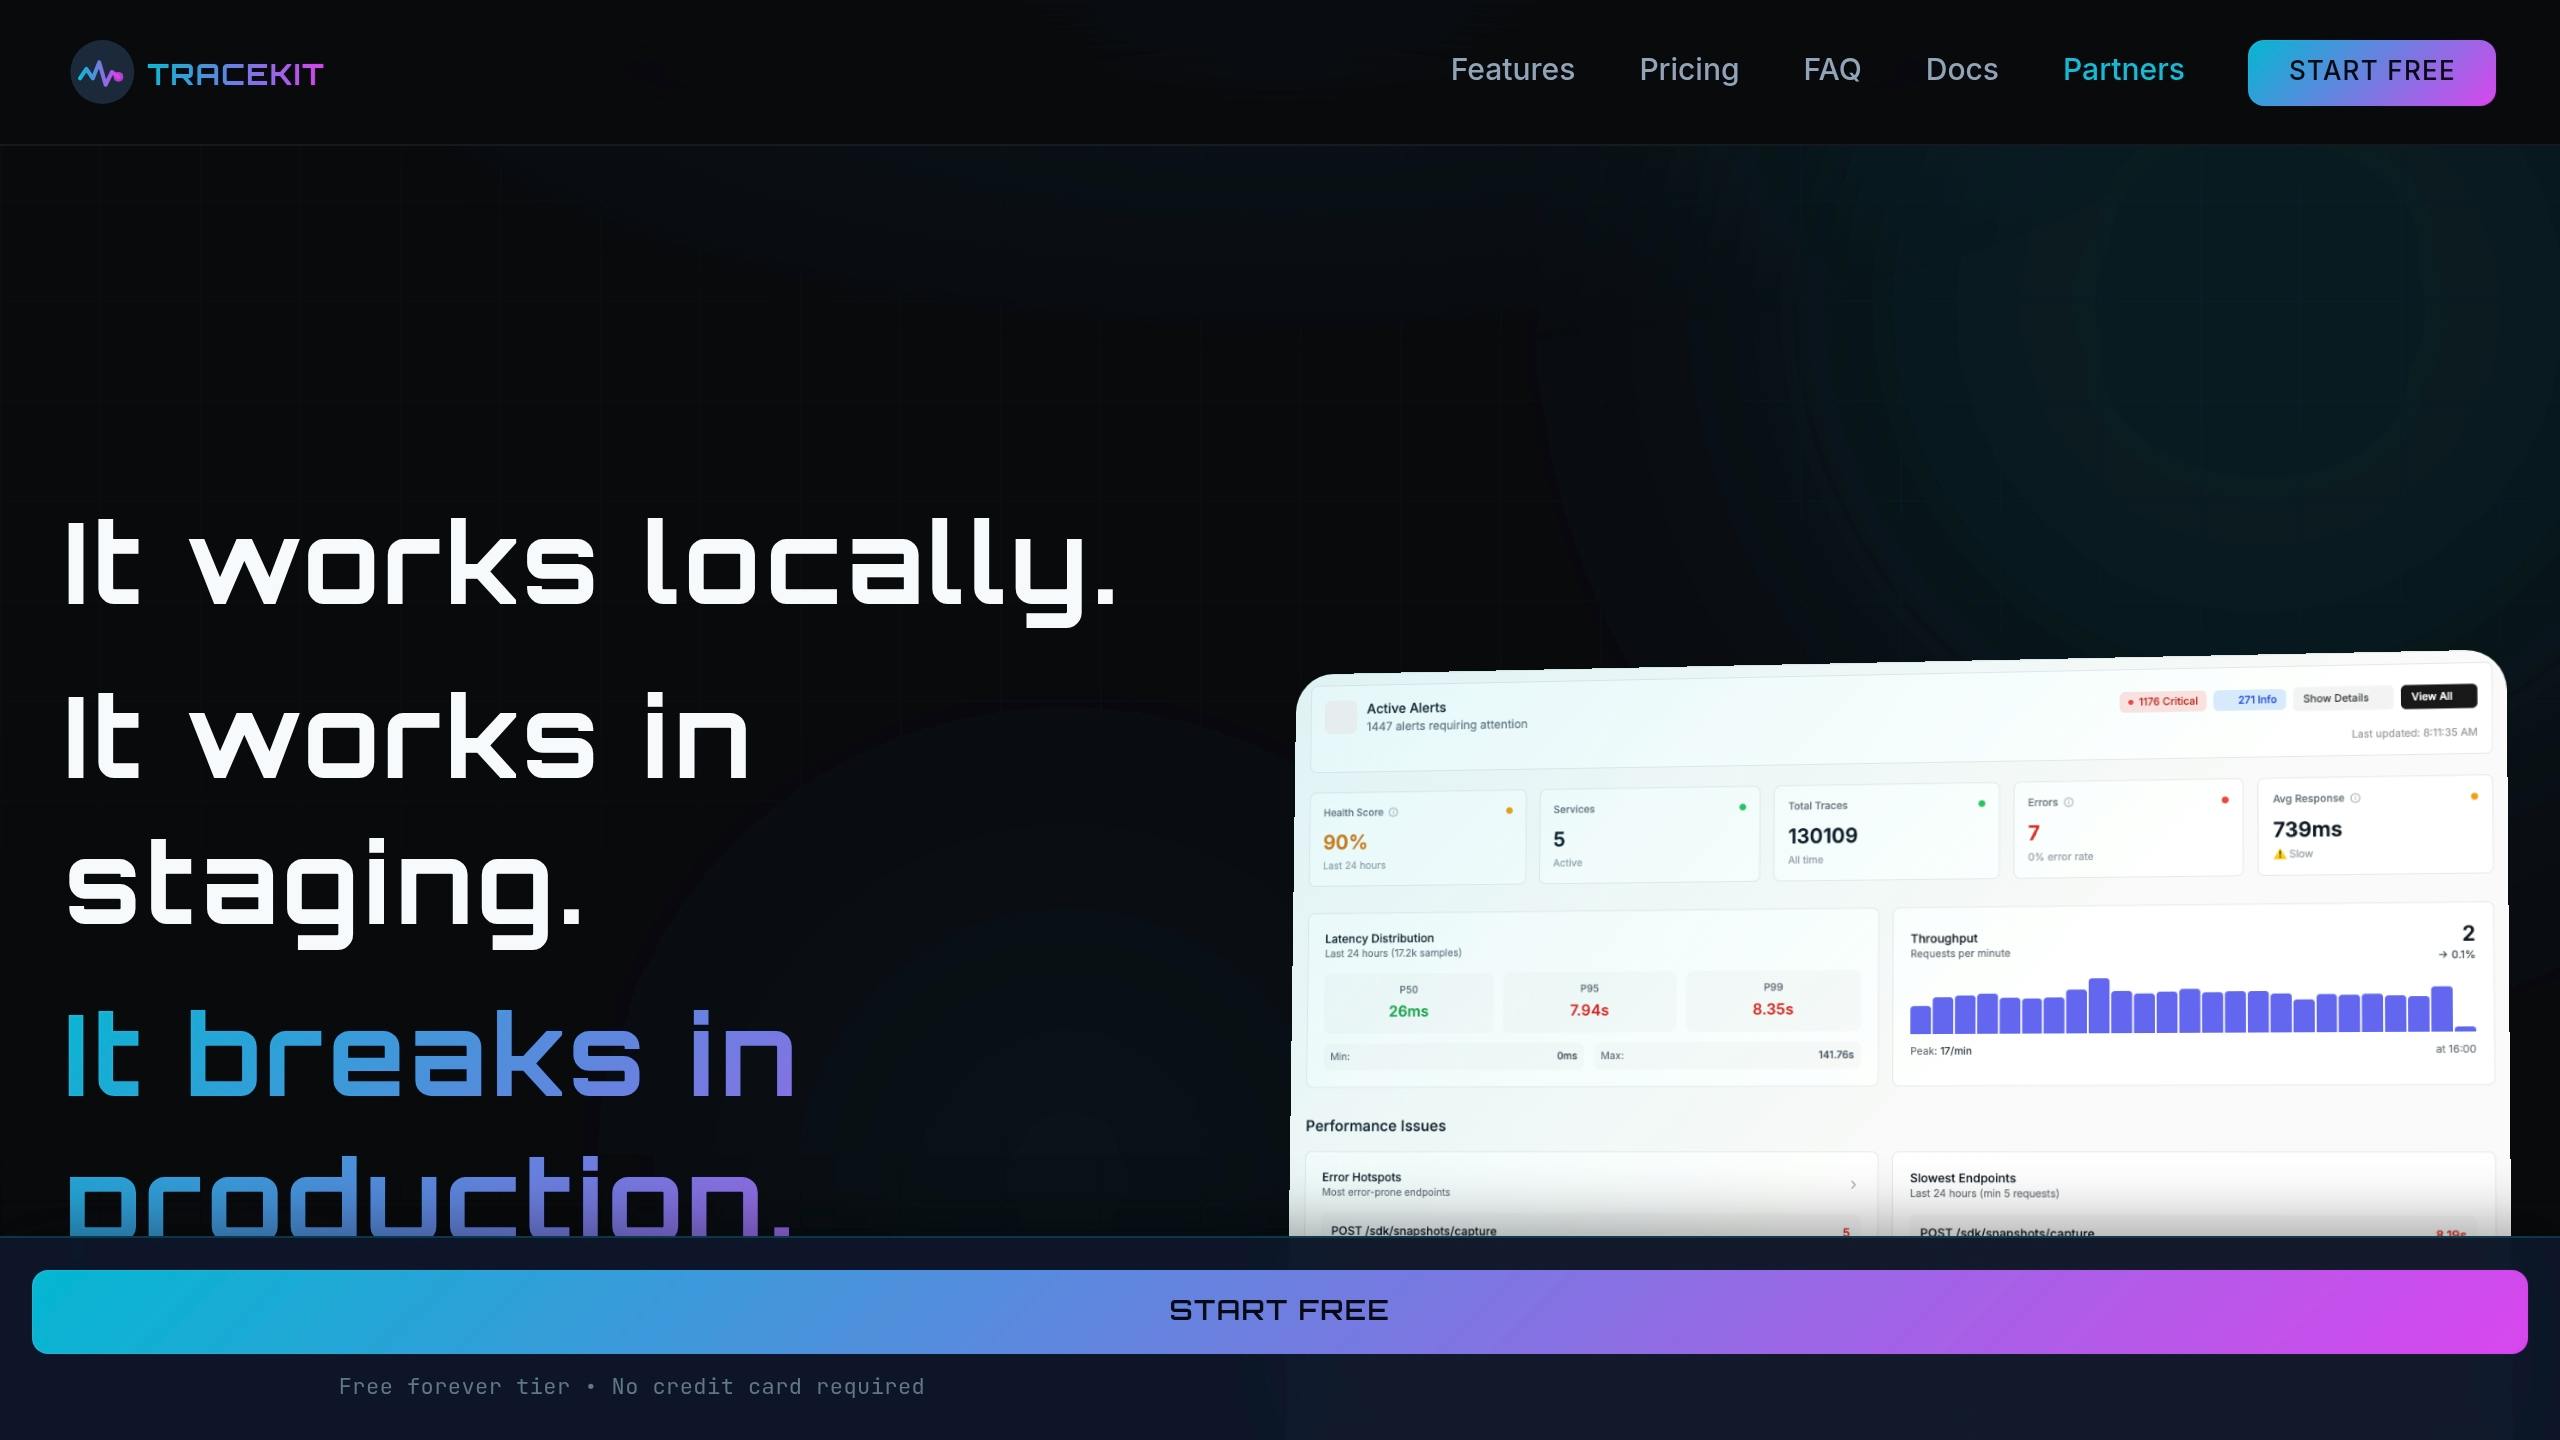
Live breakpoints allow you to set capture points at specific lines of code without halting your application or redeploying it. When these breakpoints are triggered, they capture variable states, payloads, and headers – all with less than 1ms overhead [18][20].
Take Alex, a SaaS founder, as an example. He faced an issue with intermittent Stripe webhook failures: payments were processing, but subscriptions weren’t activating. Using TraceKit, Alex uncovered a race condition in an asynchronous database write in just 10 minutes – something traditional logs couldn’t reveal. As Alex put it:
"I spent two days adding logs, redeploying, waiting. Every time I thought I had it, I’d realize I needed to log something else… [With TraceKit] Time to find the bug: 10 minutes." [18]
The tool’s conditional capture logic makes it even more powerful, isolating specific errors with precision [21]. Setup is quick – taking under four minutes – and it introduces less than 5% performance overhead [18]. This capability not only speeds up debugging but also integrates seamlessly with earlier troubleshooting methods like log analysis and state capture.
Benefits of AI-Powered Observability
AI-powered observability tools take the heavy lifting out of debugging by automating much of the analysis. Features like anomaly detection learn normal patterns and can flag issues such as DDoS attacks, traffic surges, or security vulnerabilities before they impact users [18]. Flame graphs and service dependency maps make it easier to spot performance bottlenecks, such as slow database queries or asynchronous boundary issues that traditional logs might miss [11].
TraceKit goes a step further by linking errors to complete request contexts, providing a clear view of execution flows across systems. This is especially critical now, as 78% of developers rely on AI coding assistants, often working with code they didn’t write themselves [18][19].
Ali Khorsandfard, the creator of the Gemvc PHP Framework, highlighted the value of these tools:
"TraceKit helped me find performance issues before I released the new version of my framework. I was able to fine-tune everything and fix problems before they hit users." [18]
With tools like TraceKit, debugging becomes faster, smarter, and more efficient, giving you the upper hand in maintaining seamless application performance.
Step 5: Identify Patterns and Deploy Fixes
Analyzing Failure Patterns
After capturing the application state and tracing requests, the next step is to dig into the data to uncover the root cause of those intermittent 500 errors. Start by comparing successful traces with problematic ones. Look for differences like added spans, spikes in latency, or changes in error rates[22].
Pay attention to latency distributions, especially in the p95 and p99 percentiles. These are often where intermittent errors hide, rather than in the average latency. For instance, a bimodal latency distribution – one cluster around 200ms and another between 4,500ms and 5,000ms – can reveal distinct performance paths[23]. A real-world example comes from February 2026, when the OneUptime engineering team investigated intermittent timeouts in a checkout service. They discovered that while 85% of requests completed in under 200ms, the remaining 15% took between 4,500ms and 5,000ms. By adding pod-level attributes, they found that the slower requests were tied to two pods experiencing CPU throttling. Moving these pods to a dedicated node pool resolved the issue entirely[23].
To narrow down the problem, use tools like dimensional slicing. Break down data by factors such as pod ID, database pool status, or geographic region. Service dependency maps can also help you identify which upstream services are being impacted, making it easier to target fixes[22][23]. As Nawaz Dhandala puts it:
"Collecting traces is only half the battle. The real value comes from analyzing them systematically to find performance bottlenecks, track down errors, and understand system behavior."[22]
Once you’ve identified patterns, apply fixes and monitor closely to ensure the problem is resolved.
Testing and Monitoring Fixes
Tools like TraceKit make it easier to validate fixes during a canary deployment. Start by rolling out your fix to a small portion of traffic (around 10%) and use trace data to check for any regressions before expanding the rollout[11]. Keep an eye on error codes using CLI queries and track latency percentiles (p95, p99) to ensure performance is improving[5][11].
For further assurance, tools with anomaly detection capabilities, like TraceKit, can automatically alert you if unexpected patterns arise[7][22]. When dealing with asynchronous tasks, make sure the trace context is maintained across task boundaries to avoid losing visibility into potential issues[11][14]. If monitoring reveals that the fix isn’t working as intended, roll back immediately and continue the investigation[5].
TraceKit vs Datadog for Debugging Intermittent Errors
When dealing with intermittent 500 errors, selecting the right debugging tool can make all the difference. Datadog and TraceKit offer distinct solutions, catering to different needs, especially for smaller teams operating on tighter budgets.
Datadog is an all-in-one observability platform designed with enterprise-level teams in mind. It combines infrastructure monitoring, APM, logs, metrics, and distributed tracing into a single dashboard. However, this breadth of features comes at a cost. For a 5-person startup managing 10 services, monthly expenses can range from $800 to $2,000 before earning any revenue[19]. Its pricing structure – $31 per host per month for APM, plus additional charges for metrics and logs – can quickly add up for small teams[24].
On the other hand, TraceKit focuses solely on debugging production issues, offering a streamlined approach for pinpointing errors. Its live breakpoints (referred to as "capture points") allow developers to inspect variable states at the exact moment an error occurs, eliminating the need for extra log statements, redeployments, or waiting for bugs to resurface. For example, a solo founder resolved a recurring Stripe webhook failure in just 10 minutes using TraceKit. Starting at $29 per month for 1 million traces, TraceKit is a more budget-friendly option for small teams[19].
"TraceKit helped me find performance issues before I released the new version of my framework. I was able to fine-tune everything and fix problems before they hit users." – Ali Khorsandfard, Creator of Gemvc PHP Framework[18]
This comparison underscores the value of tools tailored for quick, live debugging, especially for teams prioritizing simplicity and cost-efficiency over extensive monitoring capabilities.
Feature and Pricing Comparison
The table below highlights the differences between TraceKit’s focused approach and Datadog’s enterprise-oriented suite.
| Feature | TraceKit | Datadog |
|---|---|---|
| Starting Price | $29/month (1M traces) | $31/host/month (APM only) |
| Live Debugging Capabilities | Live breakpoints; capture state without redeploy | Log-based correlation; no native breakpoints |
| Setup Time | ~4 minutes; 1-command install | Can take weeks; requires agent configuration |
| Pricing Model | Request-based (predictable) | Host-based + per-metric/log fees (complex) |
| AI Anomaly Detection | Included; auto-highlights N+1 queries, slow APIs | Available; requires manual alert configuration |
| Best For | Solo developers and teams of 2-10 | Enterprise teams with dedicated DevOps |
| Infrastructure Monitoring | Not included (APM/tracing only) | Comprehensive (CPU, disk, memory) |
In one example, a 5-person SaaS company transitioned from Datadog to TraceKit in just 3 hours of active work in 2026. By swapping Datadog agents for TraceKit’s OpenTelemetry SDK, they reduced their monthly costs from $4,800 to $950, saving 80% while maintaining visibility into 10 million requests per month[24].
"The $46,000/year savings let us hire another engineer. The simpler architecture reduced operational overhead. The predictable pricing eliminated invoice anxiety." – Terry Osayawe, founder of TraceKit[24]
For small teams, TraceKit’s live debugging features and straightforward pricing provide a faster, more affordable solution. However, if your needs include full-scale infrastructure monitoring (CPU, disk, memory) alongside APM, Datadog’s extensive suite might justify its higher cost.
Conclusion
Intermittent 500 errors don’t have to feel like unsolvable mysteries. By following a structured process – reproducing the error, analyzing logs, capturing the application state, leveraging live debugging tools, and identifying patterns – you can turn troubleshooting into a predictable and manageable task.
Modern observability tools have reshaped the way developers address these issues. Gone are the days of waiting hours for redeployments. Tools like TraceKit enable a faster workflow: trace, inspect, and fix. Features like live breakpoints let you capture error states in real time, while distributed tracing uncovers cascading failures – all without requiring a redeployment.
"The biggest production outages come not from big failures, but small ones chained together." – Laura Nolan, SRE at Slack [26]
For smaller teams with limited budgets, affordability matters. While enterprise platforms might cost upwards of $2,000 per month, TraceKit offers a starting point at $29/month for 1 million traces. It delivers essential debugging capabilities without the added cost of comprehensive infrastructure monitoring. Choosing tools that align with your specific needs – like focusing on quick bug fixes over extensive monitoring – can save both time and money.
Fixing these errors promptly does more than stabilize your application – it also safeguards your search engine rankings. Persistent 500 errors can drop your SEO rankings by 20–30 positions in just a few weeks [25]. A swift resolution ensures a better user experience and protects your business outcomes. With the right tools and a systematic approach, those intermittent errors become manageable and solvable challenges.
FAQs
How do I reliably reproduce an intermittent 500 error?
To consistently replicate an intermittent 500 error, leverage distributed tracing to monitor the request paths and capture the state at the moment the error arises. Tools such as TraceKit are particularly useful for recording variable states and request details in real time, which can help pinpoint patterns.
Here’s the approach: trace the flow of requests, log the error states, identify recurring patterns, and then repeat the request under the same conditions. This method can turn unpredictable errors into reproducible ones, making them easier to diagnose and resolve.
How can I connect logs and traces using a request ID?
To link logs and traces effectively, start by assigning a unique request ID to each HTTP request. This ID should be included in both your logs and trace data. Make sure the request ID is passed through all services and consistently logged at every step. Tools like OpenTelemetry can simplify this process by helping you correlate logs with traces, giving you a clear view of a request’s journey through your system.
What should I capture about app state when a 500 error happens in production?
When a 500 error pops up in production, it’s crucial to capture the app’s detailed state to make debugging easier. Pay close attention to the request context – this includes key details like variables, environment specifics, the request path, error message, and timestamp. Collecting this information provides a clear snapshot of what the app was doing when the error occurred, making it much easier to trace and pinpoint the root cause.