
Debugging production issues without redeploying can save you hours of frustration. Instead of repeatedly adding logs, waiting for CI/CD, and risking downtime, tools like TraceKit let you debug live systems instantly. With live breakpoints, you can inspect variable states, request payloads, and stack traces directly from a dashboard – without interrupting your service or introducing new bugs.
Here’s what you’ll learn:
- Why traditional debugging struggles in production.
- How live breakpoints work with minimal performance impact (<5% overhead).
- Step-by-step setup for TraceKit across PHP, Node.js, Go, and Python.
- Key differences between TraceKit and Datadog for debugging needs.
- Best practices for protecting data and scaling live debugging.
Advanced Techniques for Production Debugging
sbb-itb-0fa91e4
Why Traditional Debugging Fails in Production
Debugging in live systems is a whole different ballgame compared to local or staging environments. These controlled setups just can’t mimic the sheer complexity of production – things like massive data loads, unpredictable user behavior, or concurrency problems that only surface under real-world pressure [4][5].
The Guess-and-Redeploy Cycle
The typical debugging routine in production feels like a frustrating loop. You add a log statement, commit your changes, and then endure a 15–30 minute wait for the CI/CD pipeline to do its thing [1]. Once you see the logs, you realize you missed something – maybe a key variable wasn’t captured, or a specific code path wasn’t logged. So, you go back, tweak the code, and repeat the cycle. For particularly tricky issues, this process can stretch out for 2 to 3 days just to pinpoint and resolve the root cause [4].
Here’s a real-world example: a team that switched to live logging managed to cut their debugging time from days to mere hours, preventing significant revenue losses in the process [4].
Challenges of Debugging in Live Environments
In production, you can’t just hit “pause” like you would in your local debugger. Tools like GDB, which freeze the program to let you inspect variables, are a no-go in live systems. Pausing production code could mean request timeouts, disrupted user sessions, or even full-blown system instability. Even logging, a common fallback, can come with its own risks – like slowing down performance or causing memory leaks [1][5][7].
Then there’s the issue of modern cloud infrastructure. With ephemeral containers, the instance carrying the bug might disappear before you even get a chance to investigate [6]. And since most systems aren’t fully instrumented ahead of time, you often lack the critical data needed to understand what went wrong [5][6].
"The biggest production outages come not from big failures, but small ones chained together." – Laura Nolan, SRE, Slack [5]
These hurdles highlight why traditional methods often fall short and set the stage for tools like live breakpoints, which are covered in the next section.
Getting Started: Setting Up Live Debugging with TraceKit
You can deploy TraceKit in production in less than 5 minutes[10], allowing you to capture variable states without needing to redeploy. This setup aligns with TraceKit’s core goal: enabling quick, hassle-free production debugging.
Account Setup and Agent Installation
To get started, install the TraceKit CLI using either Homebrew or curl:
- Homebrew:
brew install Tracekit-Dev/tap/tracekit - Curl:
curl -fsSL https://raw.githubusercontent.com/Tracekit-Dev/cli/main/install.sh | sh
Once installed, run tracekit init in your project’s root directory. The CLI will automatically detect your framework and guide you through the account setup process. You’ll provide your email, verify it with a code, and choose a service name. The CLI then generates an API key and saves it directly to your .env file.
For additional SDK installation, use the following commands based on your programming language:
- Go:
go get github.com/Tracekit-Dev/go-sdk - Node.js:
npm install @tracekit/node-apm - PHP:
composer require tracekit/tracekit-php - Python:
pip install tracekit-sdk
"Setup took about 10 minutes – just added the SDK to TrustyPost and traces started flowing immediately. The auto-instrumentation picked up my HTTP calls and database queries without any extra config." – Terry Osayawe, Co-Founder[1]
During SDK initialization, set EnableCodeMonitoring: true in your application’s entry point. This ensures all components are instrumented. Without this setting, you’ll only have distributed tracing.
For production environments, it’s best to store your API key securely in a secrets manager like AWS Secrets Manager or HashiCorp Vault instead of plain text files. If your application experiences heavy traffic, configure a SamplingRate (e.g., 0.1 for 10% of traces) to manage data volumes effectively.
Once the SDK is installed and configured, move on to verifying your connection through the TraceKit dashboard.
Configuring the TraceKit Dashboard
After completing the setup, the CLI sends a test trace to confirm the connection. Head to https://app.tracekit.dev to verify that your service appears on the dashboard. The dashboard automatically instruments your application’s API, controller, and database layers, eliminating the need for extra configuration.
TraceKit’s design ensures minimal performance impact, with less than 5% overhead and under 1ms added per request[3]. It operates asynchronously, so it won’t interrupt your application or cause delays.
In January 2026, Adil Ali implemented TraceKit in a Python Flask application and achieved real-time trace visibility in under 15 minutes. Similarly, Sarwar Hossain reported traces appearing within 2 minutes after following the documentation.
The dashboard provides a clear view of all incoming requests, database queries, and external API calls – no additional instrumentation code required. Next, you’ll learn how to set and use live breakpoints effectively.
How to Set and Use Live Breakpoints
Live breakpoints allow you to capture variable states in production code without pausing your application or redeploying it. Unlike traditional debuggers that halt execution, TraceKit’s breakpoints work asynchronously. Your app keeps running while data is collected in the background, with minimal impact – less than 5% overhead. For the Go SDK, the added latency is typically under 1ms per request[3]. Here’s a guide to setting breakpoints, analyzing snapshots, and leveraging advanced tools for seamless production debugging.
Placing Live Breakpoints
To set a live breakpoint, head to the TraceKit dashboard at https://app.tracekit.dev and choose the service you want to debug. From there, you can browse your code directly within the dashboard. Locate the specific file and line where you suspect an issue, and click the line to place your breakpoint.
Want more precision? You can create conditional breakpoints that activate only when certain criteria are met – like when a user ID matches a specific value or a variable exceeds a defined threshold. This ensures only relevant data is captured, keeping overhead low. You can also tweak sampling settings to control how much data is collected. Once you’ve set your breakpoint, its status will shift from "Pending" to "Active" in the dashboard, indicating it’s ready to go.
Viewing Snapshots and Variable States
When a live breakpoint is triggered, TraceKit captures a snapshot of your code’s state at that exact moment. These snapshots are a goldmine for debugging – they include the full stack trace, all variable states, request payloads, headers, and even database queries. Forget combing through log files or guessing what should have been logged; everything you need is already captured.
You can find these snapshots in the "Snapshots" tab of the dashboard.
"TraceKit lets you capture variable state at any point in your code – including the moments before an error, or for bugs that don’t throw exceptions at all."[1]
The snapshot view details variables with their actual values, even down to nested objects and array contents. For Go developers, it’s important to pass context.Context through function calls to ensure continuity in tracing and to capture request-specific data accurately[3].
Using Advanced Debugging Tools
TraceKit doesn’t stop at breakpoints – it also offers tools like flame graphs and dependency maps to give you a clear picture of request flow and performance across distributed systems[1][3]. The distributed trace view follows a request from start to finish, showing every database query, API call, and internal function it touches.
Framework Examples for PHP, Node.js, Go, and Python
Let’s dive into how TraceKit can be implemented across popular frameworks. While the process may vary slightly, the core steps remain the same: install the SDK, enable monitoring, and use the dashboard to capture variable states.
Example: Debugging with Laravel (PHP)
TraceKit integrates effortlessly with Laravel. Start by installing the TraceKit package using composer require tracekit/laravel-apm, then run php artisan tracekit:install to configure it [11]. Add your API key to the .env file and enable monitoring by setting TRACEKIT_CODE_MONITORING_ENABLED=true [11].
Once integrated, Laravel automatically tracks HTTP requests, database queries, Redis operations, and queue jobs – no extra coding required [9]. For custom debugging, use the helper function tracekit_snapshot('label', ['key' => $value]). For instance, if you’re troubleshooting a payment issue, place this function before the Stripe API call to capture the exact payload. The dashboard will show the complete variable state, including nested data. If you need to explore deeply nested data, modify the TRACEKIT_CODE_MONITORING_MAX_DEPTH setting in the configuration (default is 3 levels) [11].
"TraceKit helped me find performance issues before I released the new version of my framework. I was able to fine-tune everything and fix problems before they hit users."
- Ali Khorsandfard, Creator of Gemvc PHP Framework [1]
Flame graphs in Laravel are a powerful way to spot bottlenecks. For example, an e-commerce platform reduced checkout delays by 82% in 2025. The flame graph flagged two key issues: email sending was blocking responses for 3.5 seconds, and tax calculations were making 50 redundant API calls. By queuing emails and caching tax data, they cut response times from 5.2 seconds to just 900ms [9].
Example: Debugging with Express (Node.js)
For Node.js, TraceKit integrates directly with Express. Start by initializing the SDK at the top of your main file:
TracekitNodeSDK.init({ serviceName: 'your-app', apiKey: 'your-key' }) [8].
Initializing early ensures automatic instrumentation across middleware and routes. The SDK captures HTTP requests, database calls, and external API interactions without needing manual setup.
To set a live breakpoint, simply open the TraceKit dashboard, navigate to your Express route file, and click the line number where you want to monitor state [8]. You can define which variables to capture directly through the dashboard, eliminating the need for code changes [8]. This makes it easier to debug unpredictable issues.
In late 2025, a SaaS founder named Alex resolved a failing Stripe webhook in just 10 minutes by adding a capture point at the webhook handler. This revealed a race condition that had been causing the issue [1].
Example: Debugging with Gin (Go)
TraceKit also supports Go applications using the Gin framework. Install the SDK with:
go get github.com/Tracekit-Dev/go-sdk
Then, initialize it in your main() function [3]. Apply sdk.GinMiddleware() to automate route tracing, and use sdk.CheckAndCaptureWithContext for deeper inspection at specific points in your code [3]. To maintain trace continuity across goroutines, pass c.Request.Context() through your function calls [3].
The SDK is designed to be lightweight, adding less than 1ms of latency per request, with individual checkpoints incurring under 5ms of overhead [3]. For high-traffic applications, you can adjust sampling rates to manage data volume while maintaining visibility.
Example: Debugging with Flask (Python)
TraceKit integrates seamlessly with Flask and can be set up in about 15 minutes using its documentation [1]. Install the SDK via pip, configure your TRACEKIT_API_KEY and TRACEKIT_SERVICE_NAME in your environment variables, and the SDK will automatically trace endpoints without requiring additional instrumentation [1][9].
"We set up TraceKit in our Python Flask app in under 15 minutes using the docs… Traces started showing up in the dashboard almost right away."
- Adil Ali, Fullstack Developer [1]
The dashboard’s "Browse Code" feature allows you to set capture points on specific lines of code, enabling you to inspect variable states in real-time without adding print statements or redeploying. For production environments, you can balance performance and monitoring by setting TRACEKIT_CODE_MONITORING_POLL_INTERVAL to 30 seconds [11]. If sensitive data is a concern, disable database query bindings by setting TRACEKIT_INCLUDE_BINDINGS=false in your configuration [11].
These examples highlight how TraceKit adapts to different frameworks, offering powerful debugging tools across various production environments.
TraceKit vs Datadog: Choosing the Right Debugging Tool
TraceKit vs Datadog: Features, Pricing, and Setup Comparison for Production Debugging
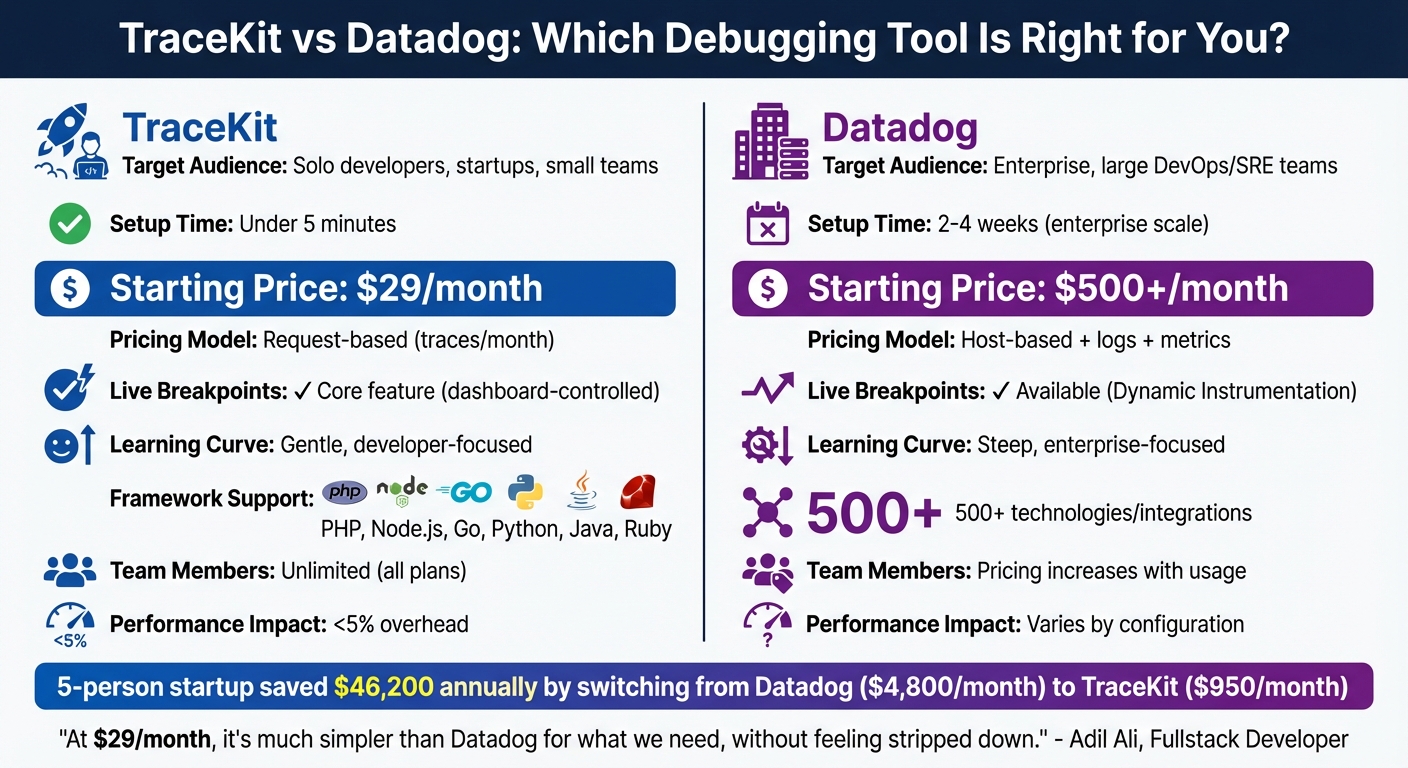
When it comes to live debugging, picking the right tool can make all the difference. The choice between TraceKit and Datadog boils down to your team’s size, budget, and the level of complexity you need. Datadog shines in enterprise environments – ideal for large DevOps teams managing hundreds of hosts with extensive infrastructure monitoring. It boasts over 500 integrations but comes with a steep learning curve and rising costs as you scale. On the other hand, TraceKit is designed for solo developers and small teams, offering quick solutions for production issues without the overhead of enterprise-grade dashboards or hefty expenses [1][12].
Setup and Pricing: What Fits Your Team?
The setup process for these tools differs significantly. TraceKit gets you up and running in under five minutes with a simple one-command installation (tracekit init). In contrast, deploying Datadog across an organization can take anywhere from two to four weeks [1][10]. For example, a five-person startup transitioned six services from Datadog to TraceKit in just three hours. This switch reduced their monthly bill from $4,800 to $950, saving them $46,200 annually. They achieved this by replacing Datadog agents with TraceKit’s OpenTelemetry SDK and removing sidecar containers [13].
Pricing structures also vary dramatically. TraceKit uses a straightforward request-based model starting at $29/month for one million traces. Meanwhile, Datadog’s host-based pricing starts at $31 per host per month, with additional charges for logs ($0.10/GB) and custom metrics ($5 per 100 metrics). This model can quickly drive up costs, especially for teams scaling horizontally with containers, as each new container adds to the bill. A small team running 10 services could easily spend $800–$2,000 per month on Datadog, even before generating revenue [2][13].
"At $29/month, it’s much simpler than Datadog for what we need, without feeling stripped down."
- Adil Ali, Fullstack Developer [1]
Debugging Features: Live Breakpoints and Usability
Live breakpoints set these tools apart. TraceKit offers this as a core feature – just click a line number in the dashboard to capture variable states without touching the code or redeploying [2]. Datadog provides similar functionality through Dynamic Instrumentation, but it requires more complex setup and is often reserved for higher-tier plans. TraceKit’s interface is streamlined for debugging workflows: you click a trace, identify the issue, and fix it. Datadog, while offering comprehensive visibility, can overwhelm smaller teams with its dense feature set [1][12].
Comparison Table: TraceKit vs Datadog
| Feature | TraceKit | Datadog |
|---|---|---|
| Primary Target | Solo developers, startups, small teams | Enterprise, large DevOps/SRE teams |
| Setup Time | Under 5 minutes | 2–4 weeks (enterprise scale) |
| Starting Price | $29/month | $500+/month (typical usage) |
| Pricing Model | Request-based (traces/month) | Host-based + logs + metrics |
| Live Breakpoints | Core feature (dashboard-controlled) | Available (Dynamic Instrumentation) |
| Learning Curve | Gentle, developer-focused | Steep, enterprise-focused |
| Framework Support | PHP, Node.js, Go, Python, Java, Ruby | 500+ technologies/integrations |
| Team Members | Unlimited (all plans) | Pricing increases with usage |
| Performance Impact | <5% overhead | Varies by configuration |
TraceKit clearly caters to small teams and solo developers by offering a streamlined, cost-effective solution for debugging in production. Meanwhile, Datadog is better suited for enterprises requiring detailed infrastructure monitoring across CPU, memory, and network layers, with the budget to support its modular, usage-based pricing model [1][12]. This breakdown highlights how TraceKit simplifies in-production debugging for those who value agility and affordability.
Best Practices for Live Debugging in Production
Once you’ve set up live debugging in production, it’s crucial to follow key practices to protect sensitive data and maintain system performance. Live debugging comes with risks – both to data security and application stability – so careful planning is essential. In 2025 alone, the U.S. reported over 3,300 confirmed data breaches, affecting millions of individuals [14]. By implementing proven strategies, you can safeguard your debugging process while maintaining user trust.
Protecting Sensitive Data
One of the most important steps is data masking. When capturing variable states in production, ensure sensitive information like emails or credit card numbers is masked. Techniques like tokenization and format-preserving pseudonymization are highly effective. For instance, format-preserving tokenization allows you to maintain the structure of data (e.g., emails still look like emails) without exposing actual values [15]. In distributed systems, deterministic pseudonymization can map inputs to consistent pseudonyms, preserving data relationships across services without compromising security [17].
Another critical step is to strip personally identifiable information (PII) from URLs. Replace sensitive identifiers with tokens to prevent web servers from logging them [15]. Structured logging with key/value pairs is also highly recommended. Use automated filters to block sensitive keys such as "password", "ssn", or "api_key" [15]. This is especially important, as 87% of consumers say they won’t engage with a company if they have concerns about its security practices [15].
"If your load test [or debug session] requires real customer data to ‘work,’ the test scenario is flawed, not the masking." – LoadView [17]
Access to debugging tools and captured data should be tightly controlled. Implement Role-Based Access Control (RBAC) to limit who can view debugging dashboards and snapshots. Encrypt data both at rest (using AES-256) and in transit (using HTTPS/TLS 1.3) [16]. Tools like TraceKit ensure that live breakpoints don’t pause your application, maintaining a performance overhead of less than 5% [1].
Managing Data Retention and Cleanup
To prevent debugging data from piling up indefinitely, set up automated cleanup policies. These policies help you comply with regulations like GDPR, which requires data to be kept only as long as necessary, or HIPAA, which mandates retention for up to six years for healthcare data [18][21][22]. For example, TraceKit offers retention options ranging from 7 days (free plan) to 60 days (Pro plan at $299/month) [1].
In November 2025, Sohail x Codes implemented automated cleanup, reducing a 2TB database to 600GB. This not only improved query performance by 40% but also saved $3,000 per month [18].
"One bug in a cleanup script can destroy valuable data forever. Test everything. Twice." – Sohail x Codes [18]
When working with large datasets, batch processing is essential. Processing records in chunks of 1,000 at a time prevents table locks and ensures production performance remains unaffected [18][20]. Always run a dry mode to log and verify deletion actions before executing them [18][19]. Schedule cleanup jobs during off-peak hours and use UTC for retention calculations to avoid issues with daylight savings or time zone offsets [18]. Monitor deletion counts and job durations to catch potential bugs – an unusually high deletion count could indicate a problem with your cleanup logic [18].
With effective cleanup measures in place, you can focus on scaling your debugging processes to handle high-traffic scenarios.
Scaling Live Debugging for High-Traffic Applications
Before enabling live debugging in high-traffic environments, establish baseline metrics and monitor key performance indicators (KPIs) like CPU usage, memory, response latency, and error rates. This helps identify any potential performance issues [23]. Tools like TraceKit use asynchronous execution to ensure capture points don’t pause your application or block the main execution thread [1].
For database-intensive debugging, connection pooling is critical. It minimizes the overhead of opening and closing database connections, which is especially important for applications handling millions of requests daily [23]. TraceKit’s Growth plan ($99/month) supports up to 10 million traces per month, while the Pro plan ($299/month) scales to 50 million traces – ideal for applications processing around 5 million requests per day [1].
To manage storage effectively, consider a tiered storage approach. Use "Hot" storage for frequently accessed traces (7–30 days), "Warm" storage for less frequent access, and "Cold" archiving for long-term compliance [21][22]. Since security incidents often take 100–200 days to detect, retaining logs for at least a year is a smart move for forensic investigations [21].
Conclusion
The days of enduring endless redeploy cycles are behind us. Debugging no longer has to mean wasting hours in the repetitive guess-and-redeploy loop. With live breakpoints, developers can now capture variable states and request context instantly – no need for extra logs, Git pushes, or waiting on CI/CD pipelines. Tools like TraceKit turn a process that used to take days into something you can resolve in mere minutes [1].
Getting started is quick – most teams are fully set up in under 4 minutes [1]. Whether you’re coding in PHP, Node.js, Go, or Python, TraceKit’s auto-instrumentation simplifies setup dramatically. It cuts over 80 lines of OpenTelemetry boilerplate down to just 3 lines of code, all while keeping performance overhead minimal [1][3].
And the cost? At $29/month for 1 million traces – with a free tier that includes 200,000 traces per month [1] – TraceKit is designed to be accessible to everyone, from solo developers to small teams and growing companies. No need for massive budgets or lengthy sales negotiations to achieve production-level observability.
The impact is clear: faster issue resolution and happier users. Stop relying on guesswork – give TraceKit a try today. Set your first live breakpoint, see the exact state of your code, and solve problems in minutes instead of days.
FAQs
Are live breakpoints safe to use in production?
Live breakpoints, especially when used with tools like TraceKit, are built to be non-intrusive, making them a safe option for production environments. These tools allow for real-time debugging without interrupting the application’s functionality or causing downtime. That said, their safety depends on the tool you’re using and the environment in which they’re deployed. To minimize risks, it’s smart to test them thoroughly in staging environments first and closely monitor their initial implementation to ensure they don’t negatively affect live systems.
How do live breakpoints impact latency and CPU usage?
Live breakpoints let you debug directly in production without needing to redeploy. When triggered, they pause code execution, allowing you to inspect variables or incoming requests. However, this can come at a cost – response times might slow down due to the pause, and monitoring these breakpoints can use extra CPU resources, particularly during high traffic. While they’re a handy tool for quick fixes, it’s best to use them cautiously to avoid unnecessary performance hits.
What data should I mask or avoid capturing in snapshots?
When working on debugging in a production environment, it’s crucial to ensure that sensitive data is either masked or completely excluded. This step is essential for protecting user privacy and staying compliant with regulations. Sensitive data includes personally identifiable information (PII), payment details, protected health information (PHI), and other confidential information like Social Security numbers, credit card details, addresses, or phone numbers.
By properly masking or excluding this data, you not only safeguard user privacy but also reduce the risk of regulatory breaches when capturing variable states or snapshots during the debugging process.